The graph given below shows the variations in the population of producers, primary consumers and secondary consumers as well as the amount of dissolved mineral salts in a pond
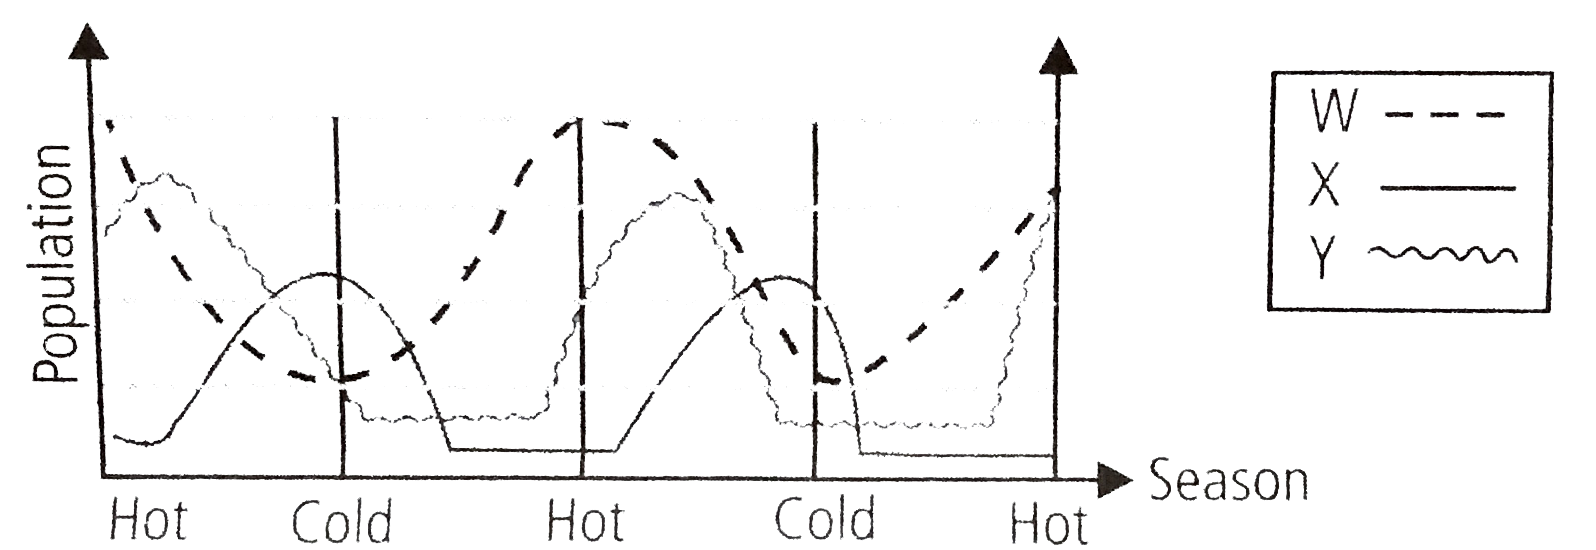
Which one of the following correctly matches each graph?
Producer populationPrimary consumer populationSecondary consumer populationXYW
Producer populationPrimary consumer populationSecondary consumer populationWXY
Producer populationPrimary consumer populationSecondary consumer populationWYX
Producer populationPrimary consumer populationSecondary consumer populationXWY
The correct Answer is:C
Step by step video, text & image solution for The graph given below shows the variations in the population of producers, primary consumers and secondary consumers as well as the amount of dissolved mineral salts in a pond Which one of the following correctly matches each graph? by Biology experts to help you in doubts & scoring excellent marks in Class 12 exams.
Topper's Solved these Questions
Similar Questions
Knowledge Check
- Question 1 - Select One
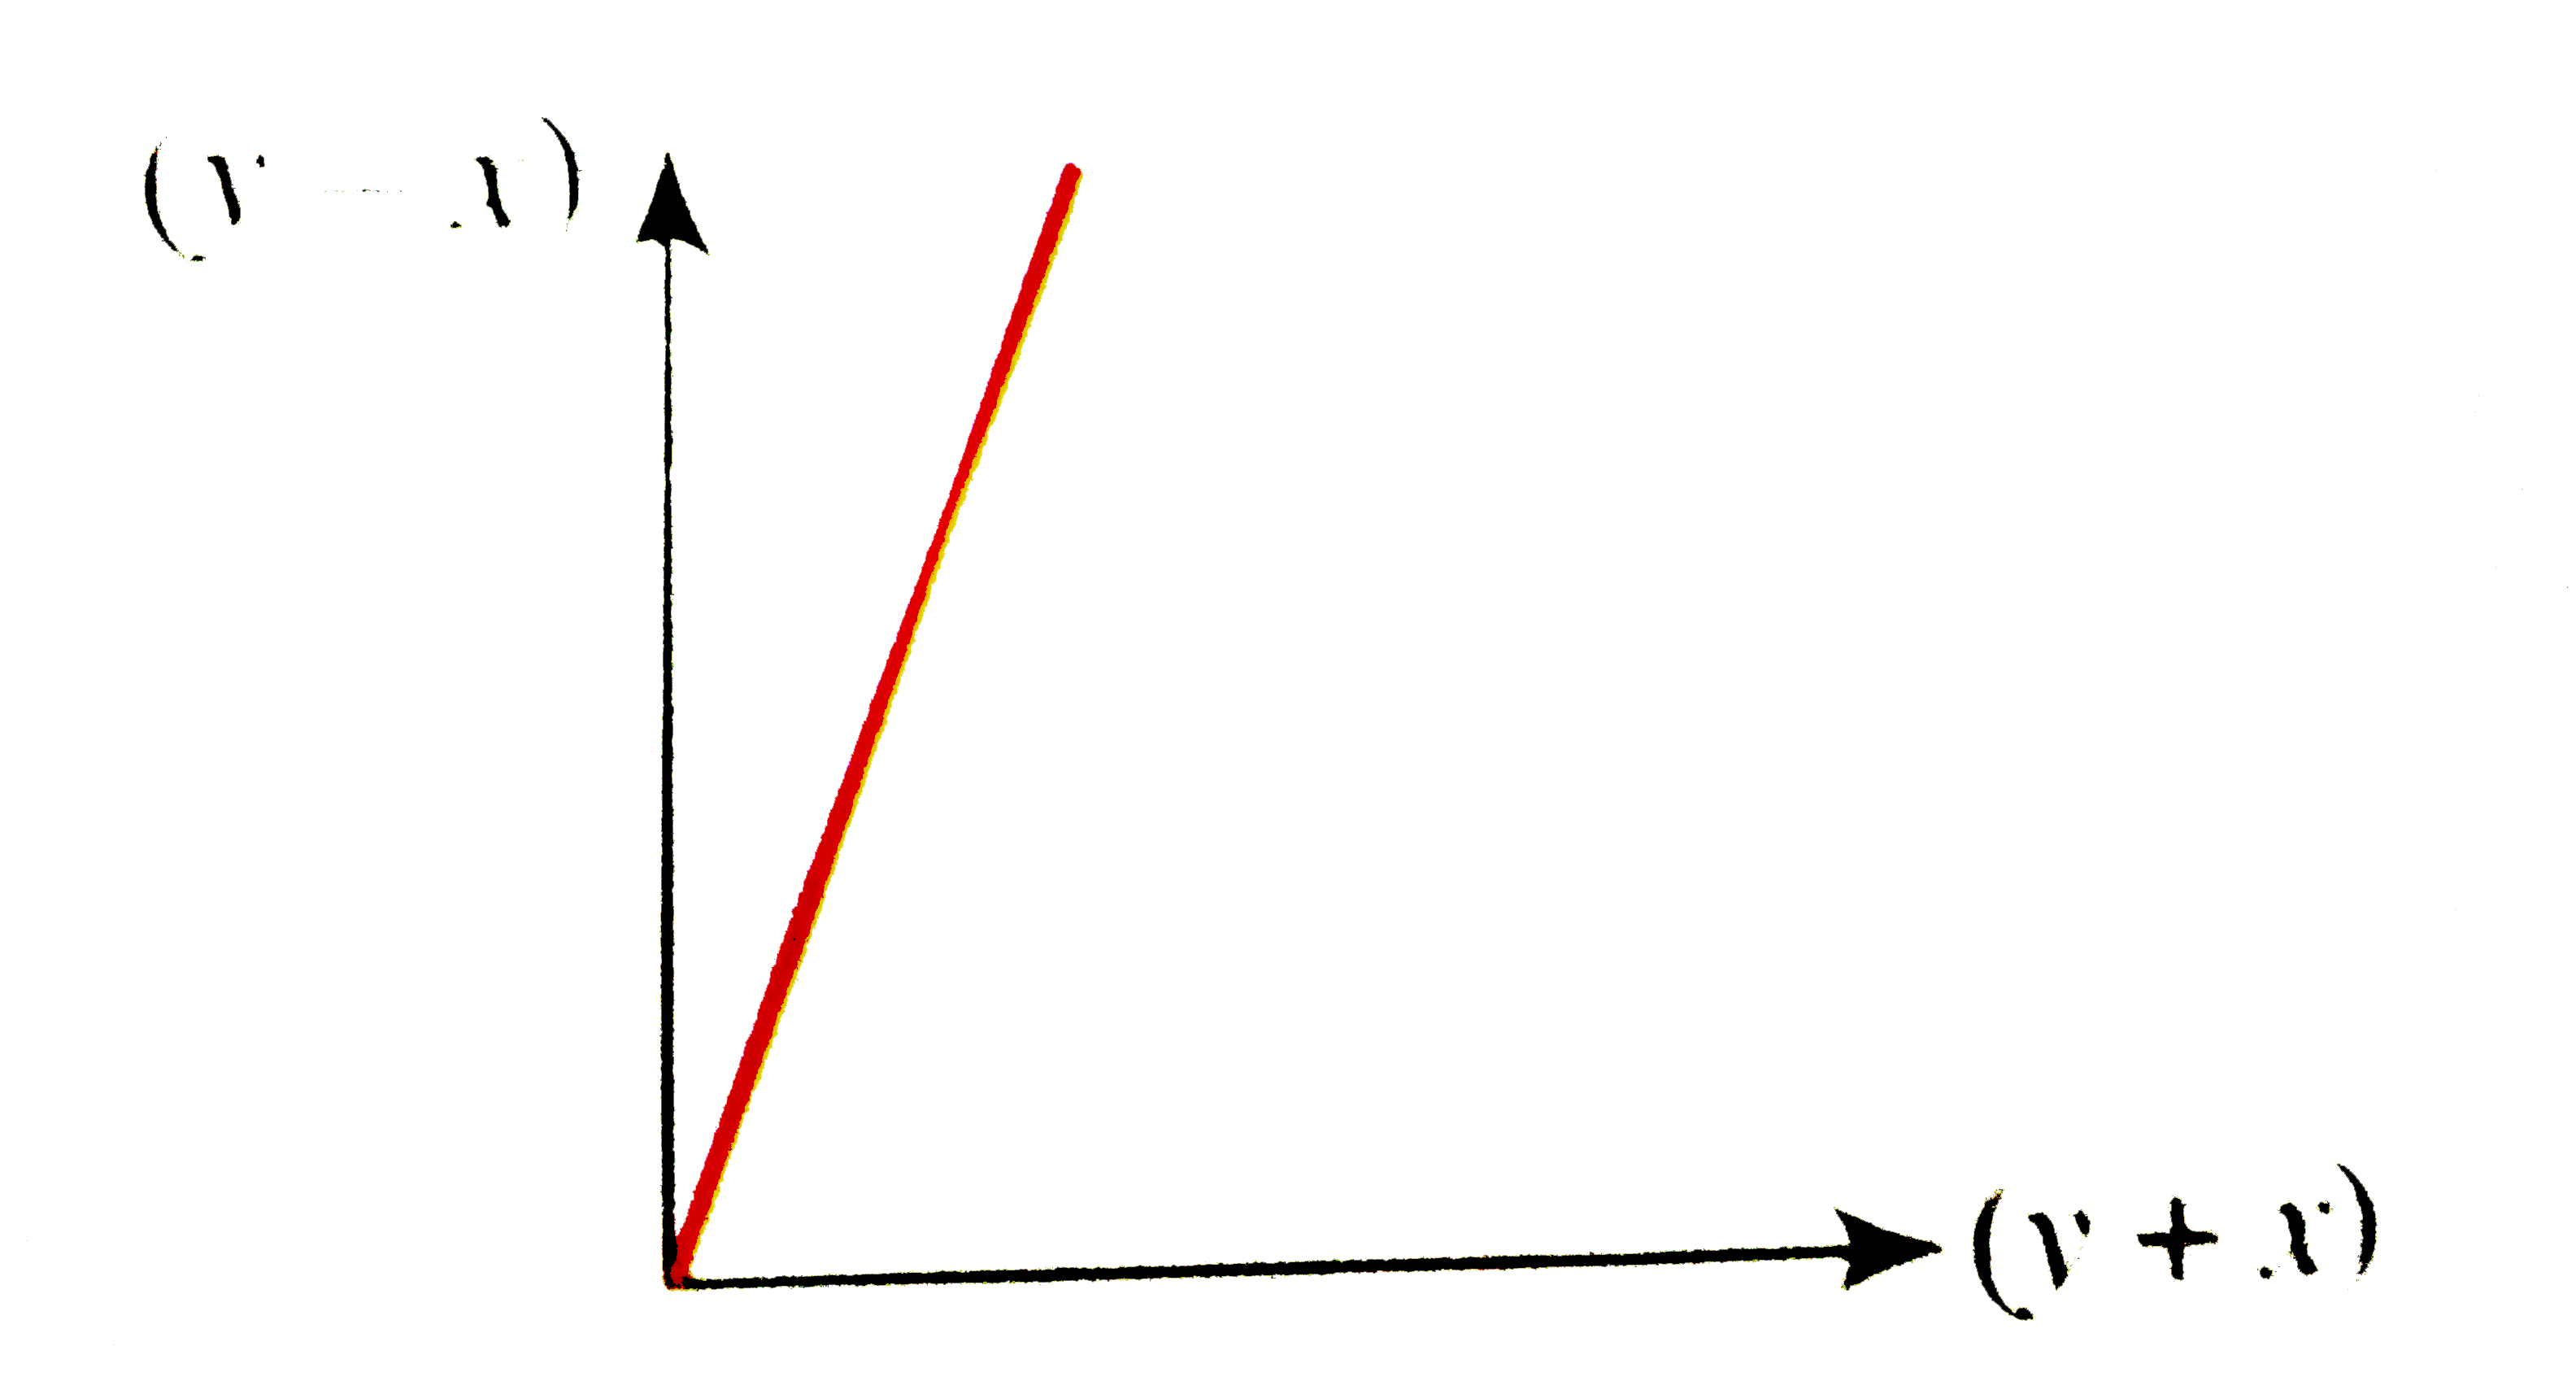
The distance-time graph for the motion of two vehicles A and B is given below. Which one of the following statements is true ?
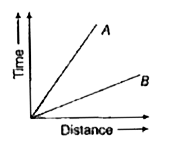 AB is moving fasterBBoth A and B are moving at the same speedCIt is not possible to find out the relative speed of A and B from the graphDA is moving faster
 - Question 2 - Select One
The distance - time graph for the motion of two vehicles . A and B is given below. Which one of the following statements is true ?
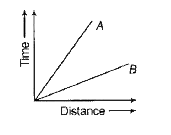 AB is moving fasterBBoth A and B are moving at the same speedCIt is not possible to find out the relative speed of A and B from the graphDA is moving faster .
 - Question 3 - Select One
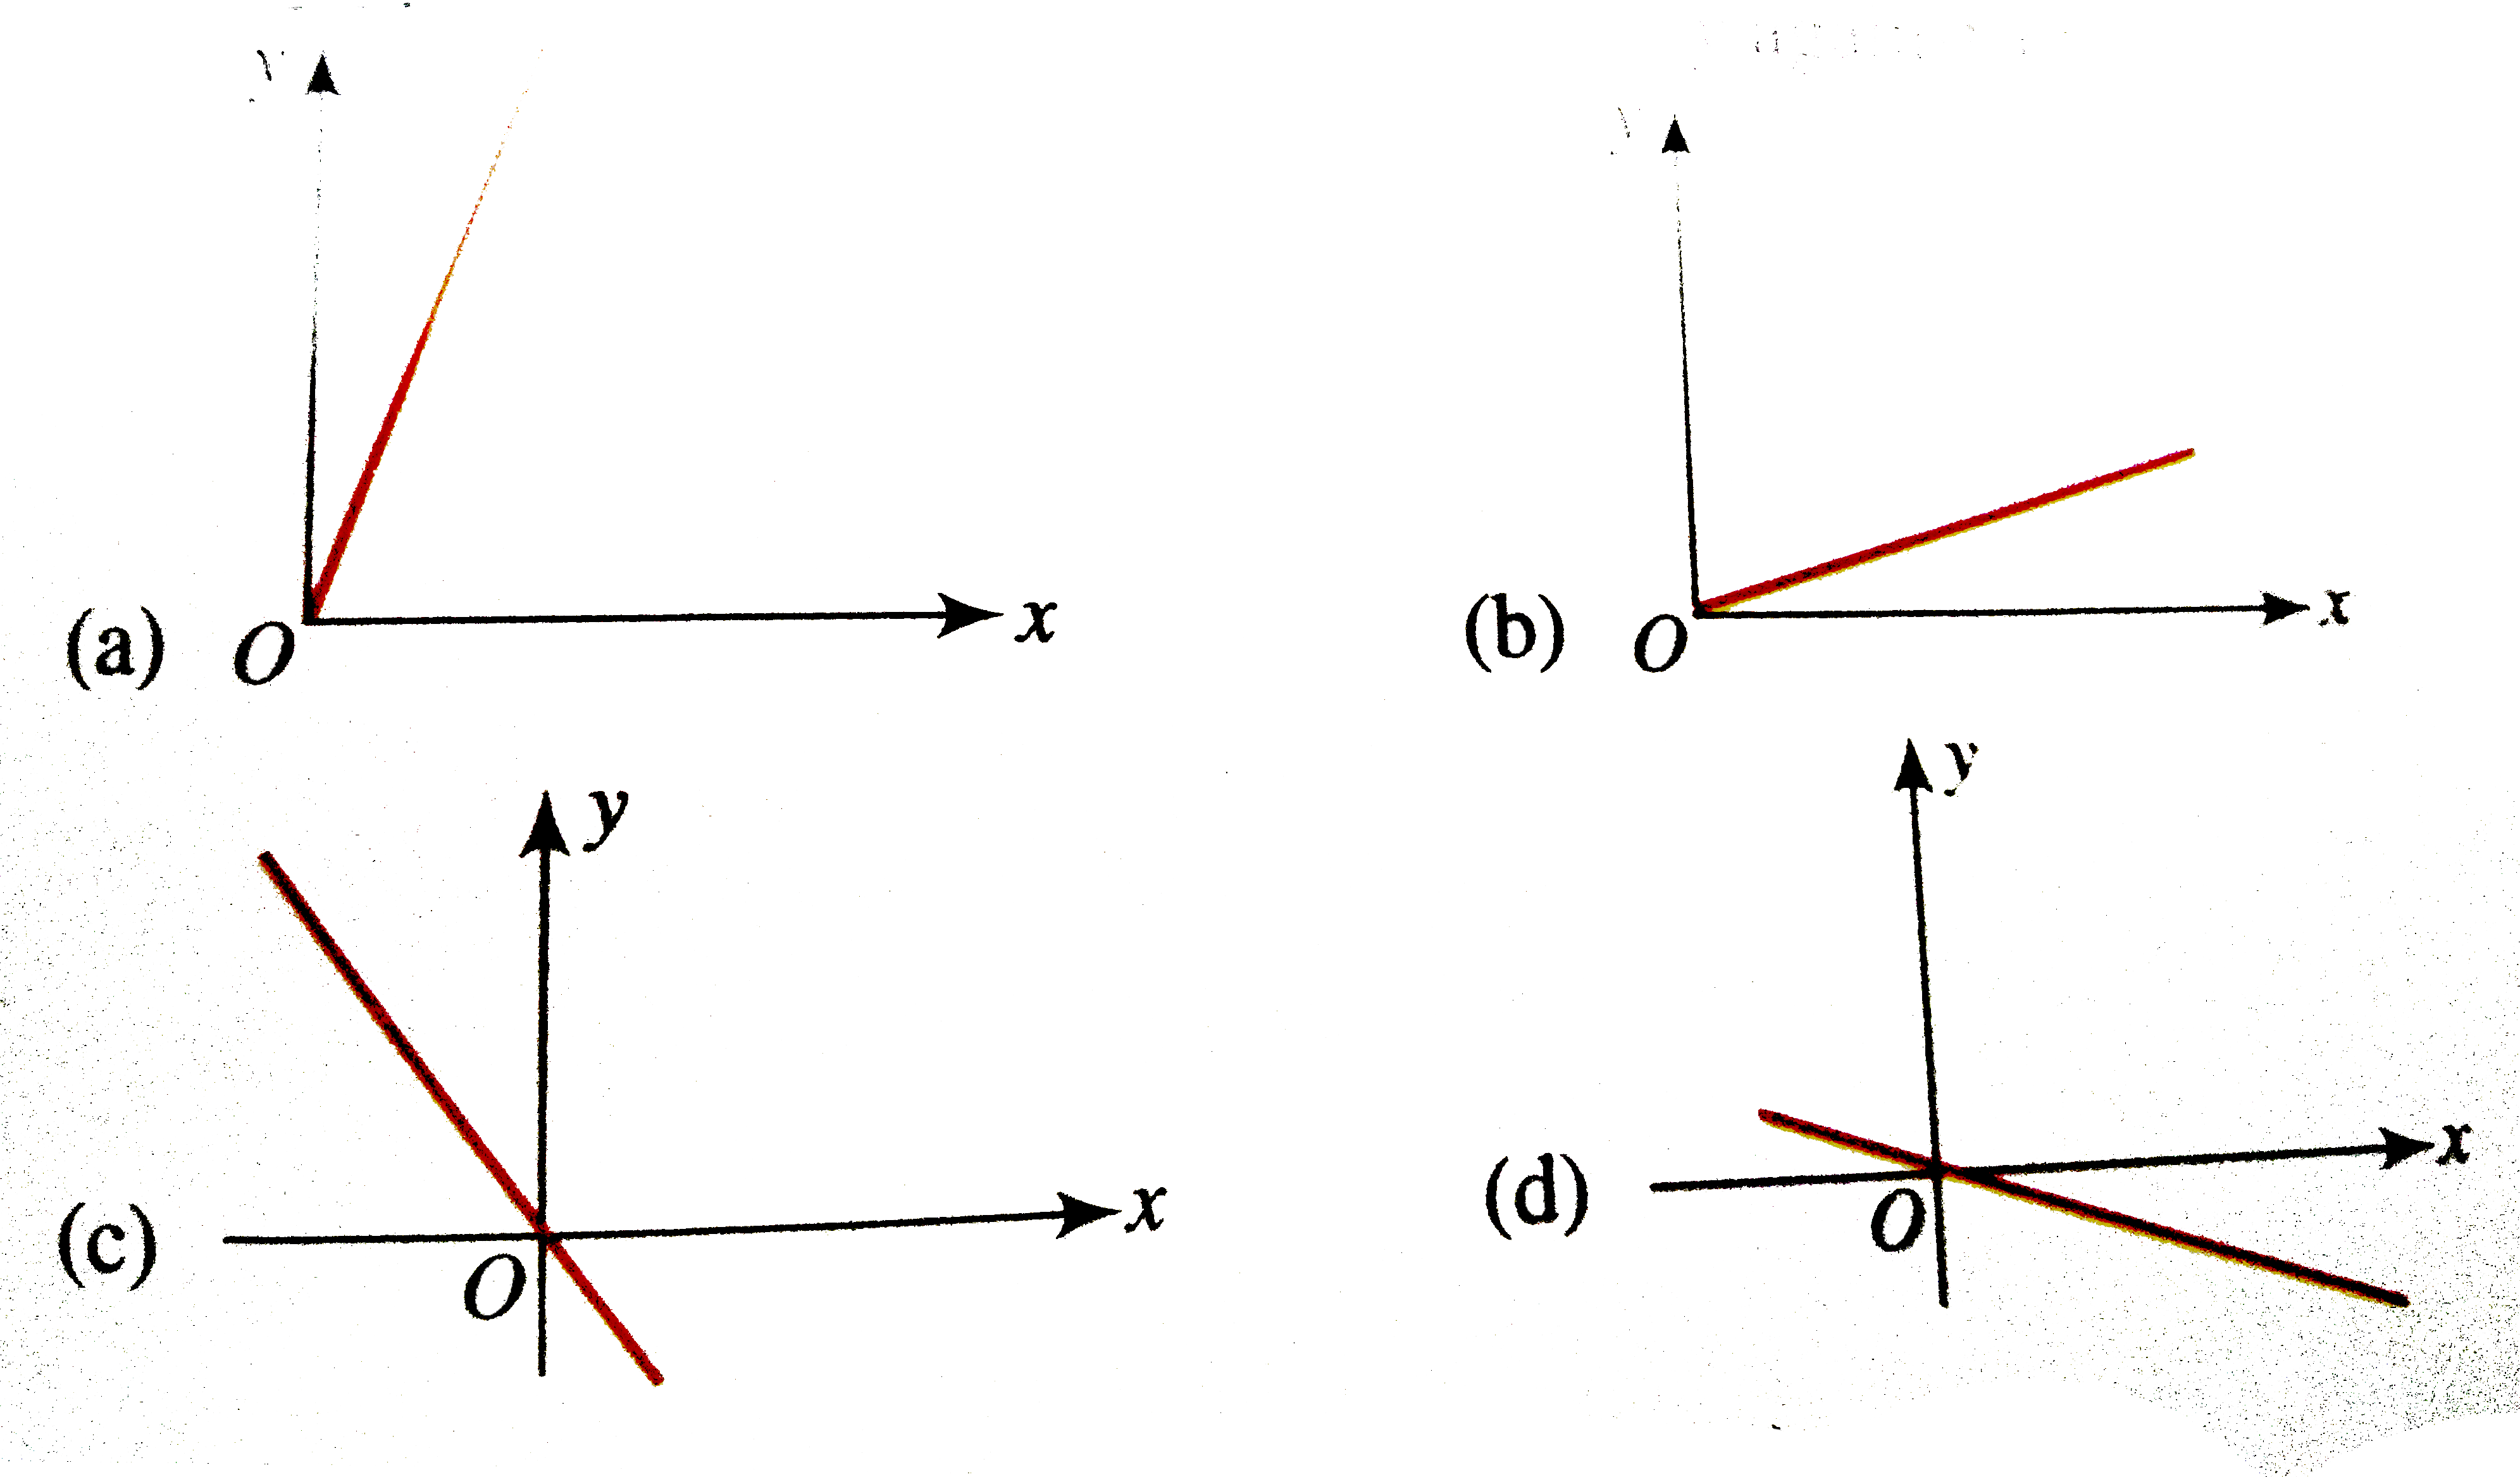
Which of the following graphs given below show (s) adiabatic process?
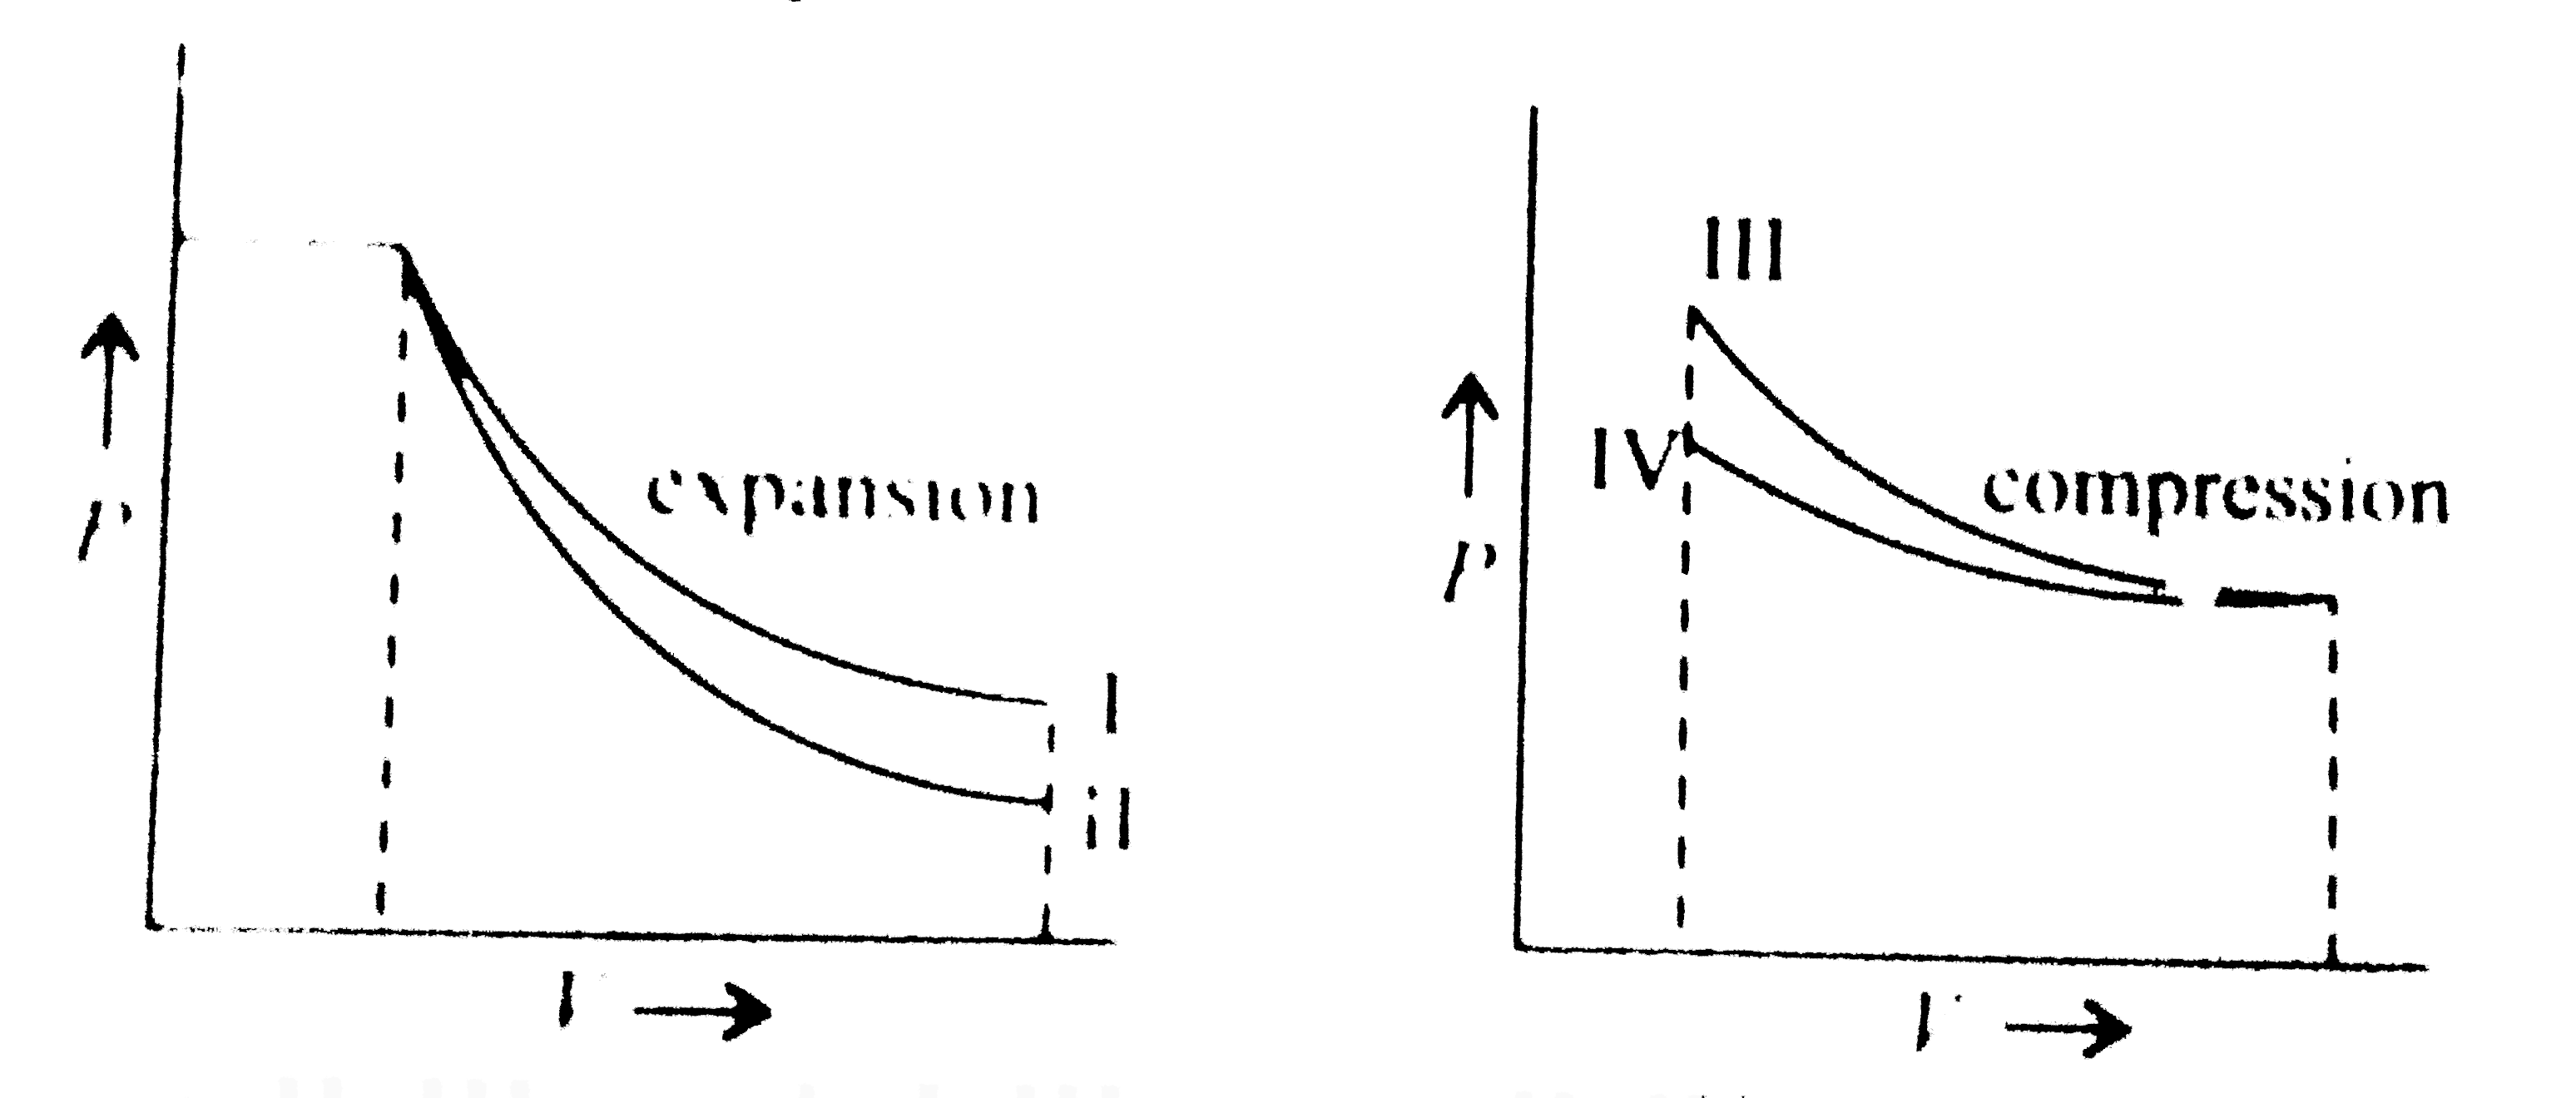 AII,IIIBI,IIICII,IVDI,IV
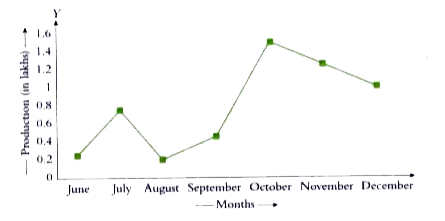
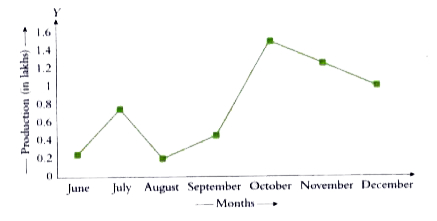
The line graph given below shows the production of a particular model of bike produced in different months. Read the line graph and answer the following questions:
In which month is the production maximum?
 View Solution
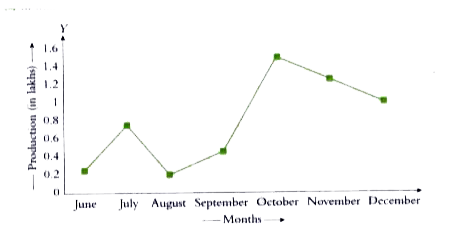
The line graph given below shows the production of a particular model of bike produced in different months. Read the line graph and answer the following questions:
In which month is the production least?
 View Solution
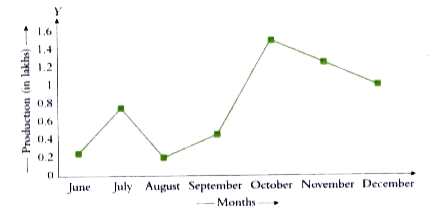
The line graph given below shows the production of a particular model of bike produced in different months. Read the line graph and answer the following questions:
In which two successive months has the production increased?
 View Solution
The line graph given below shows the production of a particular model of bike produced in different months. Read the line graph and answer the following questions:
In which two successive months has the production decreased?
 View Solution
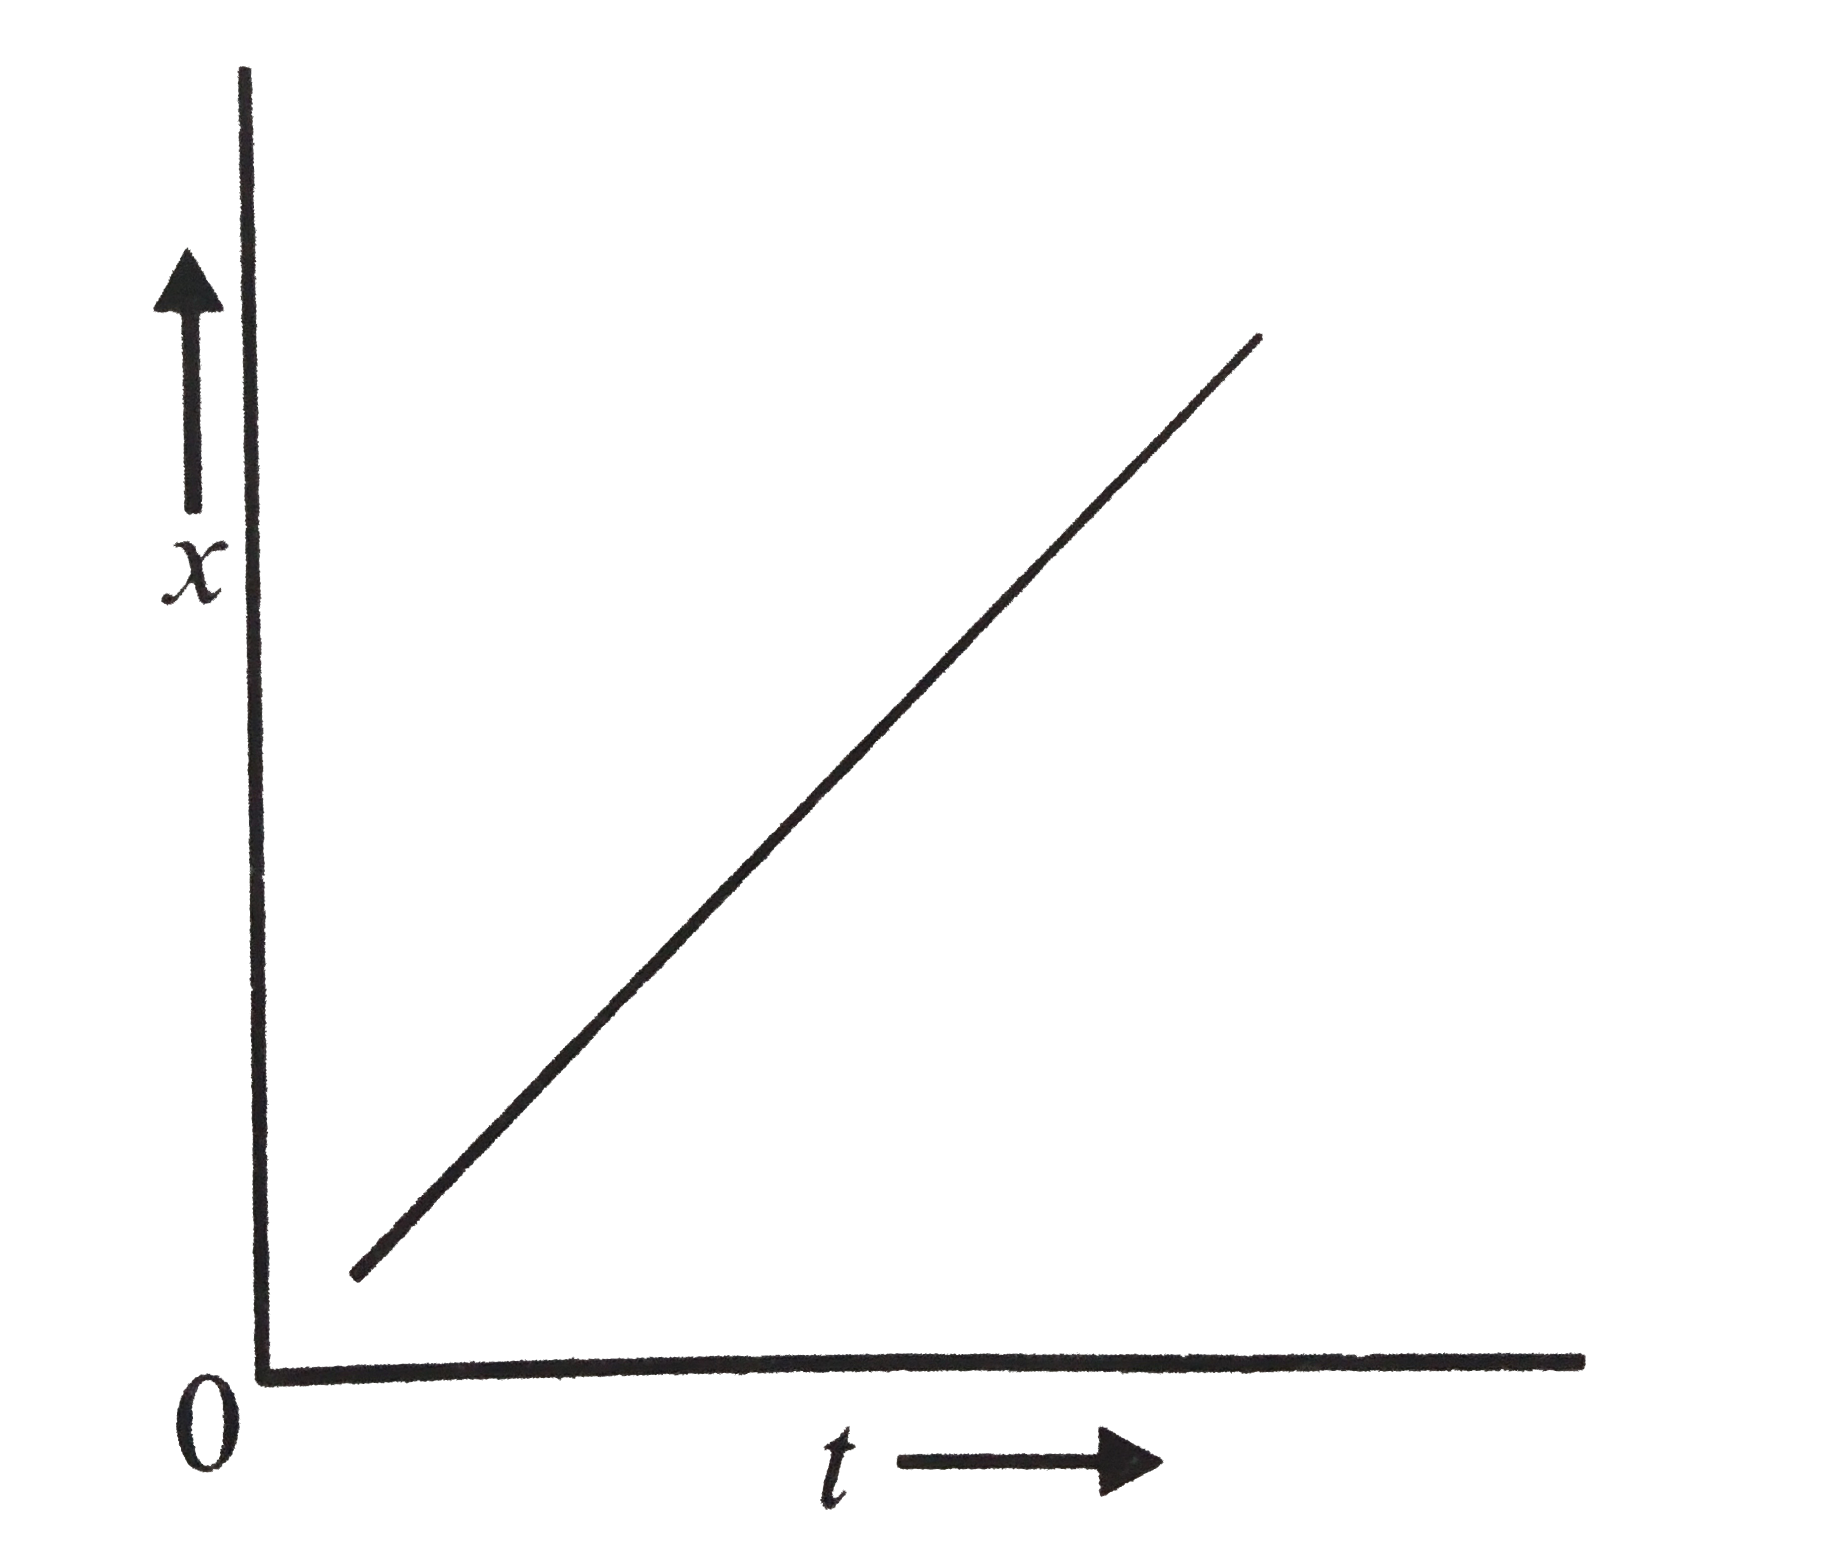
The graph given show the position of two cars A and B as a function of time. The cars move along the x axis on parallel but separate tracks, so that they can pass each other's position without colliding.
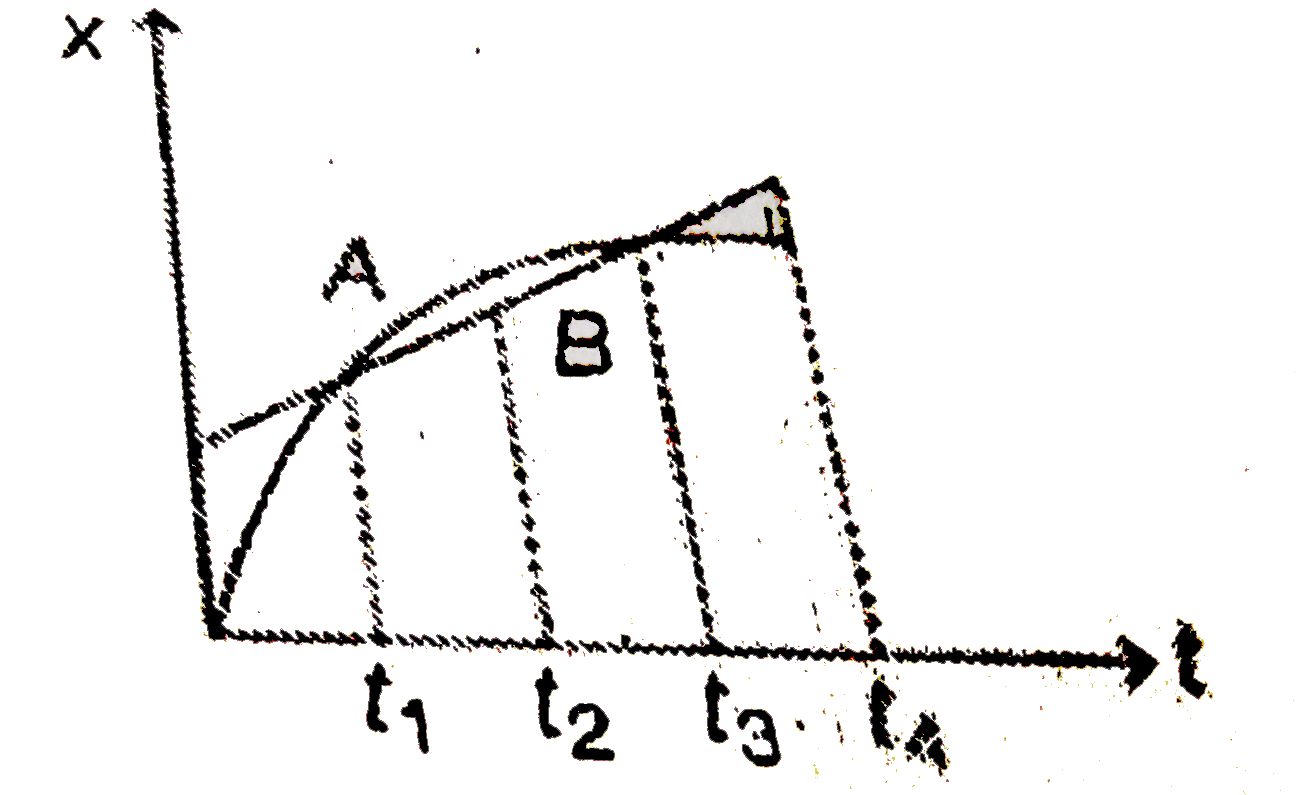
Which one of the following best describes the motion of car A as shown on the graphs?View Solution

