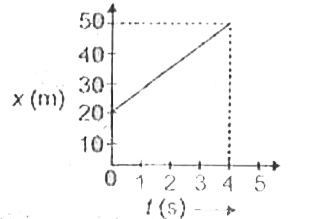
The position- time (x - t) graph for motion of a body is given below:
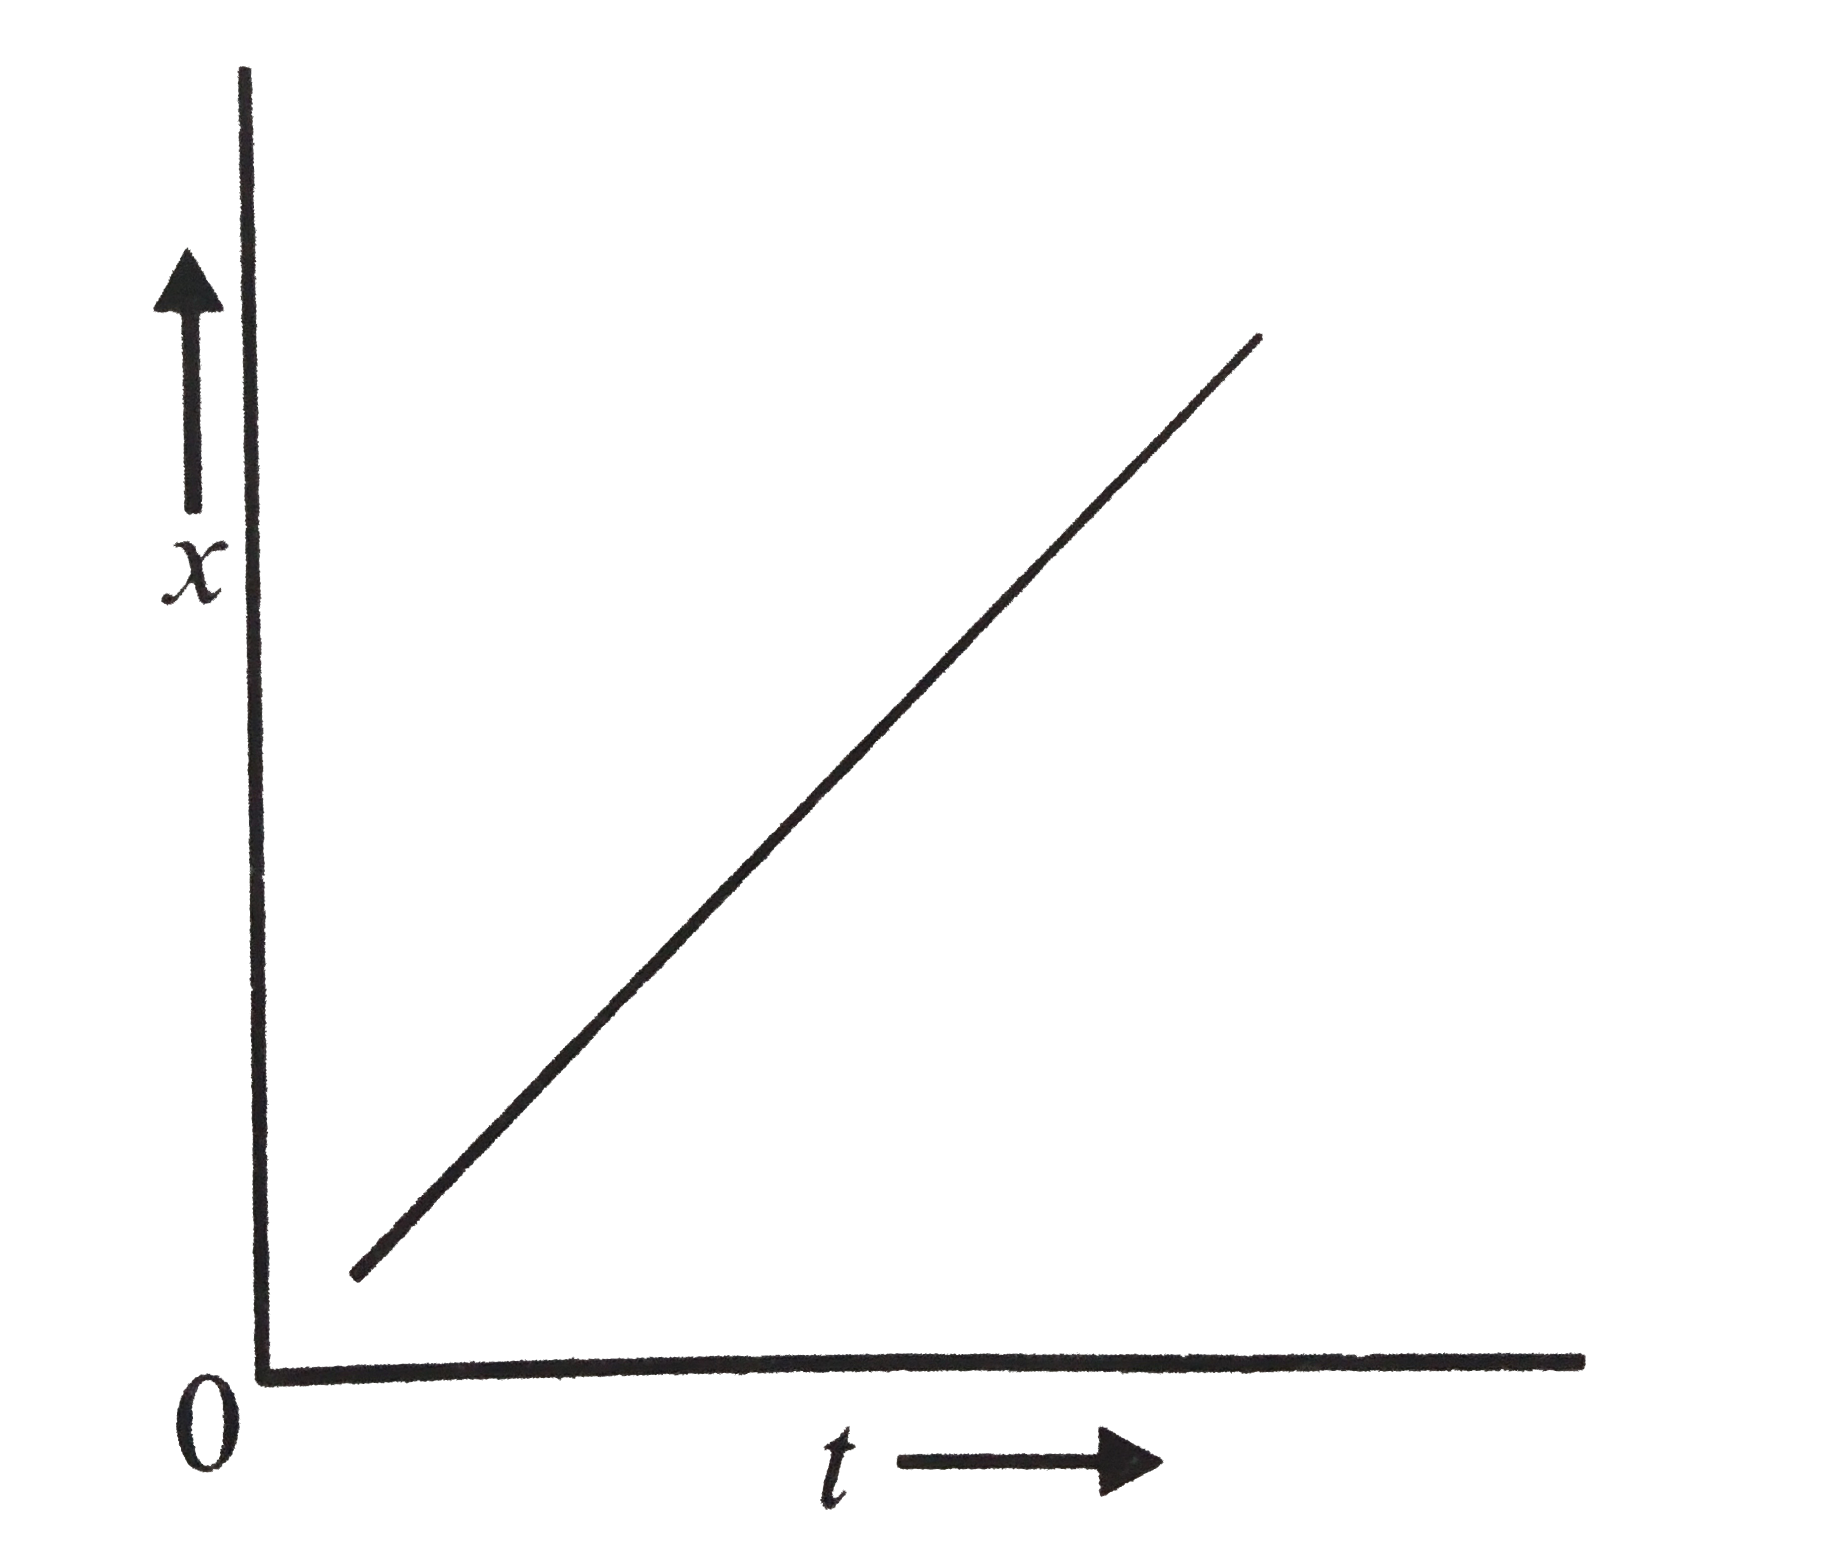
Which one among the following is depicted by the above graph?
A
Positive acceleration
B
Negative acceleration
C
Zero acceleration
D
None of the above
Video Solution
Text Solution
The correct Answer is:C
From the given (x -t) graph it is clear that velocity is constant. Therefore, acceleration is zero.
|
Topper's Solved these Questions
Similar Questions
Knowledge Check
The distance-time graph for the motion of two vehicles A and B is given below. Which one of the following statements is true ?
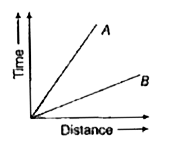 AB is moving fasterBBoth A and B are moving at the same speedCIt is not possible to find out the relative speed of A and B from the graphDA is moving faster
The distance - time graph for the motion of two vehicles . A and B is given below. Which one of the following statements is true ?
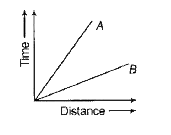 AB is moving fasterBBoth A and B are moving at the same speedCIt is not possible to find out the relative speed of A and B from the graphDA is moving faster .
Position-time graph for motion with zero acceleration is
A B
B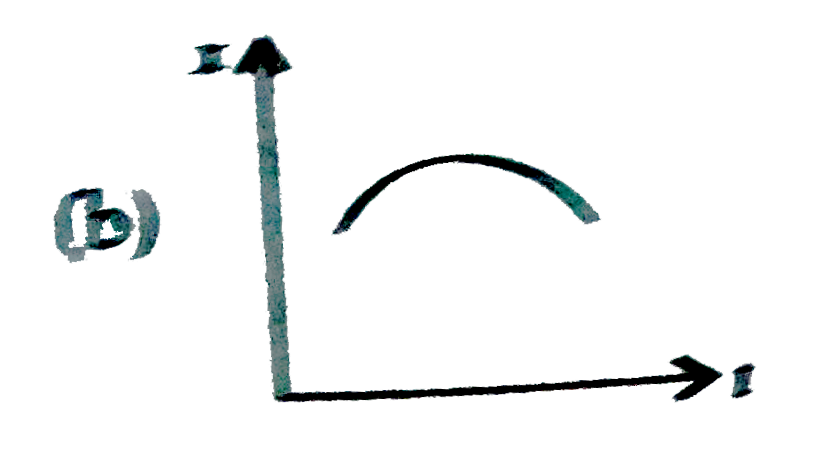 C
C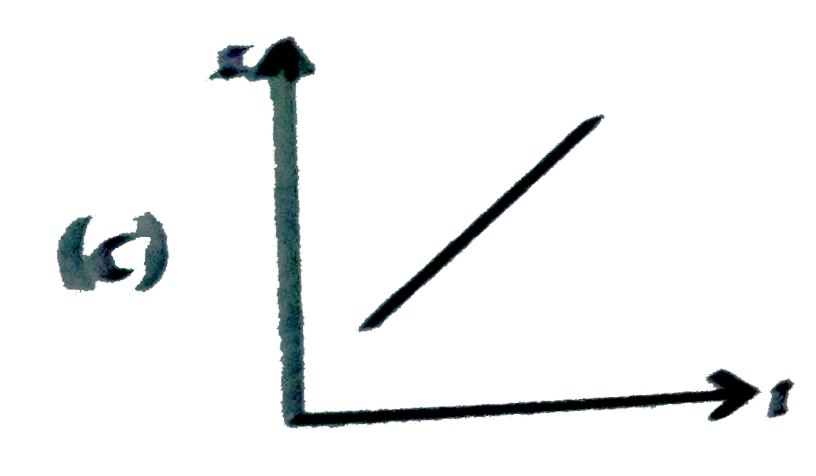 D
D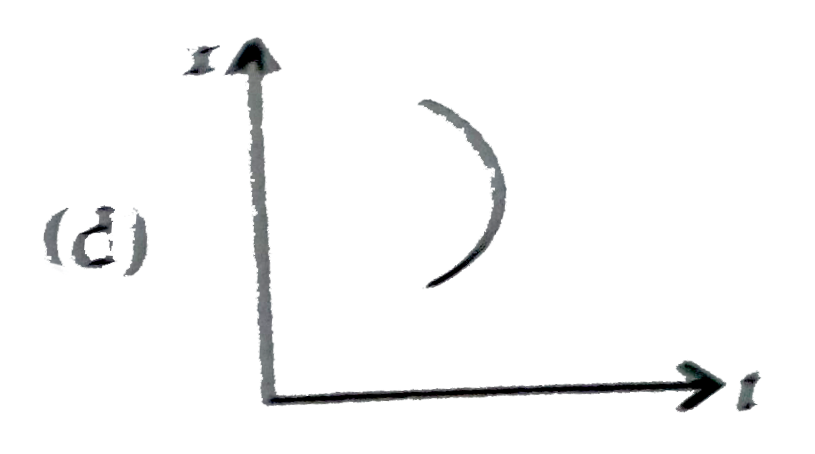
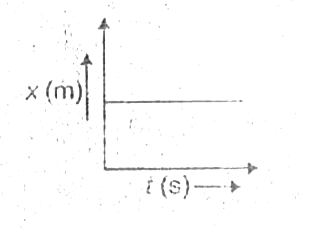
The position - time graph of an object is given below. What is the velocity of the object?
View SolutionIn the following graph. the displacements of a particle of a progressive wave at different times are shown. Refer to this graph and answer the questions given below.
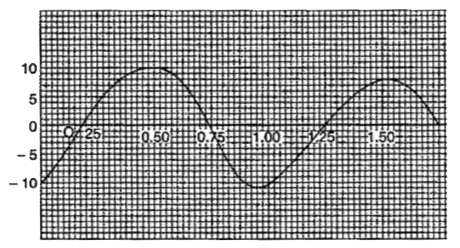
Which one ·or the following is the amplitude of the wave?
View SolutionThe position-time graph of an object is given below. What is the velocity of the object?
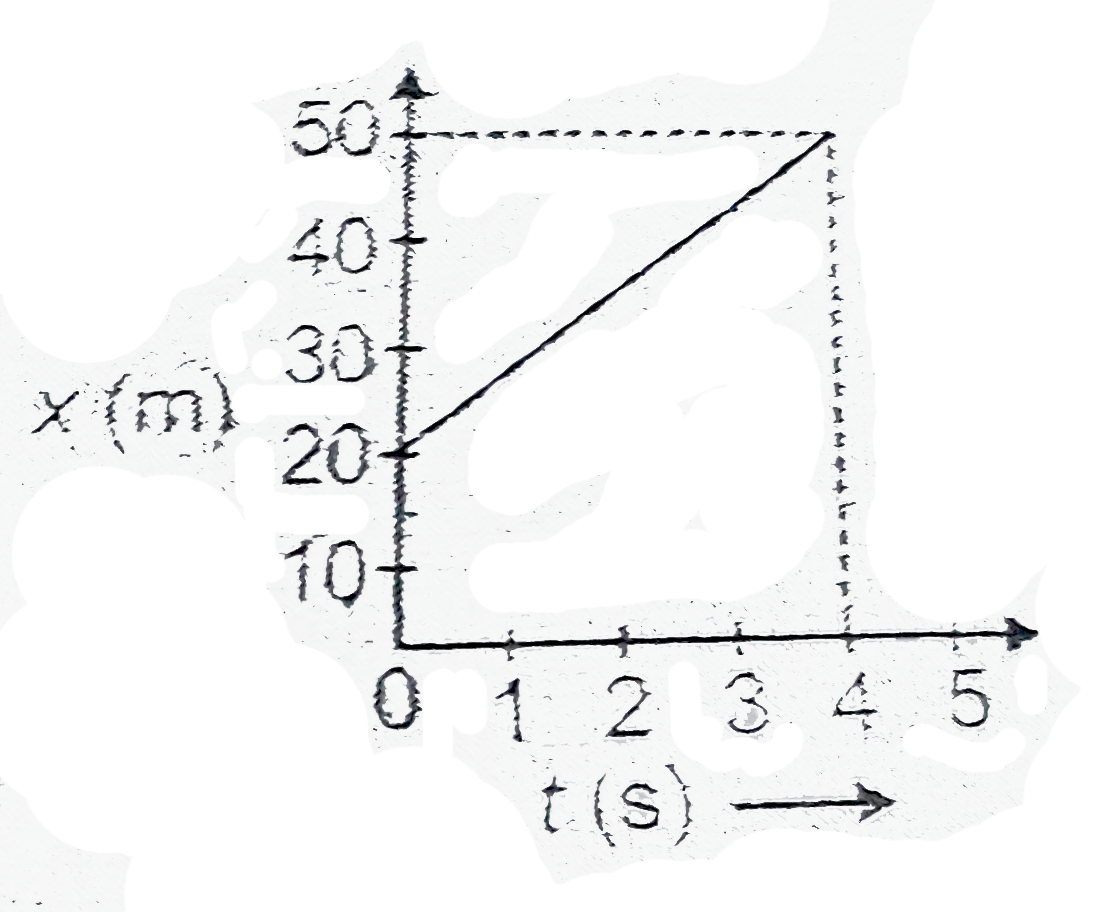
View SolutionPosition - time graph for motion with negative acceleration is
View SolutionWhich one of the following graphs represents motion?
View Solution

