The sales figure of two car dealers during January 2013 showed that dealer A sold 5 deluxe, 3 premium and 4 standard cars, while dealer B sold 7 deluxe, 2 premium and 3 standard cars. Total sales over the 2 month period of January-February revealed that dealer A sold 8 deluxe 7 premium and 6 standard cars. In the same 2 month period, dealer B sold 10 deluxe, 5 premium and 7 standard cars. Write 2×3 matrices summarizing sales data for January and 2-month period for each dealer.
According to the data, dealer A sold 5 deluxe cars, 3 premium cars and 4 standard cars in January. Also, dealer B sold 7 deluxe cars, 2 premium cars and 3 standard cars in January. The above information can be given by Deluxe Premium Standard Dealer A Dealer B $$\left[\begin{array}{ccc}5 & 3 & 4 \\ 7 & 2 & 3\end{array}\right]$$ Total sales over the period of January-February reveals that dealer A sold 8 deluxe cars, 7 premium cars and 6 standard cars, while dealer $$B$$ sold 10 deluxe cars, 5 premium cars and 7 standard cars. This information can be given by Deluxe Premium Standard Dealer A Dealer $$B\left[\begin{array}{ccc}8 & 7 & 6 \\ 10 & 5 & 7\end{array}\right]$$
Topper's Solved these Questions
Similar Questions
The given pictograph shows the sale of houses by a property dealer in different months.
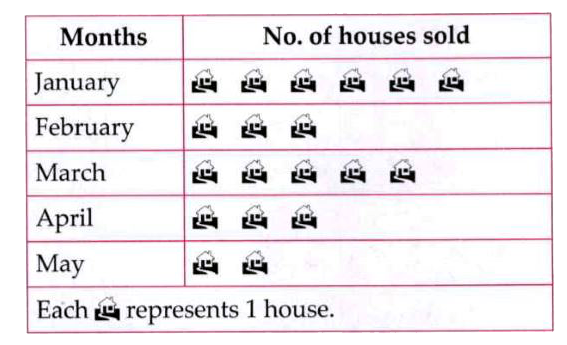
How many houses did the dealer sold in February and March altogether ?View SolutionThe data given below shows the number motorcycles of the same brand sold by two dealers in the first six months of a year
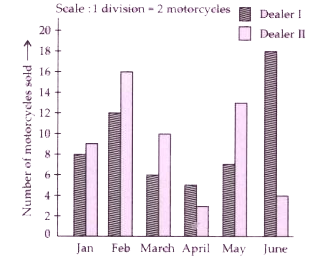
Find the total number of motorcycles sold by dealer IIView Solution
Knowledge Check
- Question 1 - Select One
A car purchased by a dealer of cars is :
Aconsumer goodBcapital goodsCintermediate goodsDall of these. - Question 2 - Select One
The given bar graph presents the sale of a particular brand of car by three showrooms, A, B and C( in multiples of 100) during the months of Jan, Feb, Mar and Apr, 2016
दिया गया दंड आरेख (बार ग्राफ) तीन शो-रूम- A, B और C के द्वारा जनवरी, फरवरी, मार्च और अप्रैल, 2016 के दौरान कार के एक खास ब्रांड की (100 के गुणक में) बिक्री को दर्शाता है|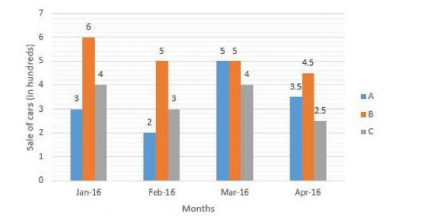 What is the ratio of the number of cars sold by A in Jan-Feb, 2016 to that of cars sold by B during Mar-Apr, 2016?
जनवरी-फरवरी, 2016 में A के द्वारा और मार्च-अप्रैल, 2016 के दौरान B के द्वारा बेची गई कारों की संख्या का अनुपात क्या है?A5:18B8:17C12:19D10:19 - Question 3 - Select One
The given table represents the number of computers sold by four dealers A,B, C and D during the first six months of 2016. Study the table carefully and answer the questions that follows:
दी गयी तालिका चार विक्रेताओं A, B, C और D के द्वारा 2016 के पहले छः महीनों में बेचे गए कंप्यूटरों की संख्या दर्शाती है | इस तालिका का ध्यानपूर्वक अध्ययन करें तथा पूछे गए प्रश्नों का उत्तर दें |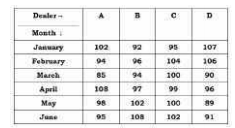 What is the ratio of the total number of computers sold by dealer A in February, April and May to the total number of computers sold by dealer D in March, May and June? /
विक्रेता A के द्वारा फरवरी, अप्रैल और मई में बेचे गए कंप्यूटरों की कुल संख्या तथा विक्रेता D के द्वारा मार्च, मई और जून में बेचे गए कंप्यूटरों की कुल संख्या के बीच क्या अनुपात है ?A15:13B10:9C6:5D20:27
The bar graph shows the number of cars of different brands sold by a dealer in a month, Study the diagram and answer the following question.
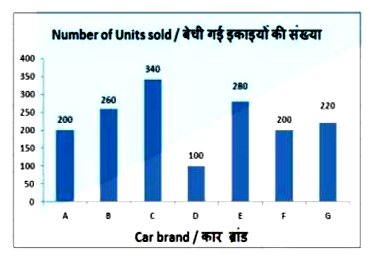
If the average price of a car sold by the dealer is Rs 5 lakhs then what is the sales (in Rs lakhs) of all the cars sold by the dealer in the month?View SolutionA dealer sold two T.V sets for Rs. 3700 each. On one he gained 10% and on the other he lost 10%. The dealer's loss or gain per cent is-
View SolutionIf the number of cars sold of model D is 40500, then how many more cars of model E are sold than that of A?
View SolutionA dealer sold two T.V. sets for Rs. 7400 each. On one he gained 10% and on the other he lost 10%. The dealer's loss or gain in the transaction is:
View SolutionIf the number of cars sold of model D is 72900, then what is the total number of cars sold of all the models together by the company?
View Solution

