The given pictograph shows the sale of houses by a property dealer in different months.
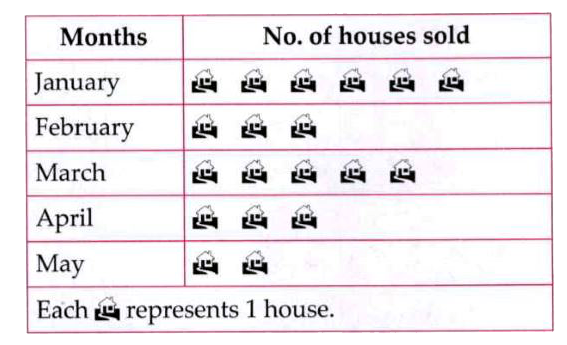
How many houses did the dealer sold in February and March altogether ?
The correct Answer is:8
Step by step video & image solution for The given pictograph shows the sale of houses by a property dealer in different months. How many houses did the dealer sold in February and March altogether ? by Maths experts to help you in doubts & scoring excellent marks in Class 6 exams.
Updated on:21/07/2023Topper's Solved these Questions
- DATA HANDLING BOOK - MTG IIT JEE FOUNDATIONCHAPTER - DATA HANDLING EXERCISE - Olympiad/HOTS Corner
10 Videos
- DATA HANDLING BOOK - MTG IIT JEE FOUNDATIONCHAPTER - DATA HANDLING EXERCISE - Exercise (Subjective Problems (Long Answer Type)
10 Videos
- BASIC GEOMETRICAL IDEASBOOK - MTG IIT JEE FOUNDATIONCHAPTER - BASIC GEOMETRICAL IDEASEXERCISE - OLYMPIAD/HOTS CORNER
10 Videos
- DECIMALSBOOK - MTG IIT JEE FOUNDATIONCHAPTER - DECIMALSEXERCISE - OLYMPIAD/HOTS CORNER
20 Videos
Similar Questions
The given bar graph shows the sale of different brands of shirts in a shop in one month.
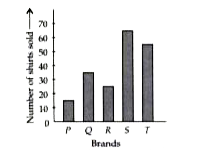
(i) How many total shirts are sold in the month ?
View SolutionThe following pictograph shows the sale of cars of different colours in a showroom.
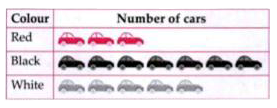

How many less blue cars were sold than red and gray cars together?
View Solution
Knowledge Check
The Bar graph given below presents the number of books sold by a bookseller during different months of a year.
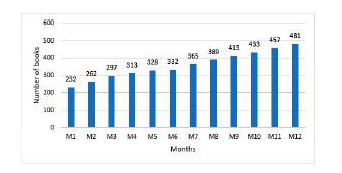
The number of books sold in month M8 is how much more than the average number of books sold per month?A34.5B22.5C30.5D26.5
The following pictograph shows the sale of cars of different colours in a showroom.
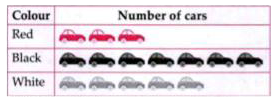

The ratio of white cars to black cars sold is
View SolutionThe given pictograph shows the books of different subjects kept in a school library ?
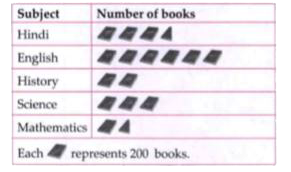
How many Mathematics books are there in the library ?
View SolutionThe given Venn diagram shows the pet(s) that each house in a society has. How many houses have only two pets?

View SolutionThe bar graph given below shows the interest of boys and girls in different activities
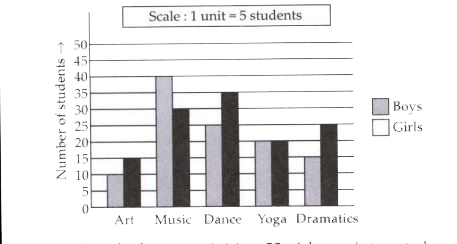
How many less boys are interested in yoga, dance and art altogether than girls
View SolutionThe given pictograph shows the books of different subjects kept in a school library ?
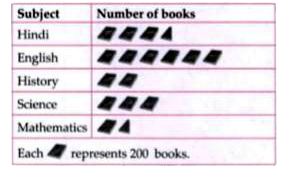
How many English book are there in the library ?
View SolutionThe given bar graph shows the sale of different brands of shirts in a shop in one month.

Find the ratio of number of shirts sold of brand S to the number of shirts sold or brand P and R together.
{ ((a),8:9),((b)13:8),((c )11:7),((d)13:6): }
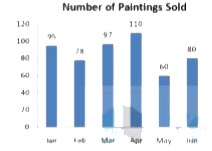
View SolutionThe bar graph shows the number of paintings sold by an art gallery in each month from January to June. How many paintings does it need to sell in July for the 7 month average to be 90?
View Solution
