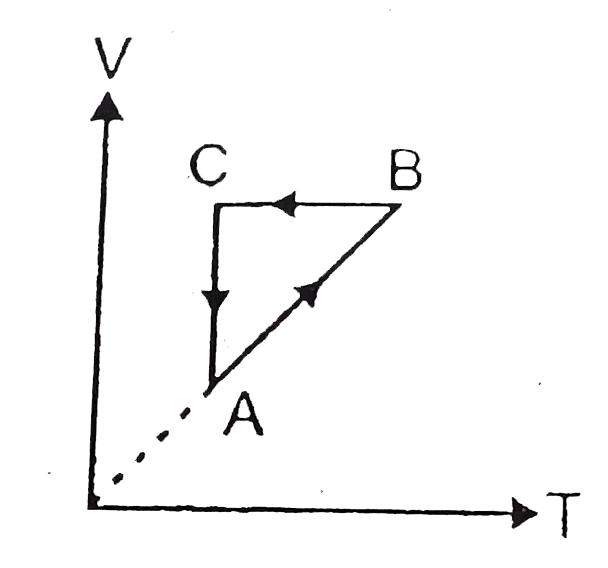
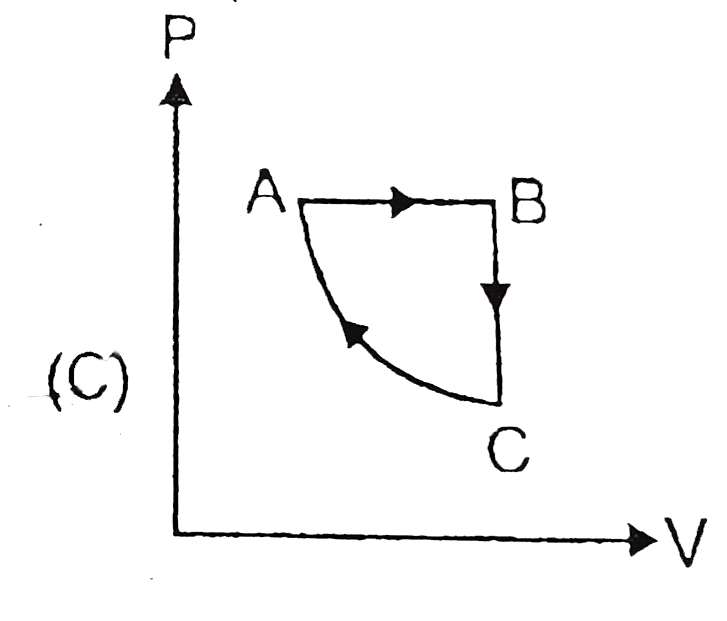
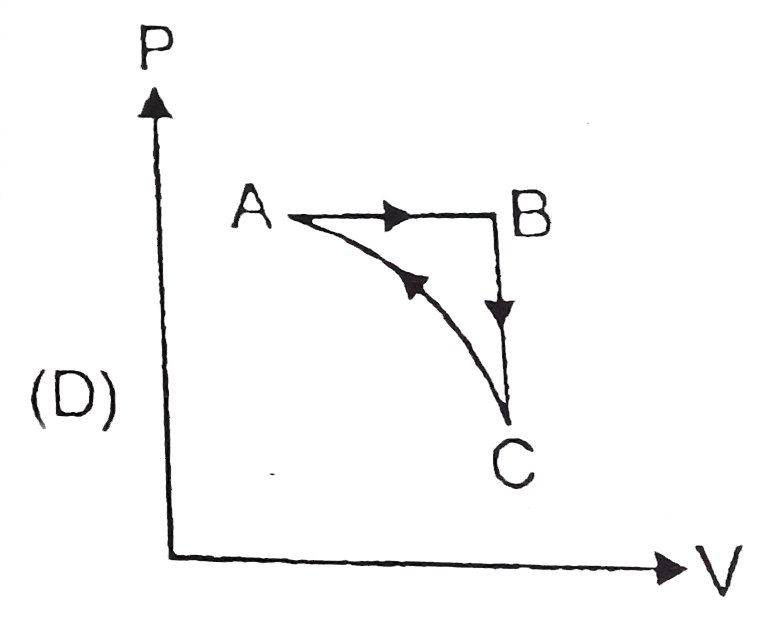
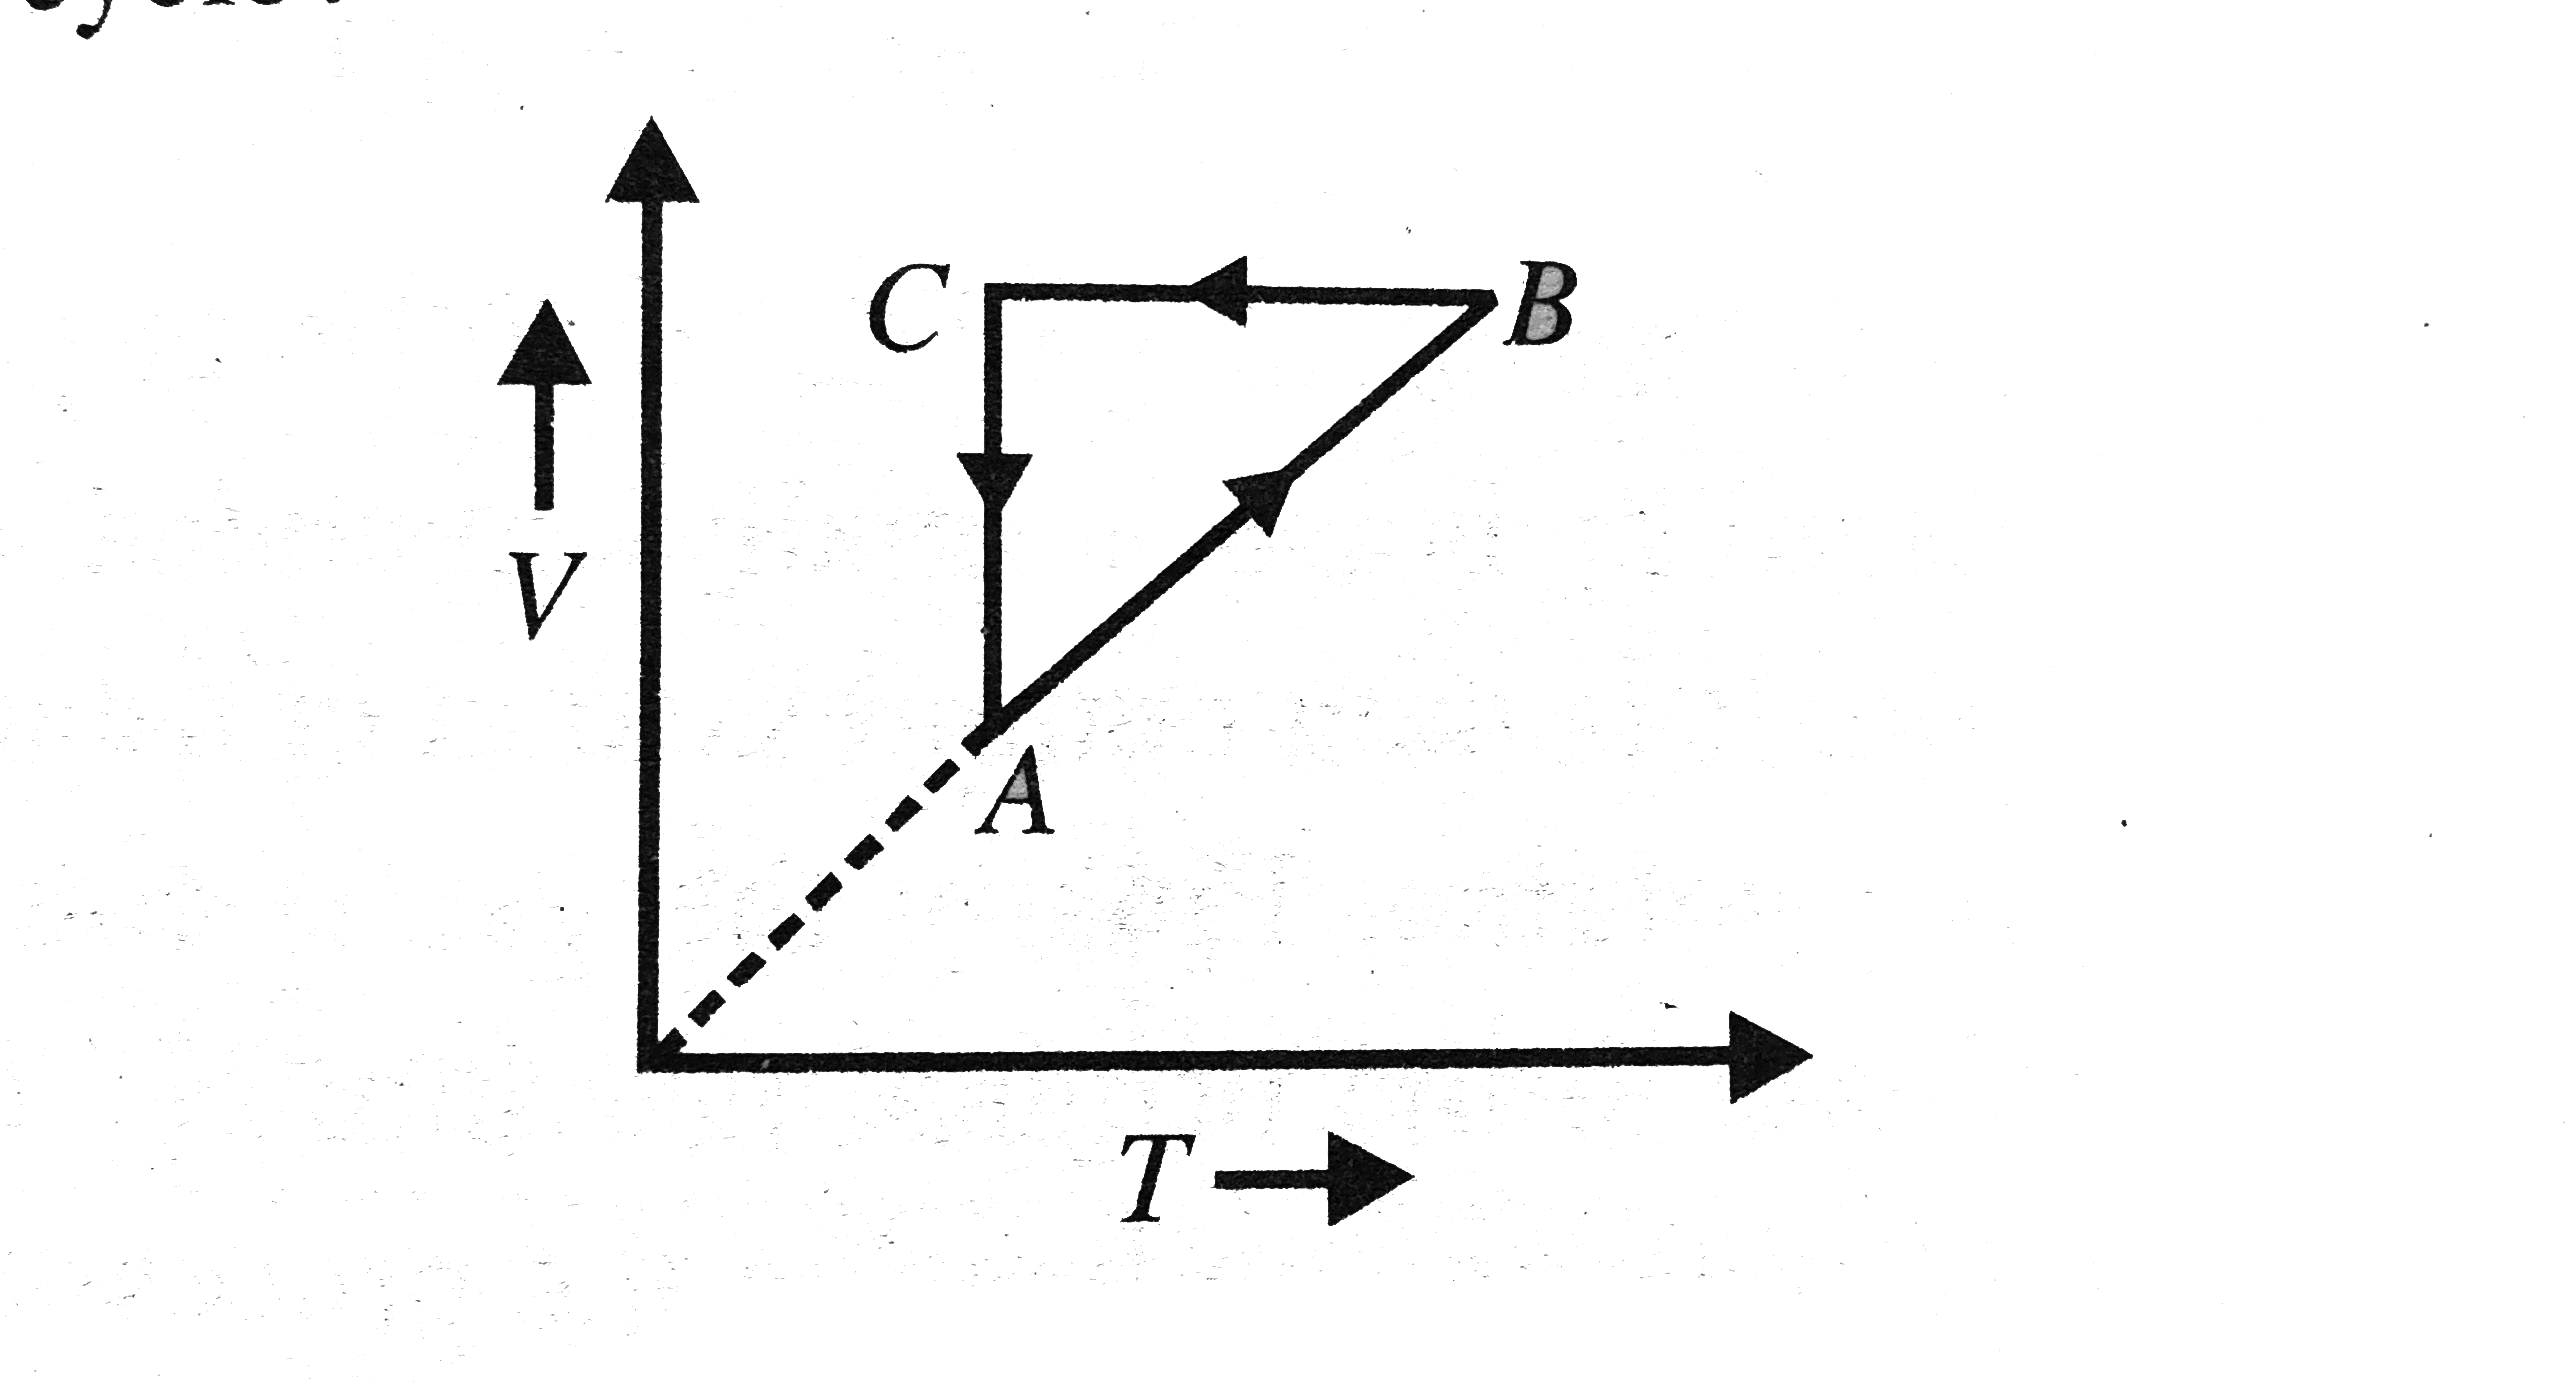
An ideal undergoes a thermodynamic cycle as shown in figure. Which of the following graphs represent the same cycle?
A
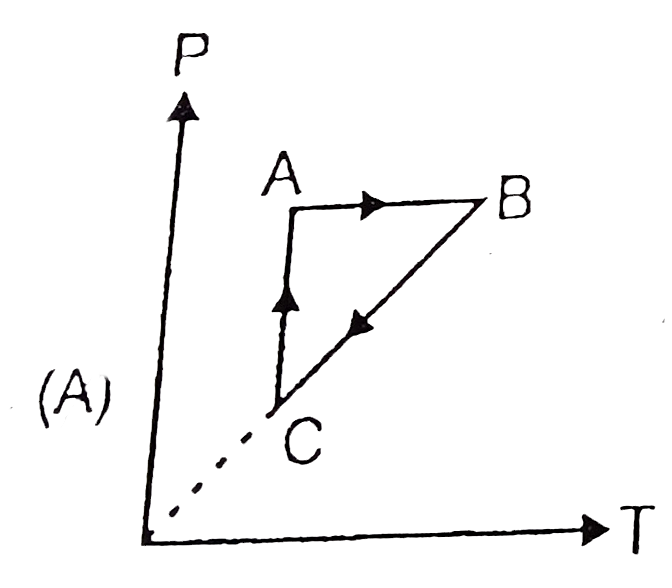
B

C
D
Video Solution
Text Solution
The correct Answer is:A, C
AB- isobaric process
BC- isochoric process
CA- isothermal process
|
Topper's Solved these Questions
- TEST PAPERSBook:RESONANCEChapter:TEST PAPERSExercise:PT-01
Explore 30 Videos
- TEST PAPERSBook:RESONANCEChapter:TEST PAPERSExercise:Pt-02
Explore 30 Videos
- TEST PAPERSBook:RESONANCEChapter:TEST PAPERSExercise:PART - II PHYSICS
Explore 107 Videos
- SIMPLE HARMONIC MOTION Book:RESONANCEChapter:SIMPLE HARMONIC MOTION Exercise:Advanced Level Problems
Explore 13 Videos
- TEST SERIESBook:RESONANCEChapter:TEST SERIESExercise:PHYSICS
Explore 127 Videos
Similar Questions
Knowledge Check
An ideal gas undergoes a thermodynamic cycle as shown in Fig. Which of the following statement are correct ?
 A
A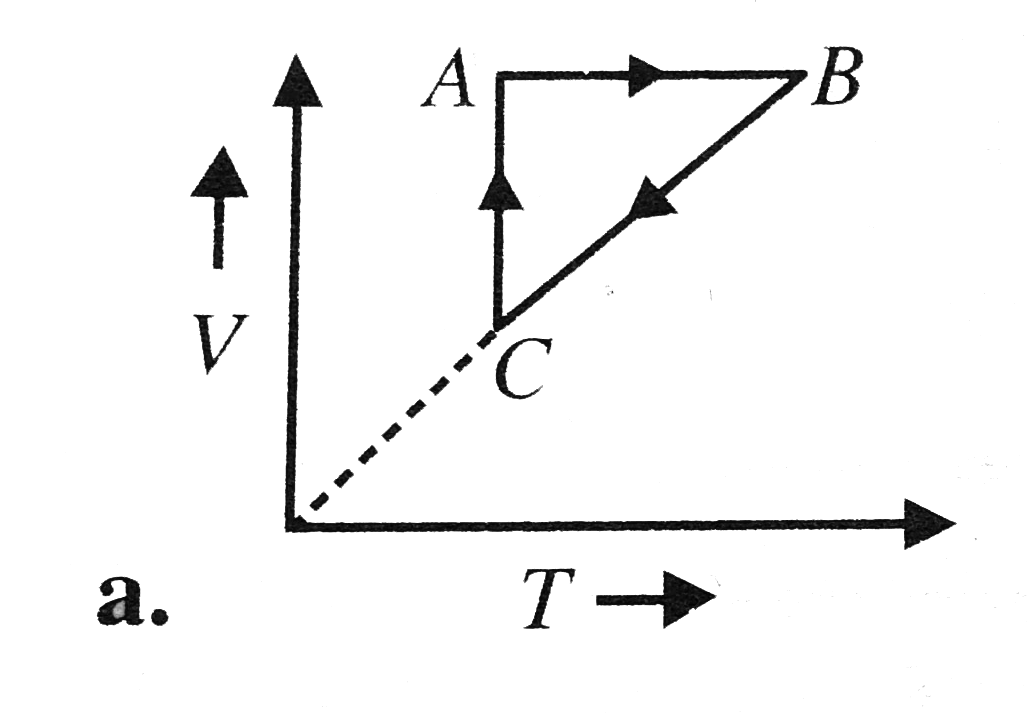 B
B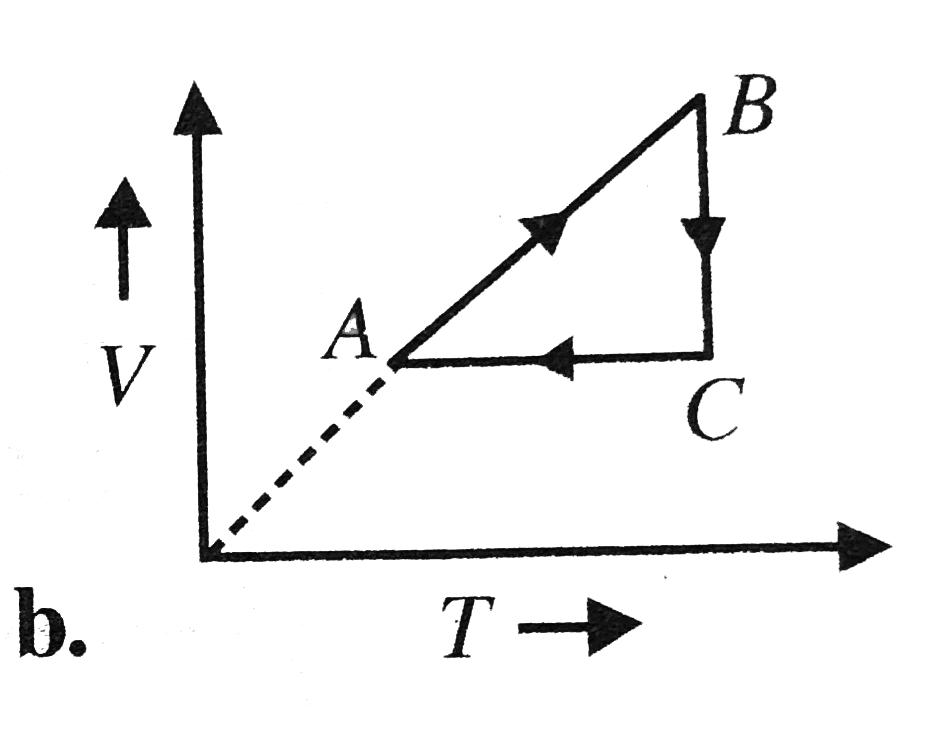 C
C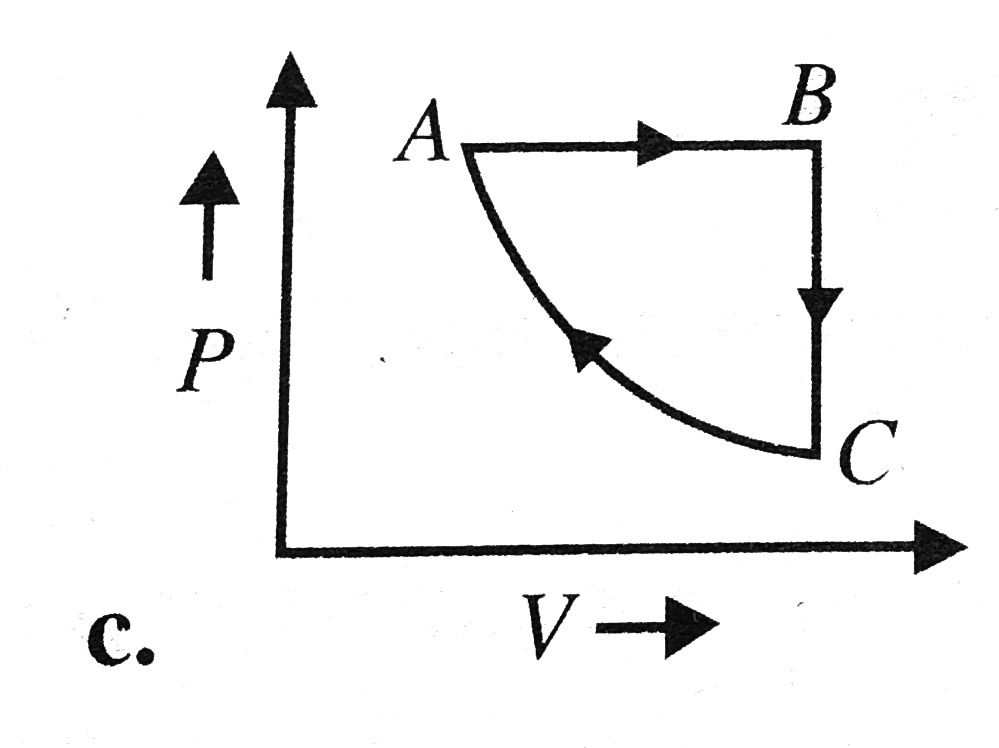 D
D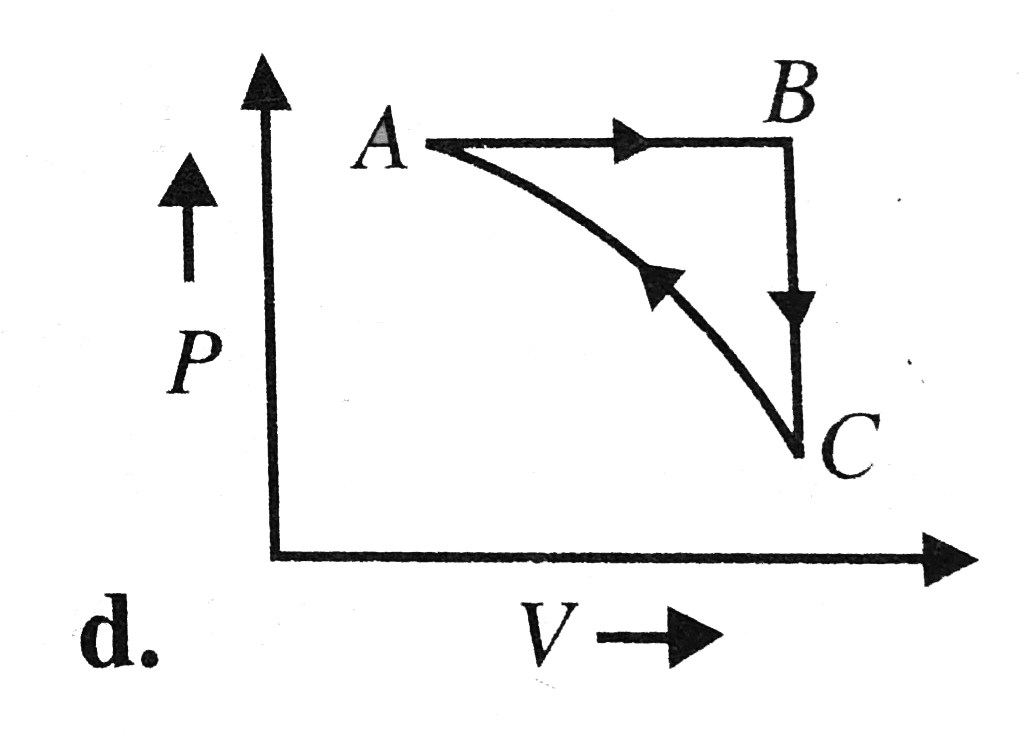
An ideal gas undergoes a thermodynamic cycle as shown in Fig. Which of the following statement are correct ?
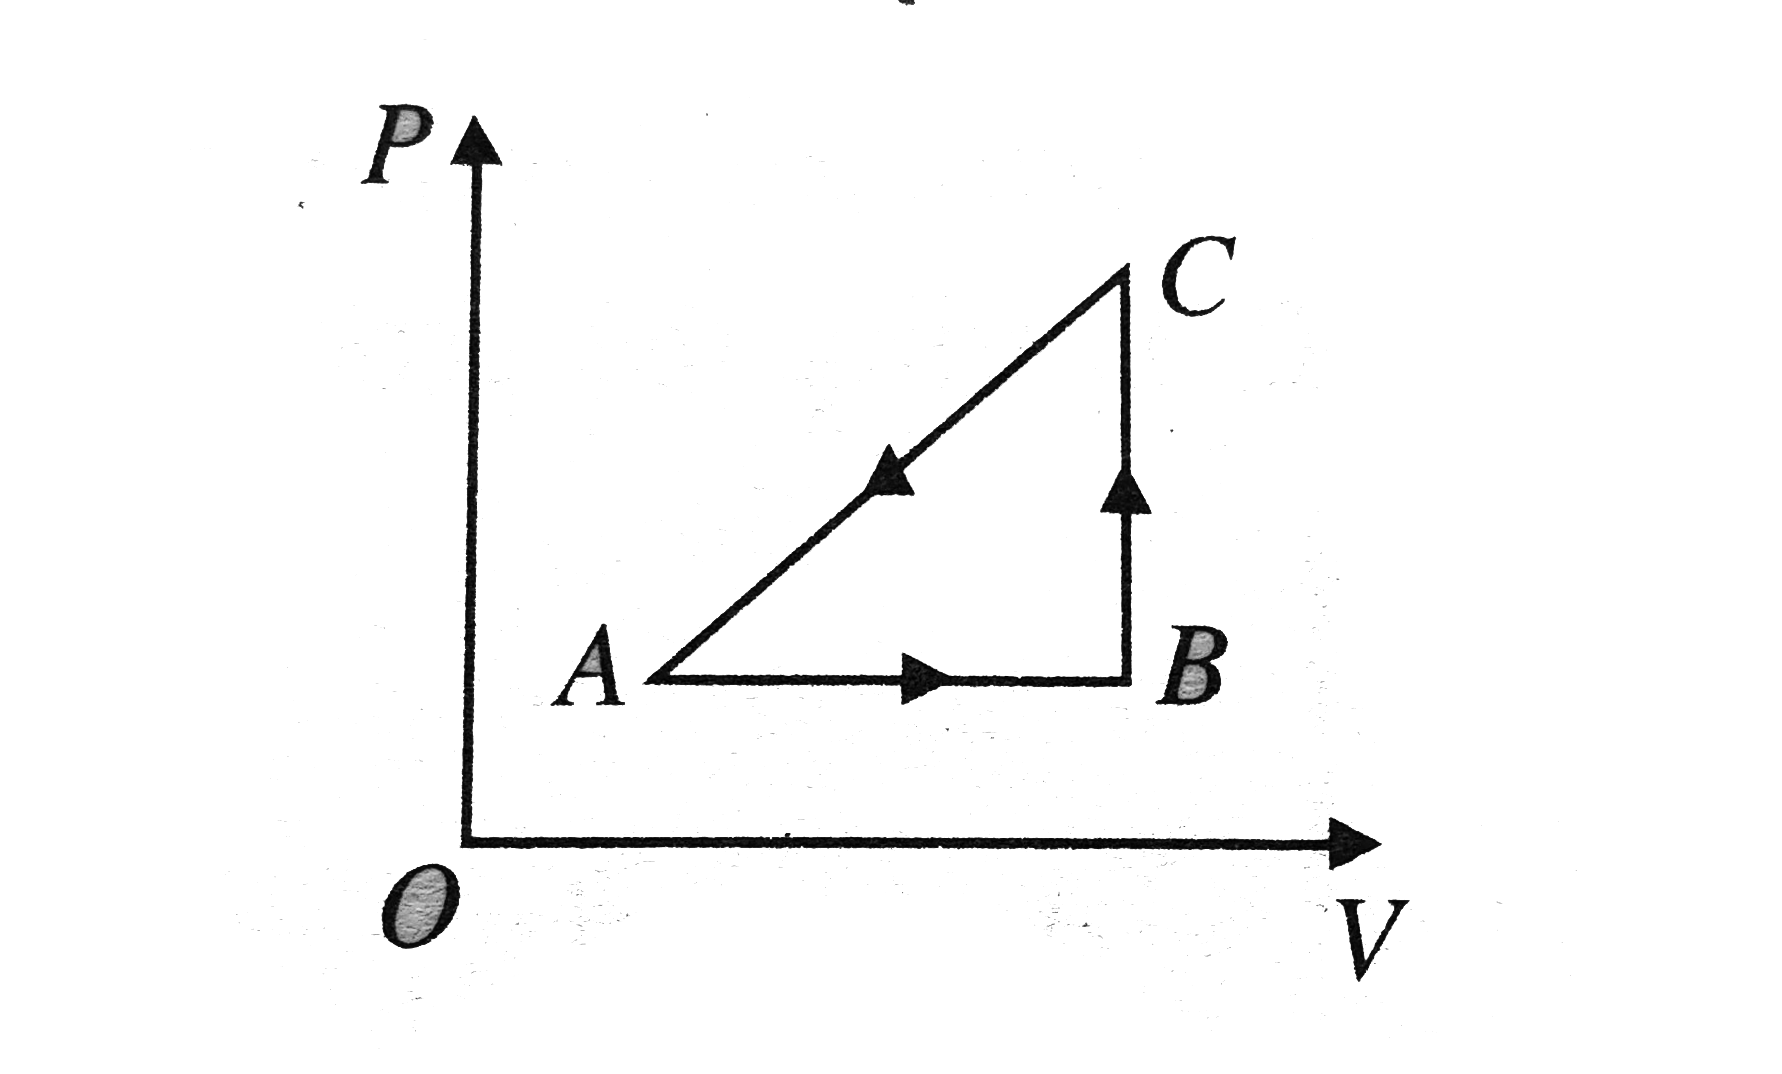 AStraight line AB cannot pass through O.BDuring process AB, temperature decreases while during process BC it increases.CDuring process BC, work is done by the gas against external pressure and temperature of the gas increases.DDuring process CA, work is done by the gas against external pressure and heat supplied to the gas is exactly equal to this work.
Which of the following graphs represent the behaviour of an ideal gas ?
A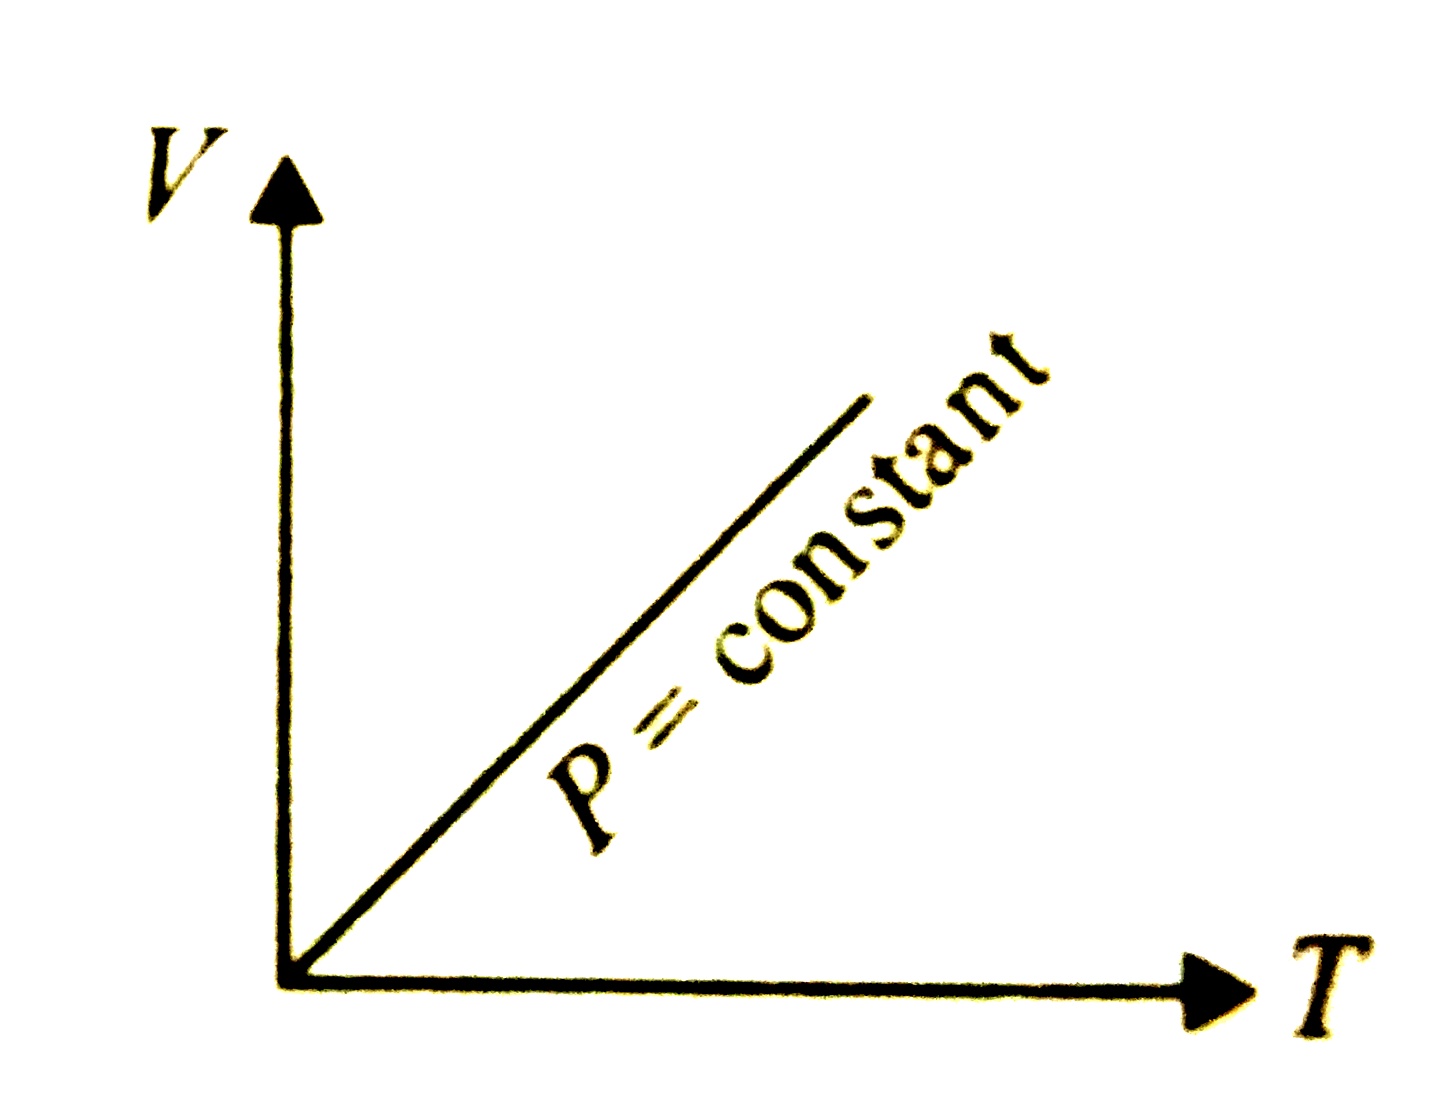 B
B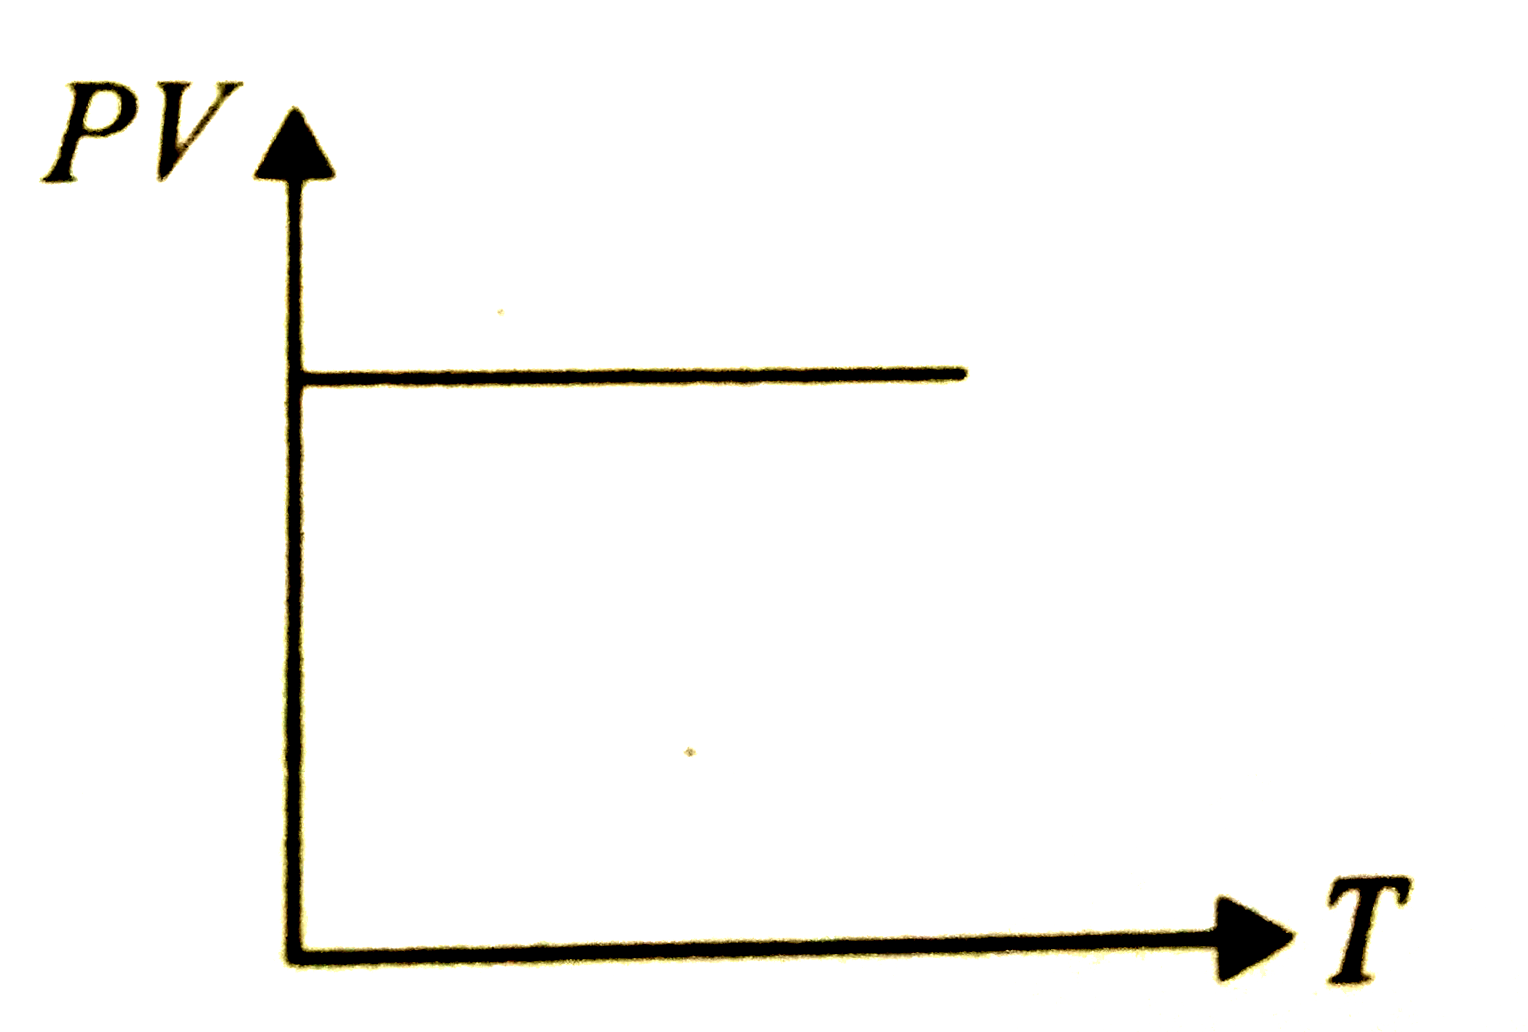 C
C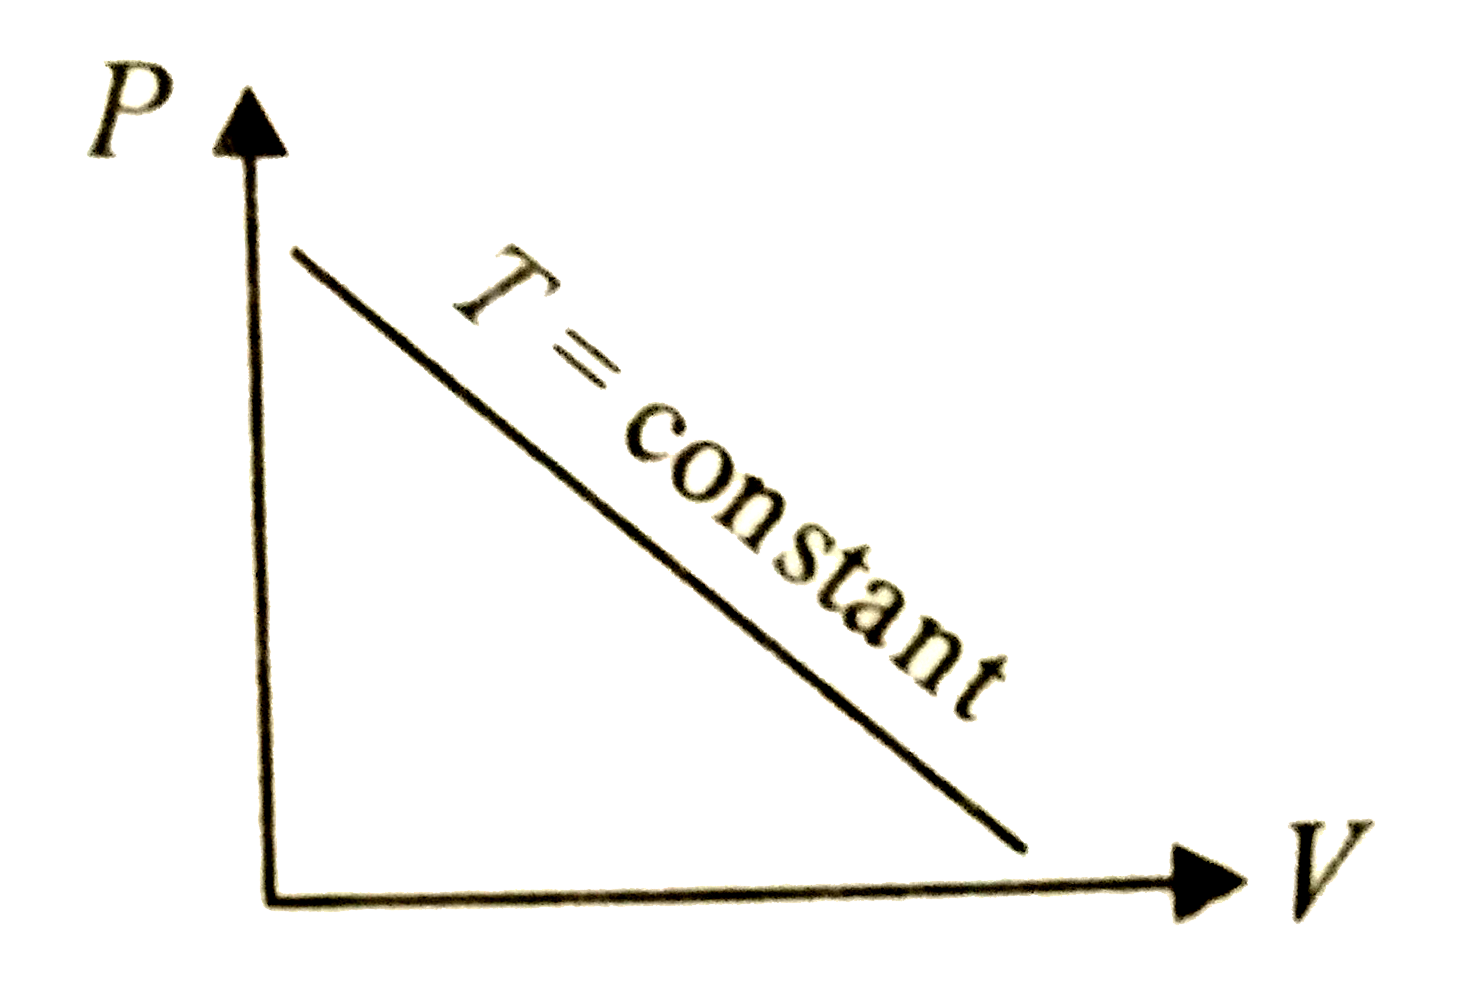 D
D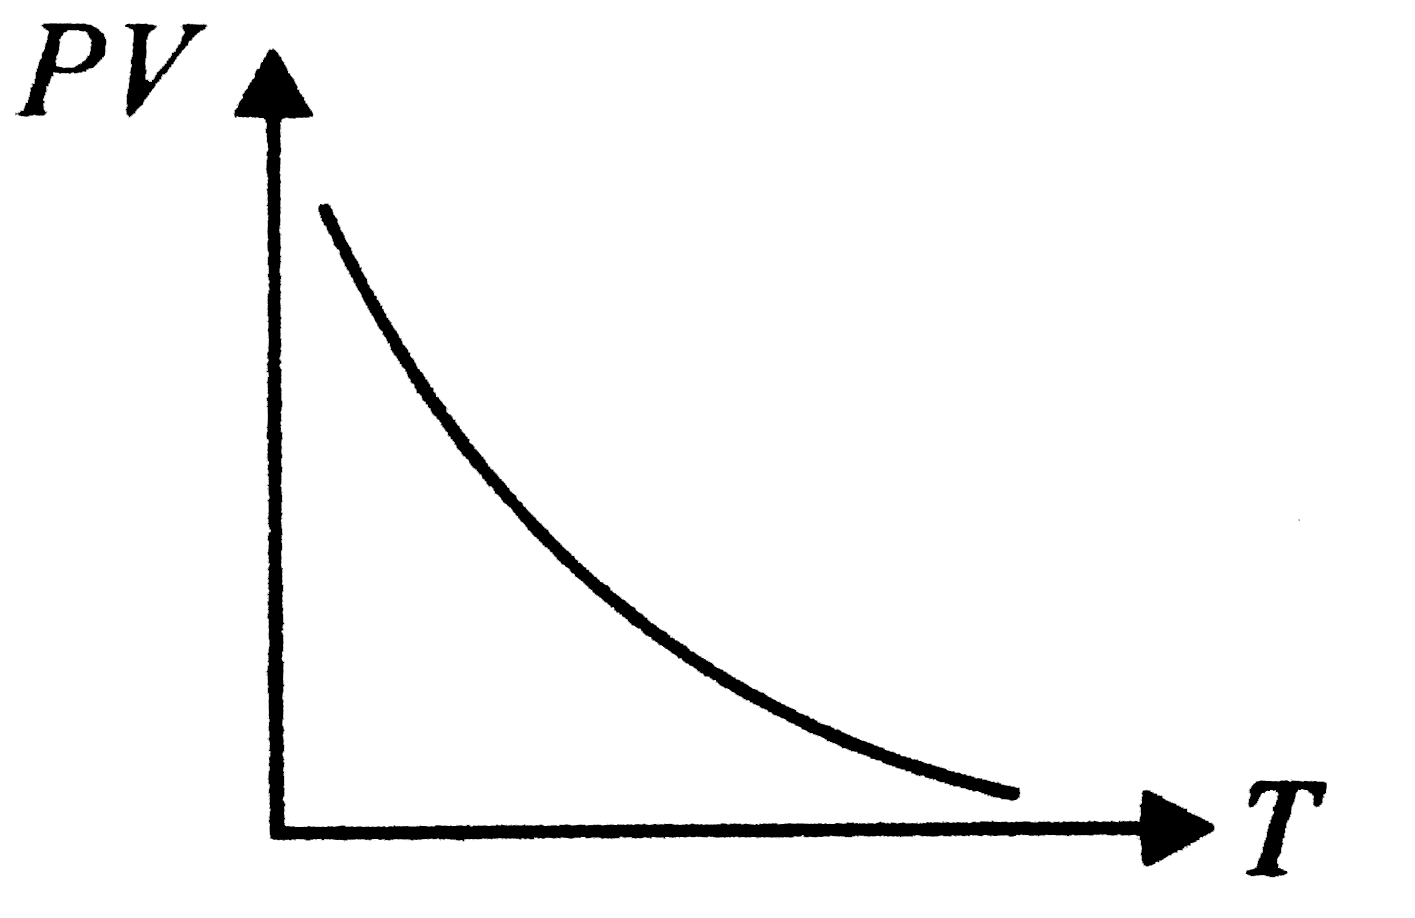
The velocity -displacement graph of a particle is as shown in the figure. Which of the following graphs correctly represents the variation of acceleration with displacement?

View SolutionDuring the thermodynamic process shown in figure for an ideal gas
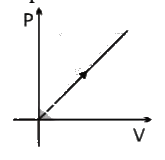
View SolutionGraph between velocity and displacement is shown in the following figure:
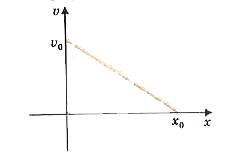
Which of the following graphes represents the correct variation of acceleration with displacement
View SolutionAn ideal gas undergoes the cyclic process shown in a graph below :
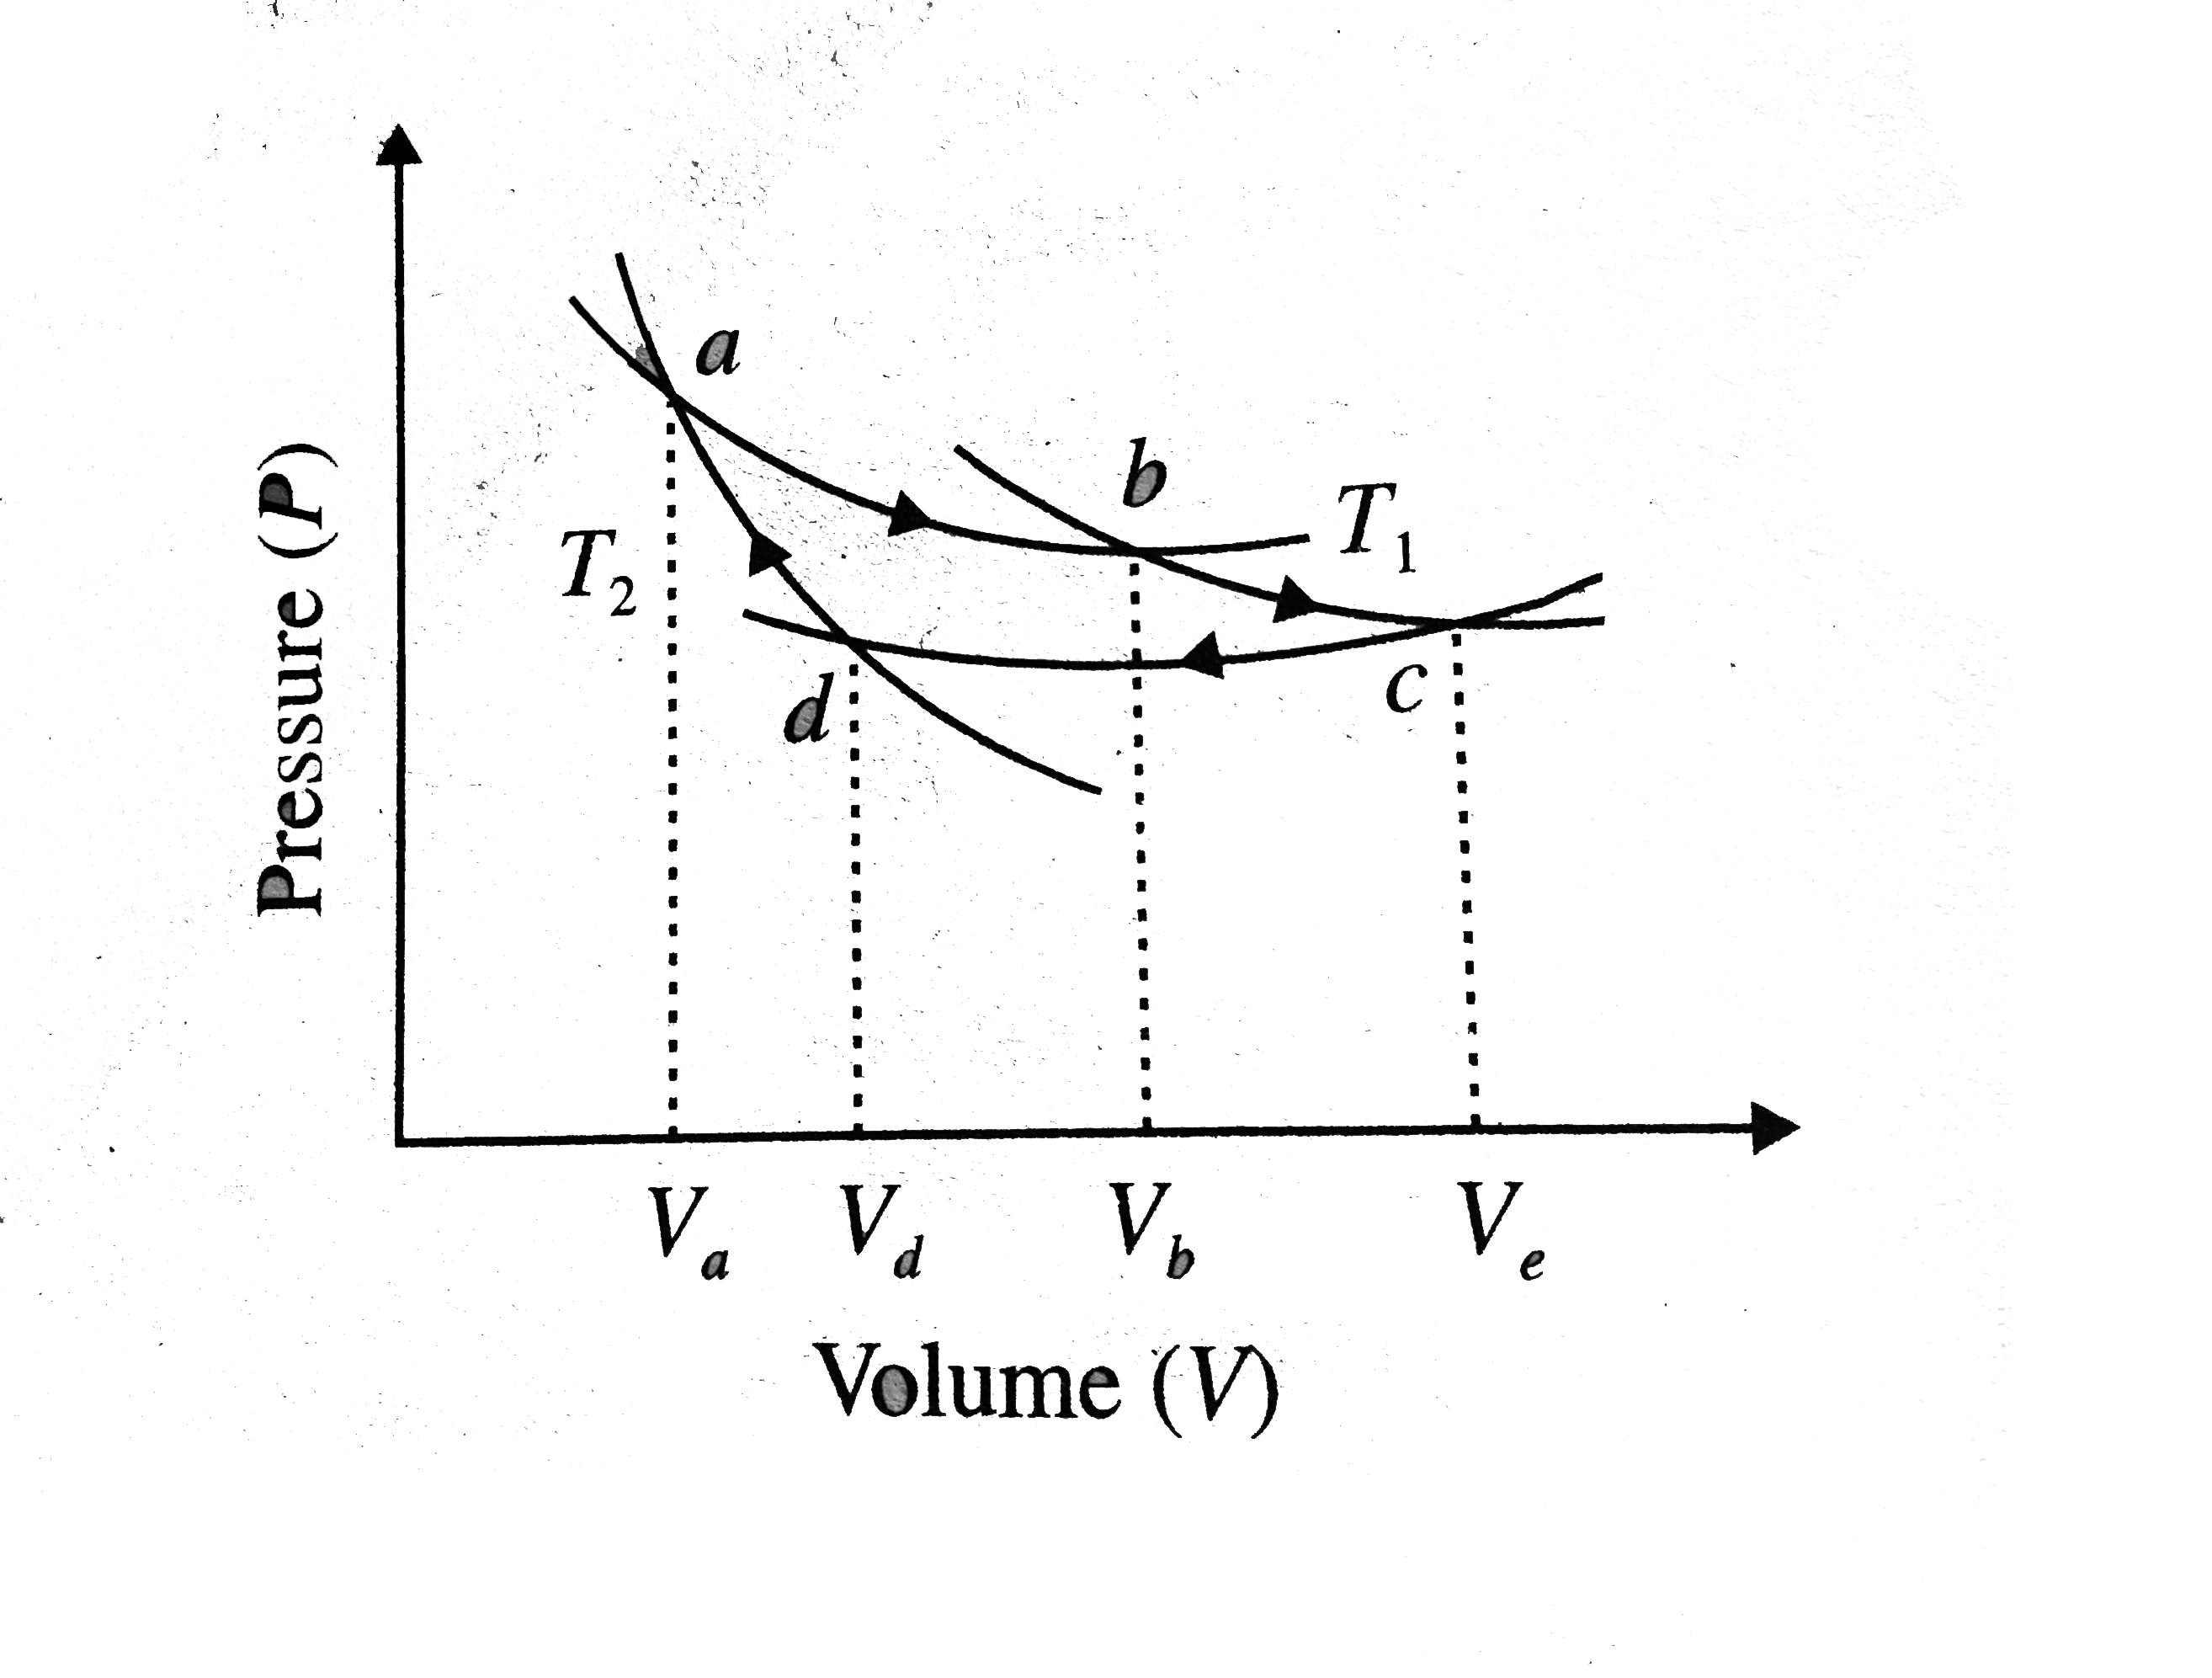
View SolutionAn enclosed ideal gas is taken through a cycle as shown in the figure. Then

View Solution