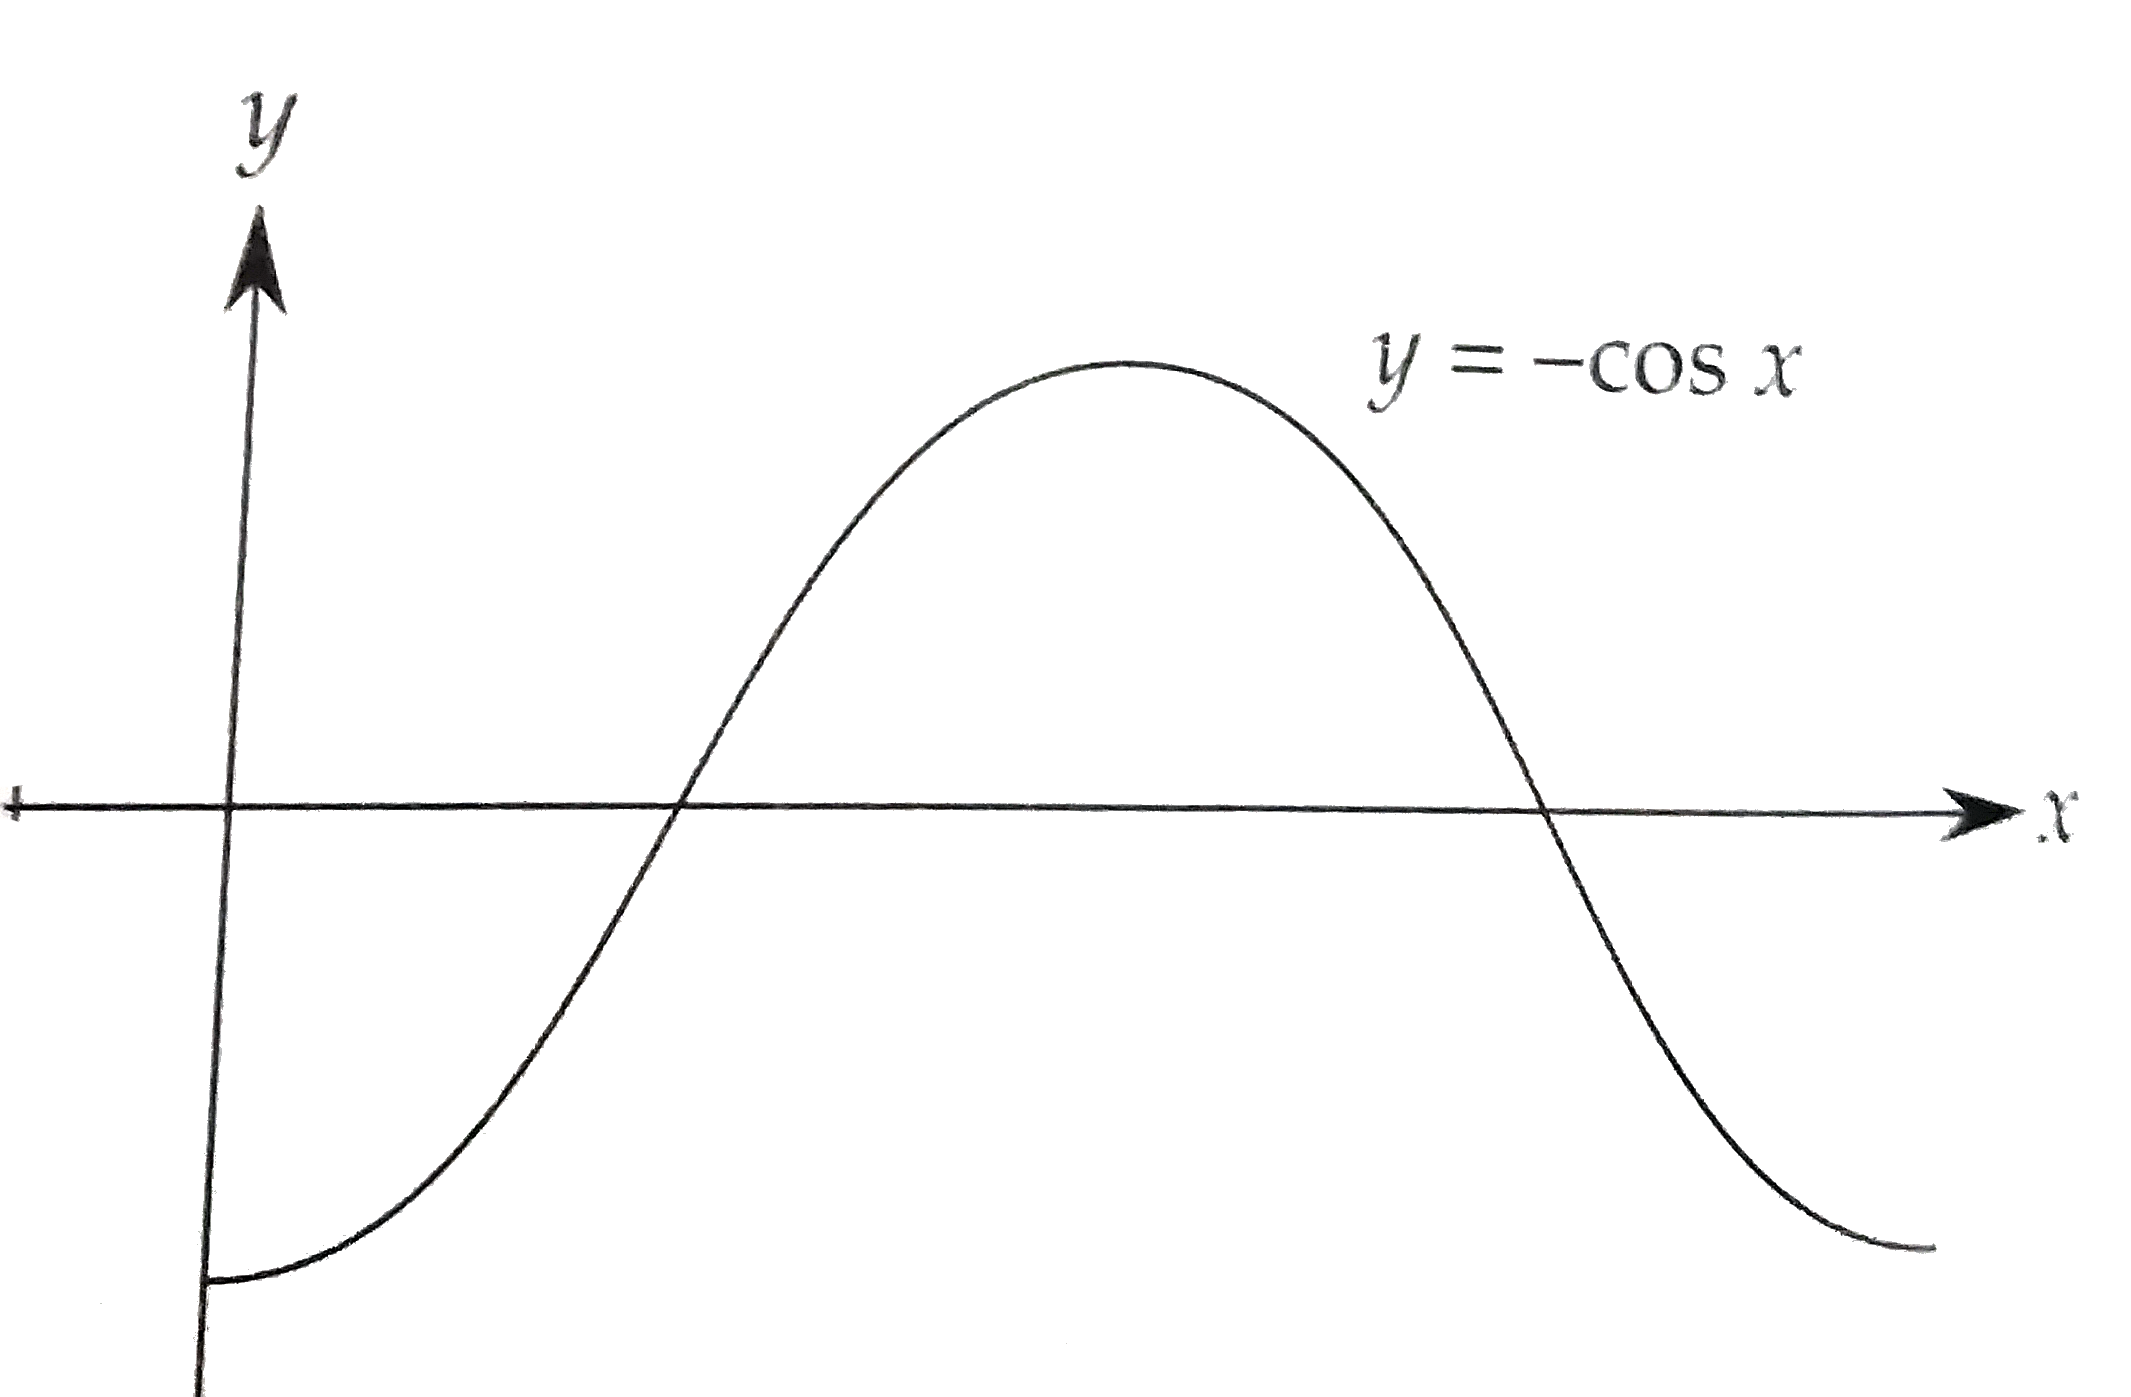
One complete of the graph of y=−cosx is shown in the Figure. What are the coordinates of the point at which the maximum possible value of y occurs ?
A
(π2,0)
B
(π2,π)
C
(π,1)
D
(3π2,−1)
Video Solution
Text Solution
The correct Answer is:C
The graph of the function y=−cosx has y=−1 at x = 0, y increases to 0 at x=π2,y continues increasing until it is 1 at x=π, then y decreases to 0 at x=3π2, and y continues decreasing until it reaches −1 again at the end of the cycle at x=2π. The coordinates of the point where y is a maximum are (π,1).
|
Updated on:21/07/2023
Topper's Solved these Questions
Similar Questions
Knowledge Check
- Question 1 - Select One
What is the y - coordinate of the point at which the graph of y = 2 sin x - cos 2 x intersects the y - axis ?
A−2B−1C0D1 - Question 2 - Select One
The graph of y=3−5sin(x−π) is shown in the standard (x,y) coordinate plane below. What is the range of y?
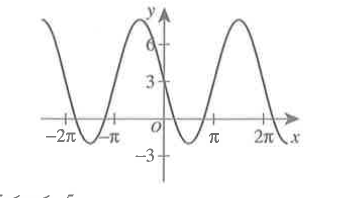 A−5≤y≤5B−2≤y≤2C−2≤y≤8D3≤y≤8
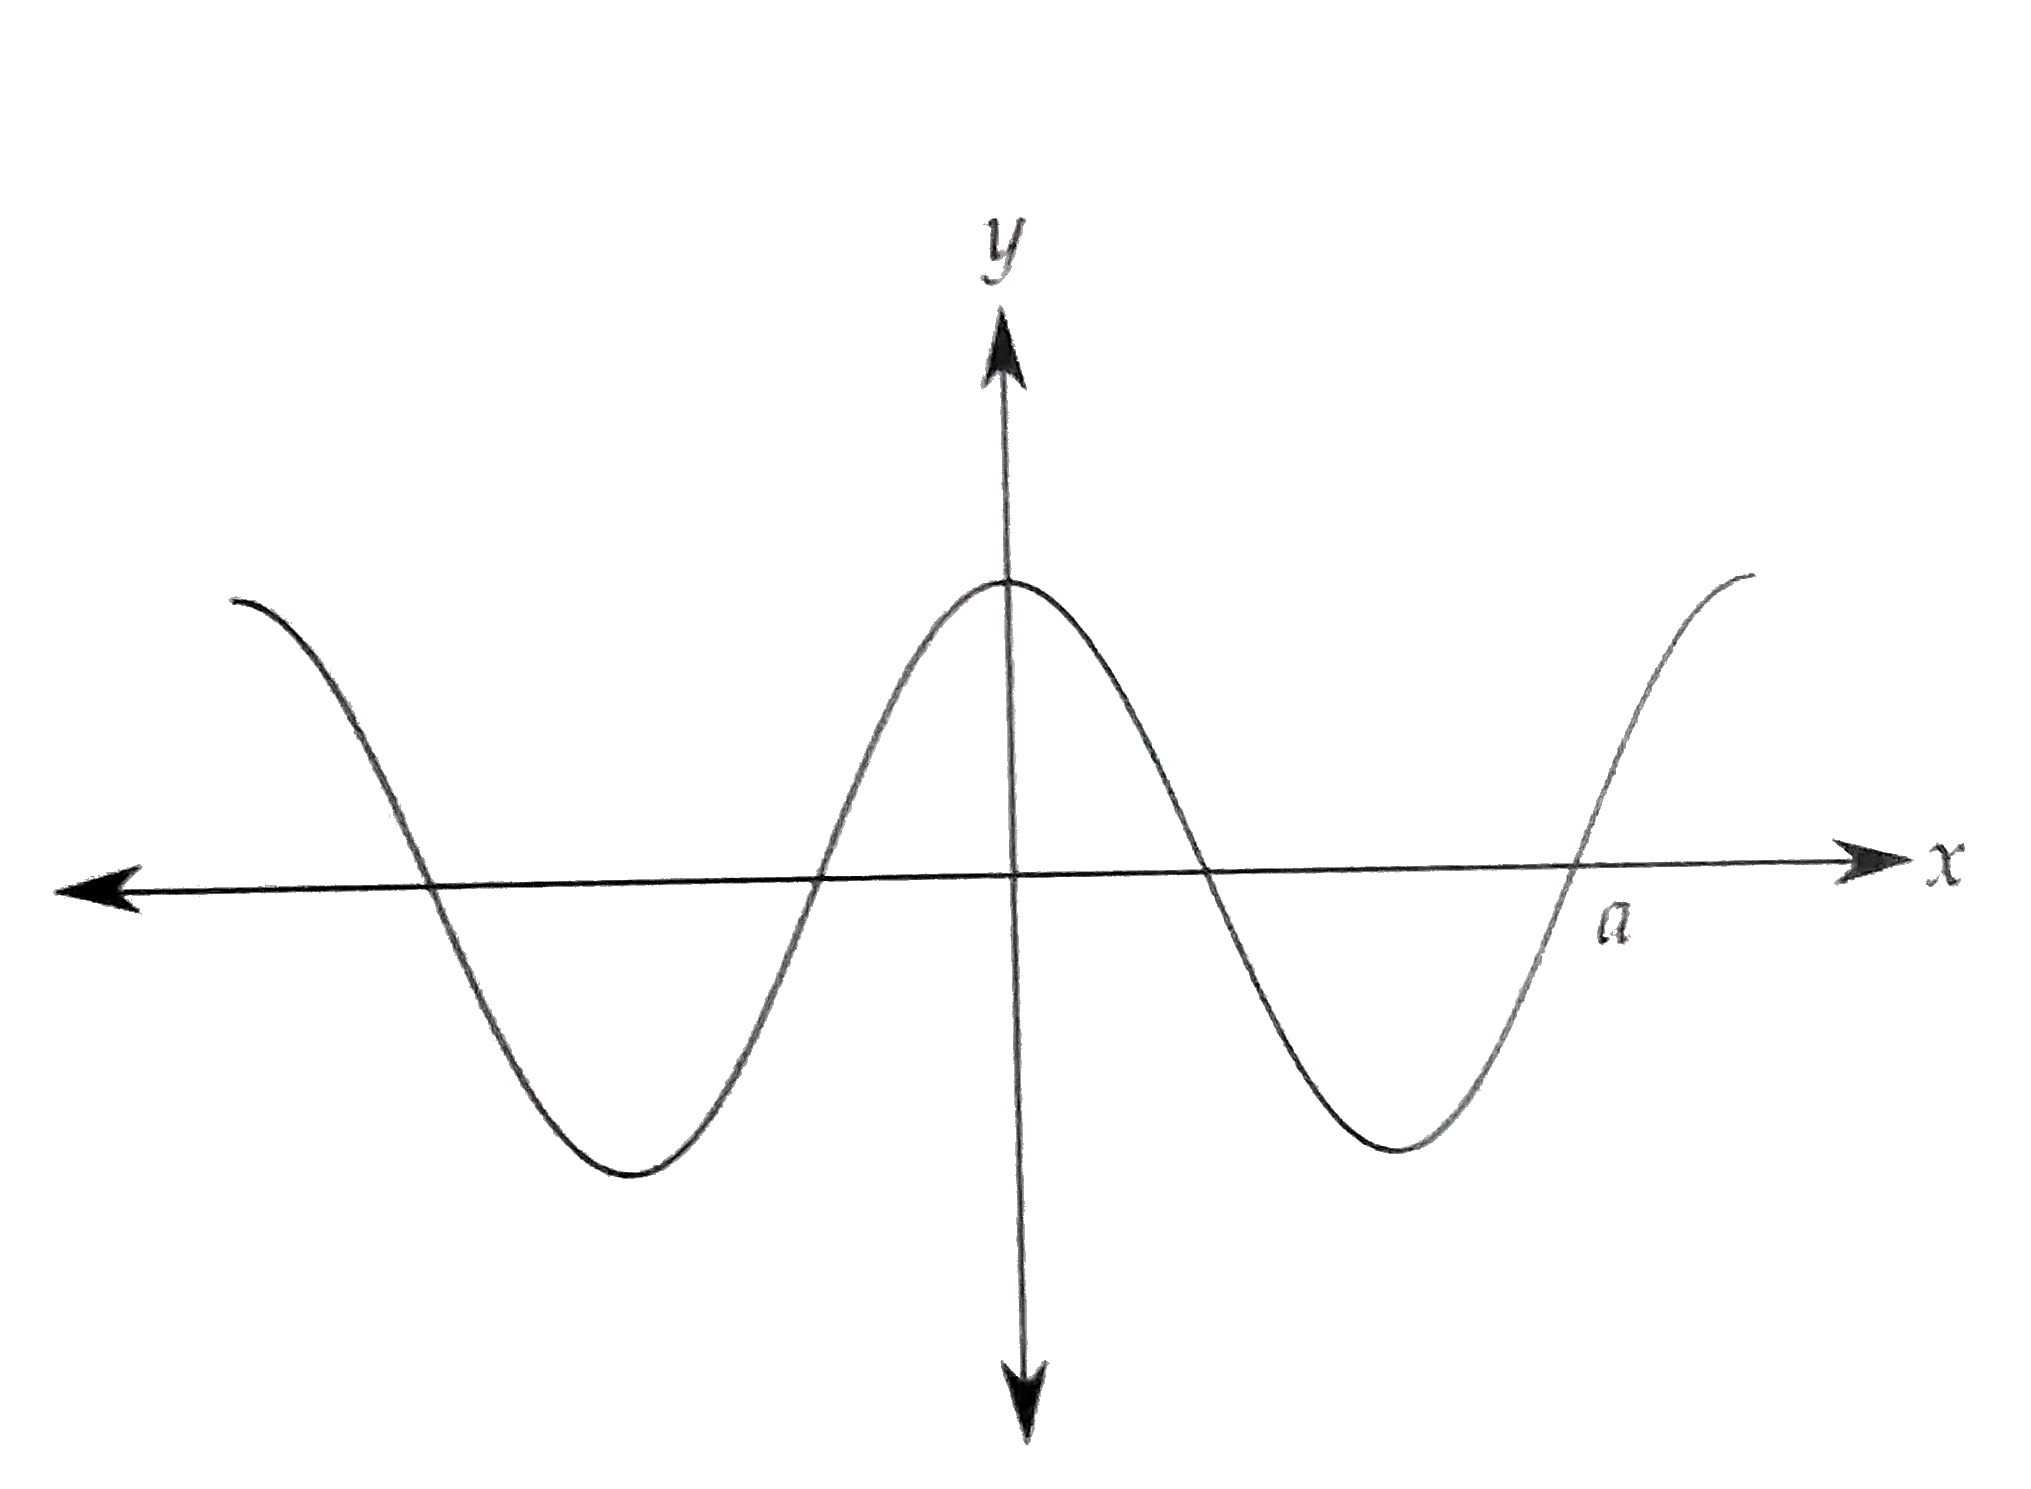
The graph of y=cos.x2 is shown in Figure Point a has coordinates (t, 0). What is the value of t in radians ?
 View Solution
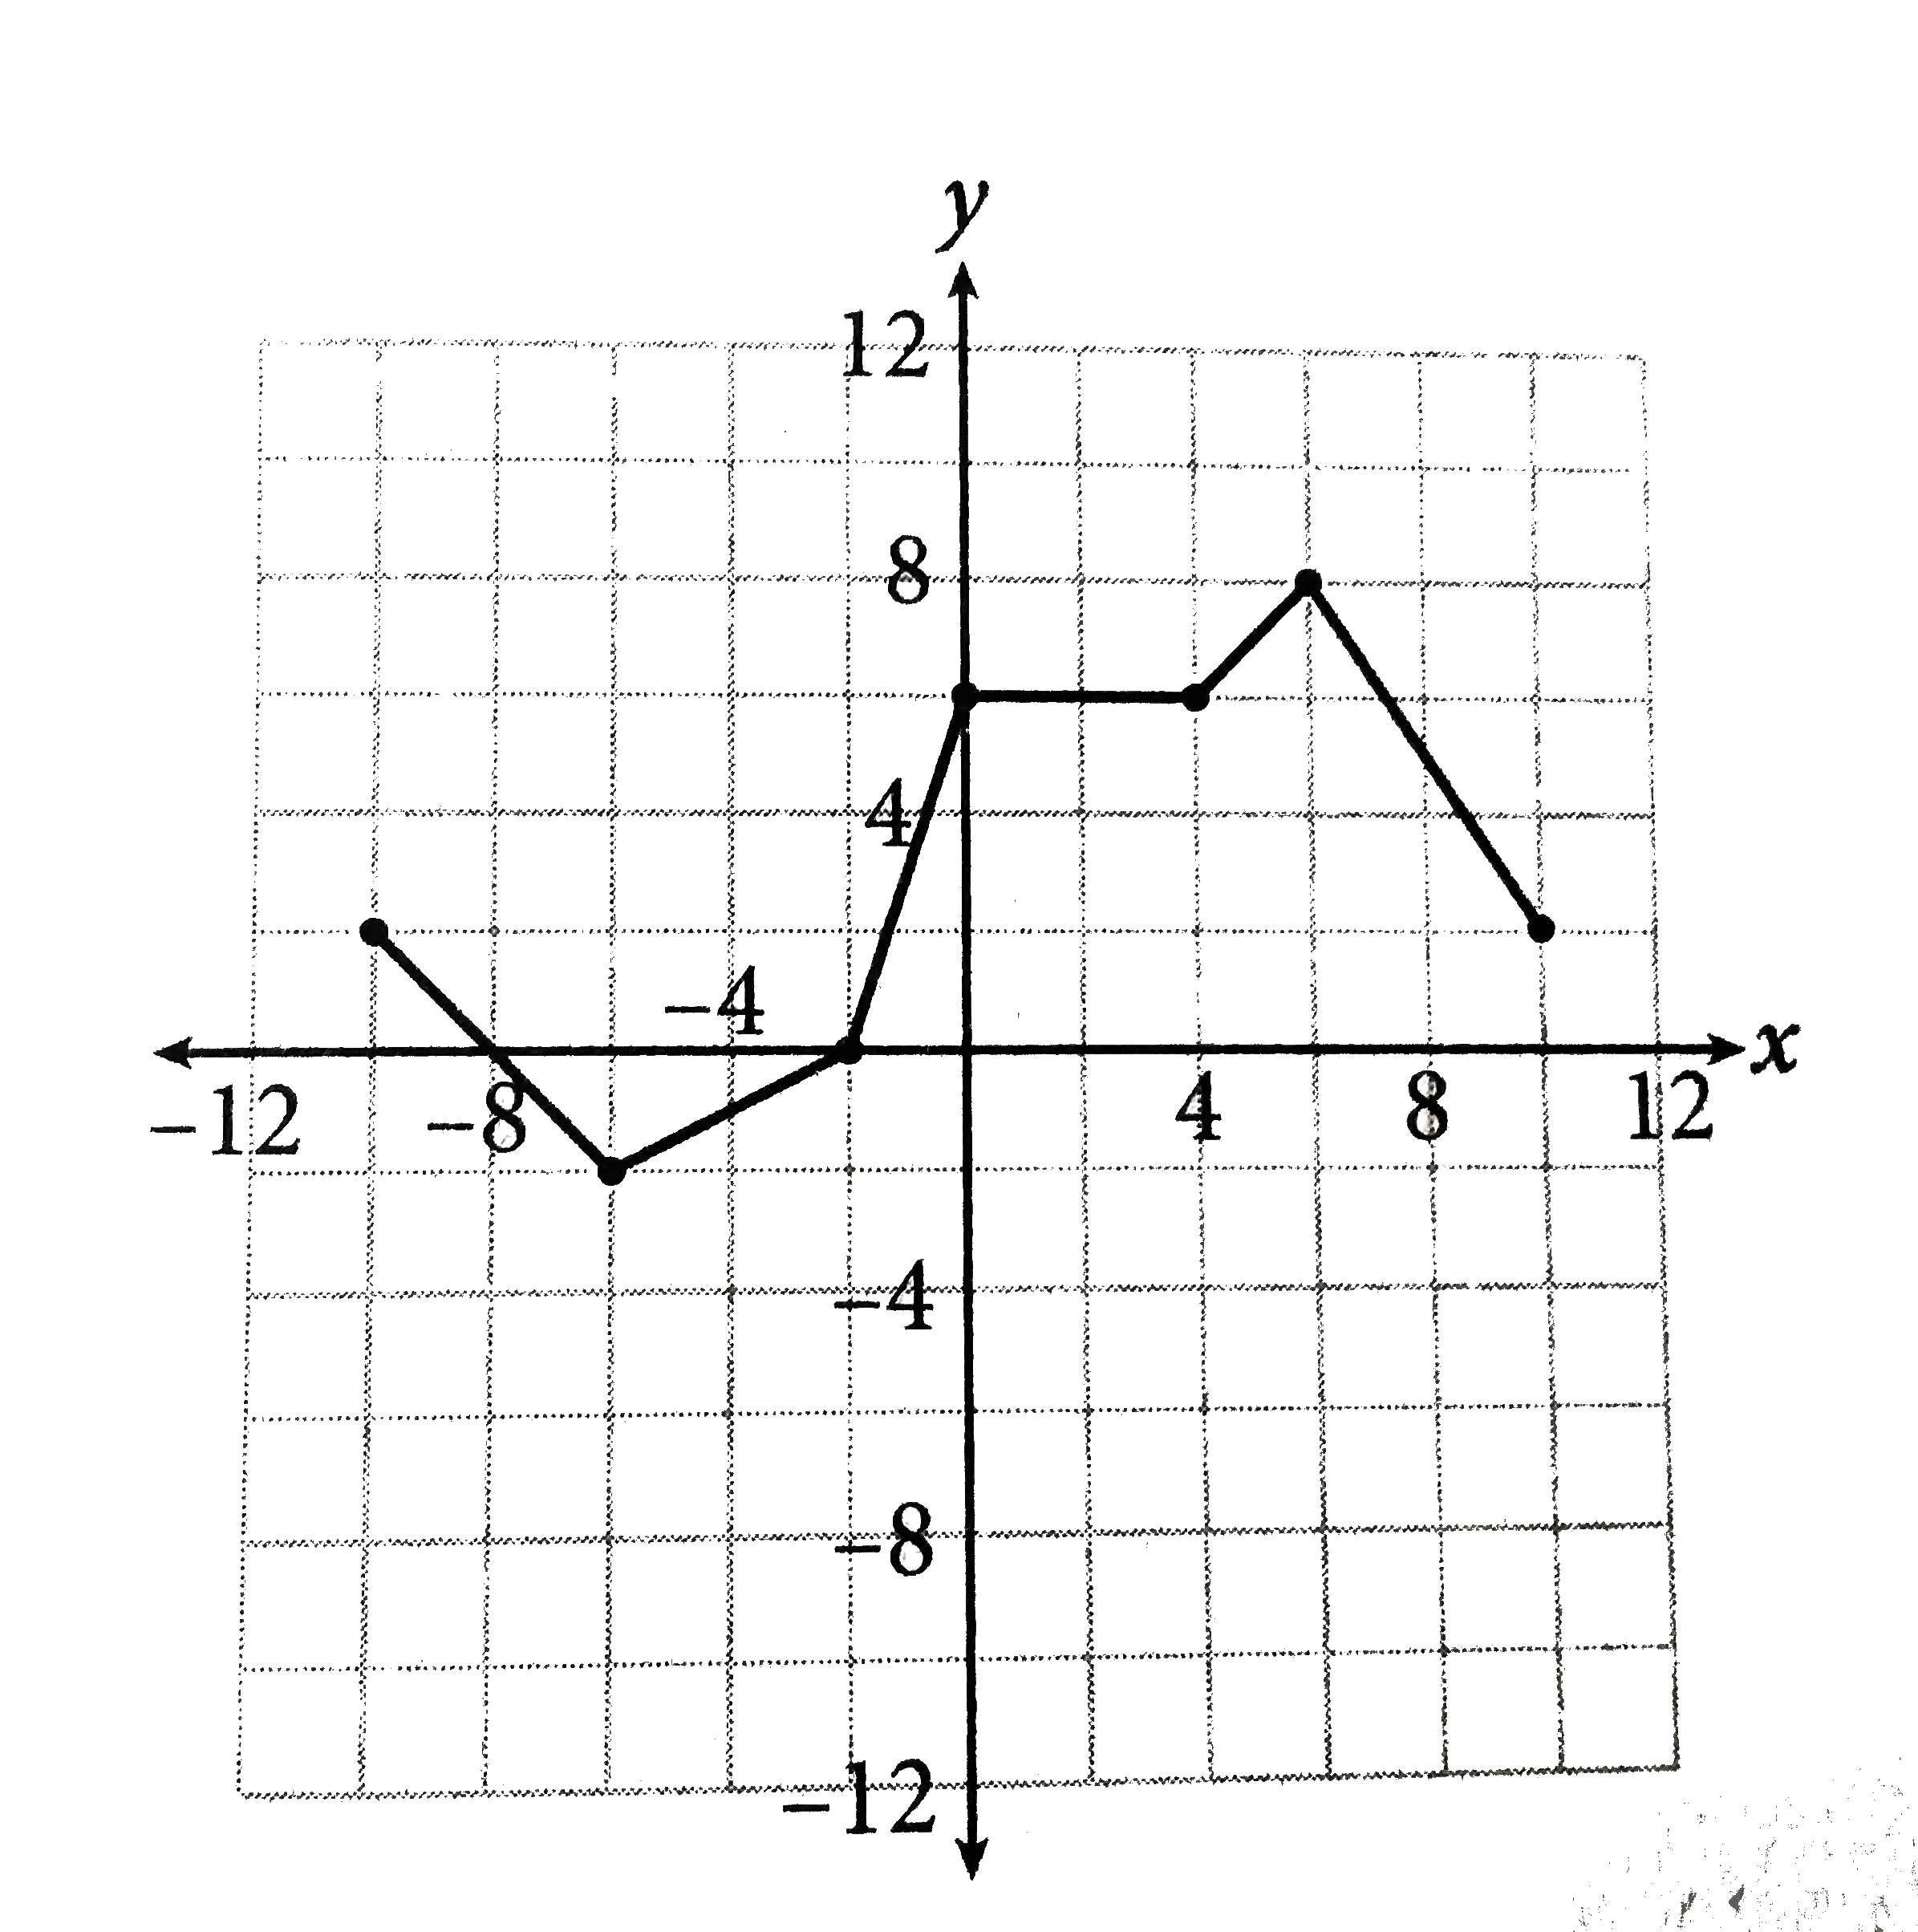
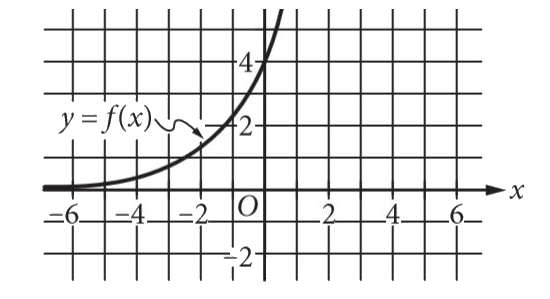
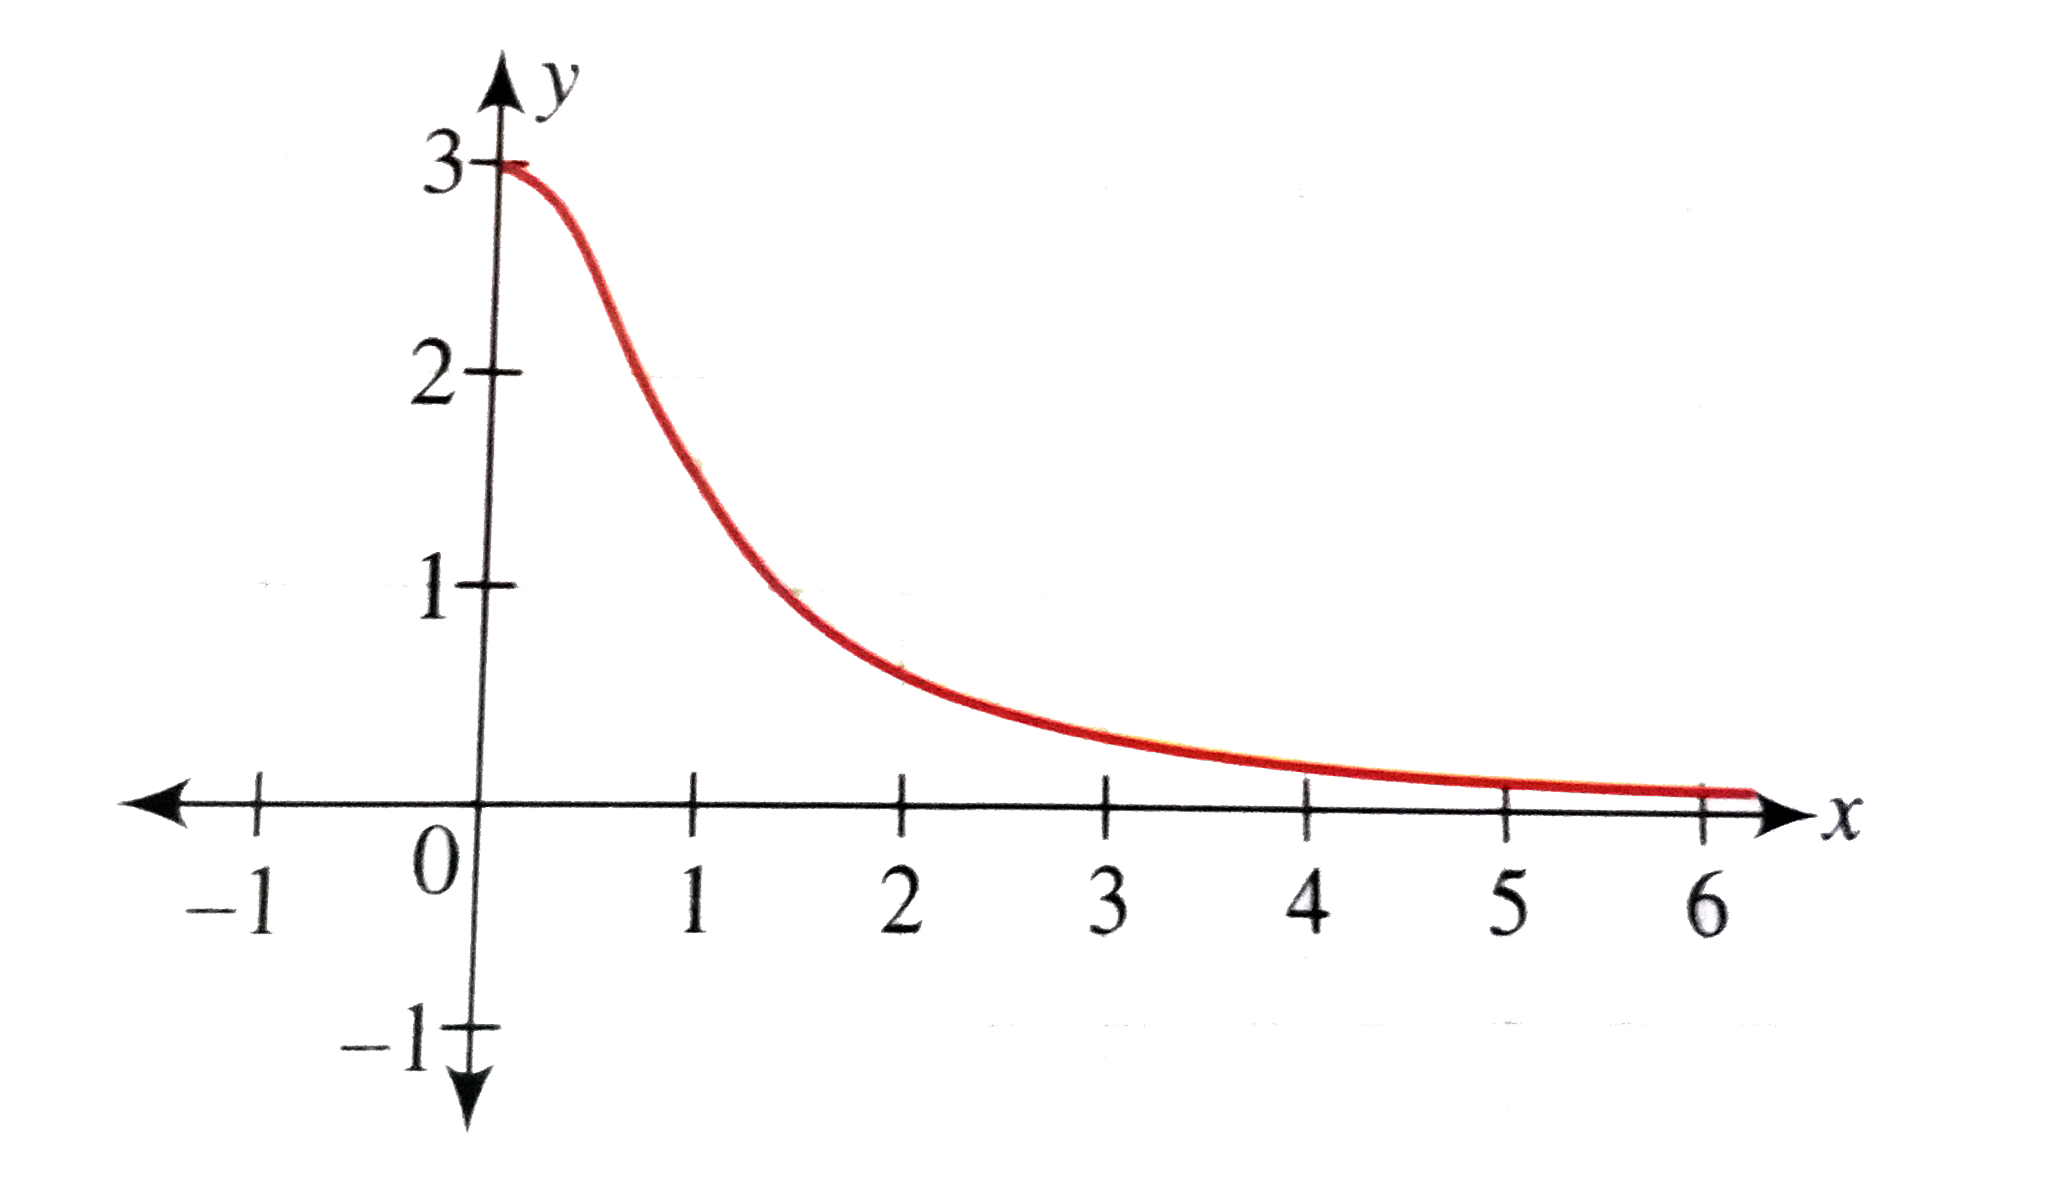
The complete graph of the functions h is shown in the xy plane above. For what value of x is the value of h(x) at its maximum?View SolutionThe graph of y=f(x) is as shown in the following figure. Draw the graph of y=[f(x)].
 View Solution
If a point lies on X-axis, then what are its y and z co-ordinates ?
View SolutionDraw the graph of y=−cos−1(cosx).
View SolutionDraw the graphs of y=x and y=−x in the same graph. Also, find the coordinates of the point where the two lines intersect.
View Solution


