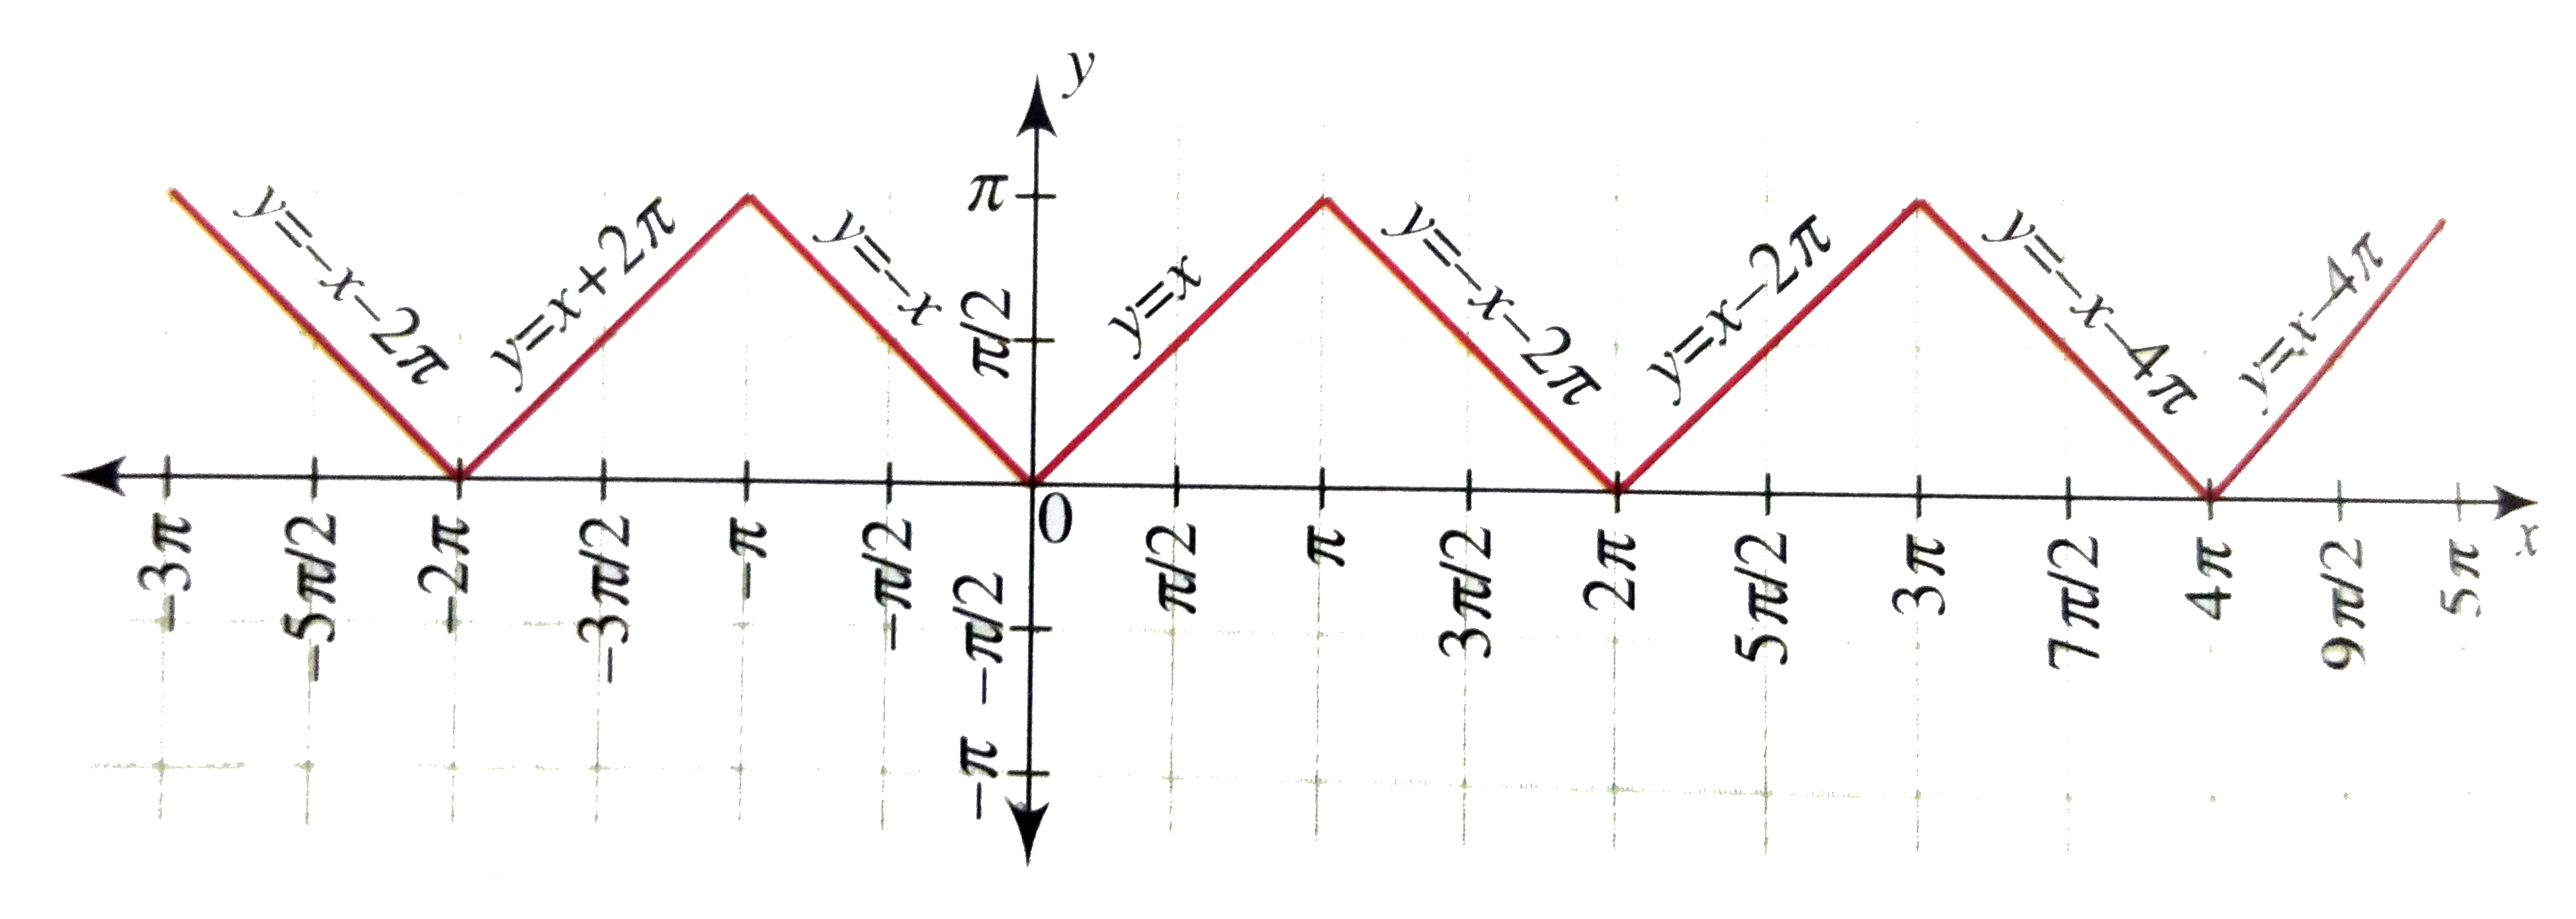
Draw the graph of y=−cos−1(cosx).
Video Solution
Text Solution
y=cos−1(cosx)
⇒ cosy=cosx
⇒ y=enπ±x,n∈Z
Now y∈[0,π] we have the following table for values of x and y.

From the above information, we can plot graph of y=cos−1(cosx) as shown in the follwing figure.

|
Updated on:21/07/2023
Topper's Solved these Questions
- BOOK - CENGAGE ENGLISHCHAPTER - GRAPH OF INVERSE TRIGONOMETRIC FUNCTIONSEXERCISE - Exercises18videos
GRAPH OF INVERSE TRIGONOMETRIC FUNCTIONS
- BOOK - CENGAGE ENGLISHCHAPTER - GETTING STARTED WITH GRAPHSEXERCISE - Exercises 1.181videos
GETTING STARTED WITH GRAPHS
- BOOK - CENGAGE ENGLISHCHAPTER - GRAPHICAL TRANSFORMATIONSEXERCISE - ILLUSTRATION78videos
GRAPHICAL TRANSFORMATIONS
Similar Questions
Draw the graph of y=−cot−1x.
View SolutionDraw the graph of y=2x−1
View SolutionDraw the graph of y=|x|
View SolutionDraw the graph of y=cot−1(cotx)
View SolutionDraw the graph of y=cos2x.
View SolutionDraw the graph of y=cot−1|x|.
View SolutionDraw the graph of y=cot−1(−x).
View SolutionDraw the graph of y=cos−1(2x).
View SolutionDraw the graph of y=x+1x
View SolutionDraw the graph of y=sin−1(sinx)
View Solution

