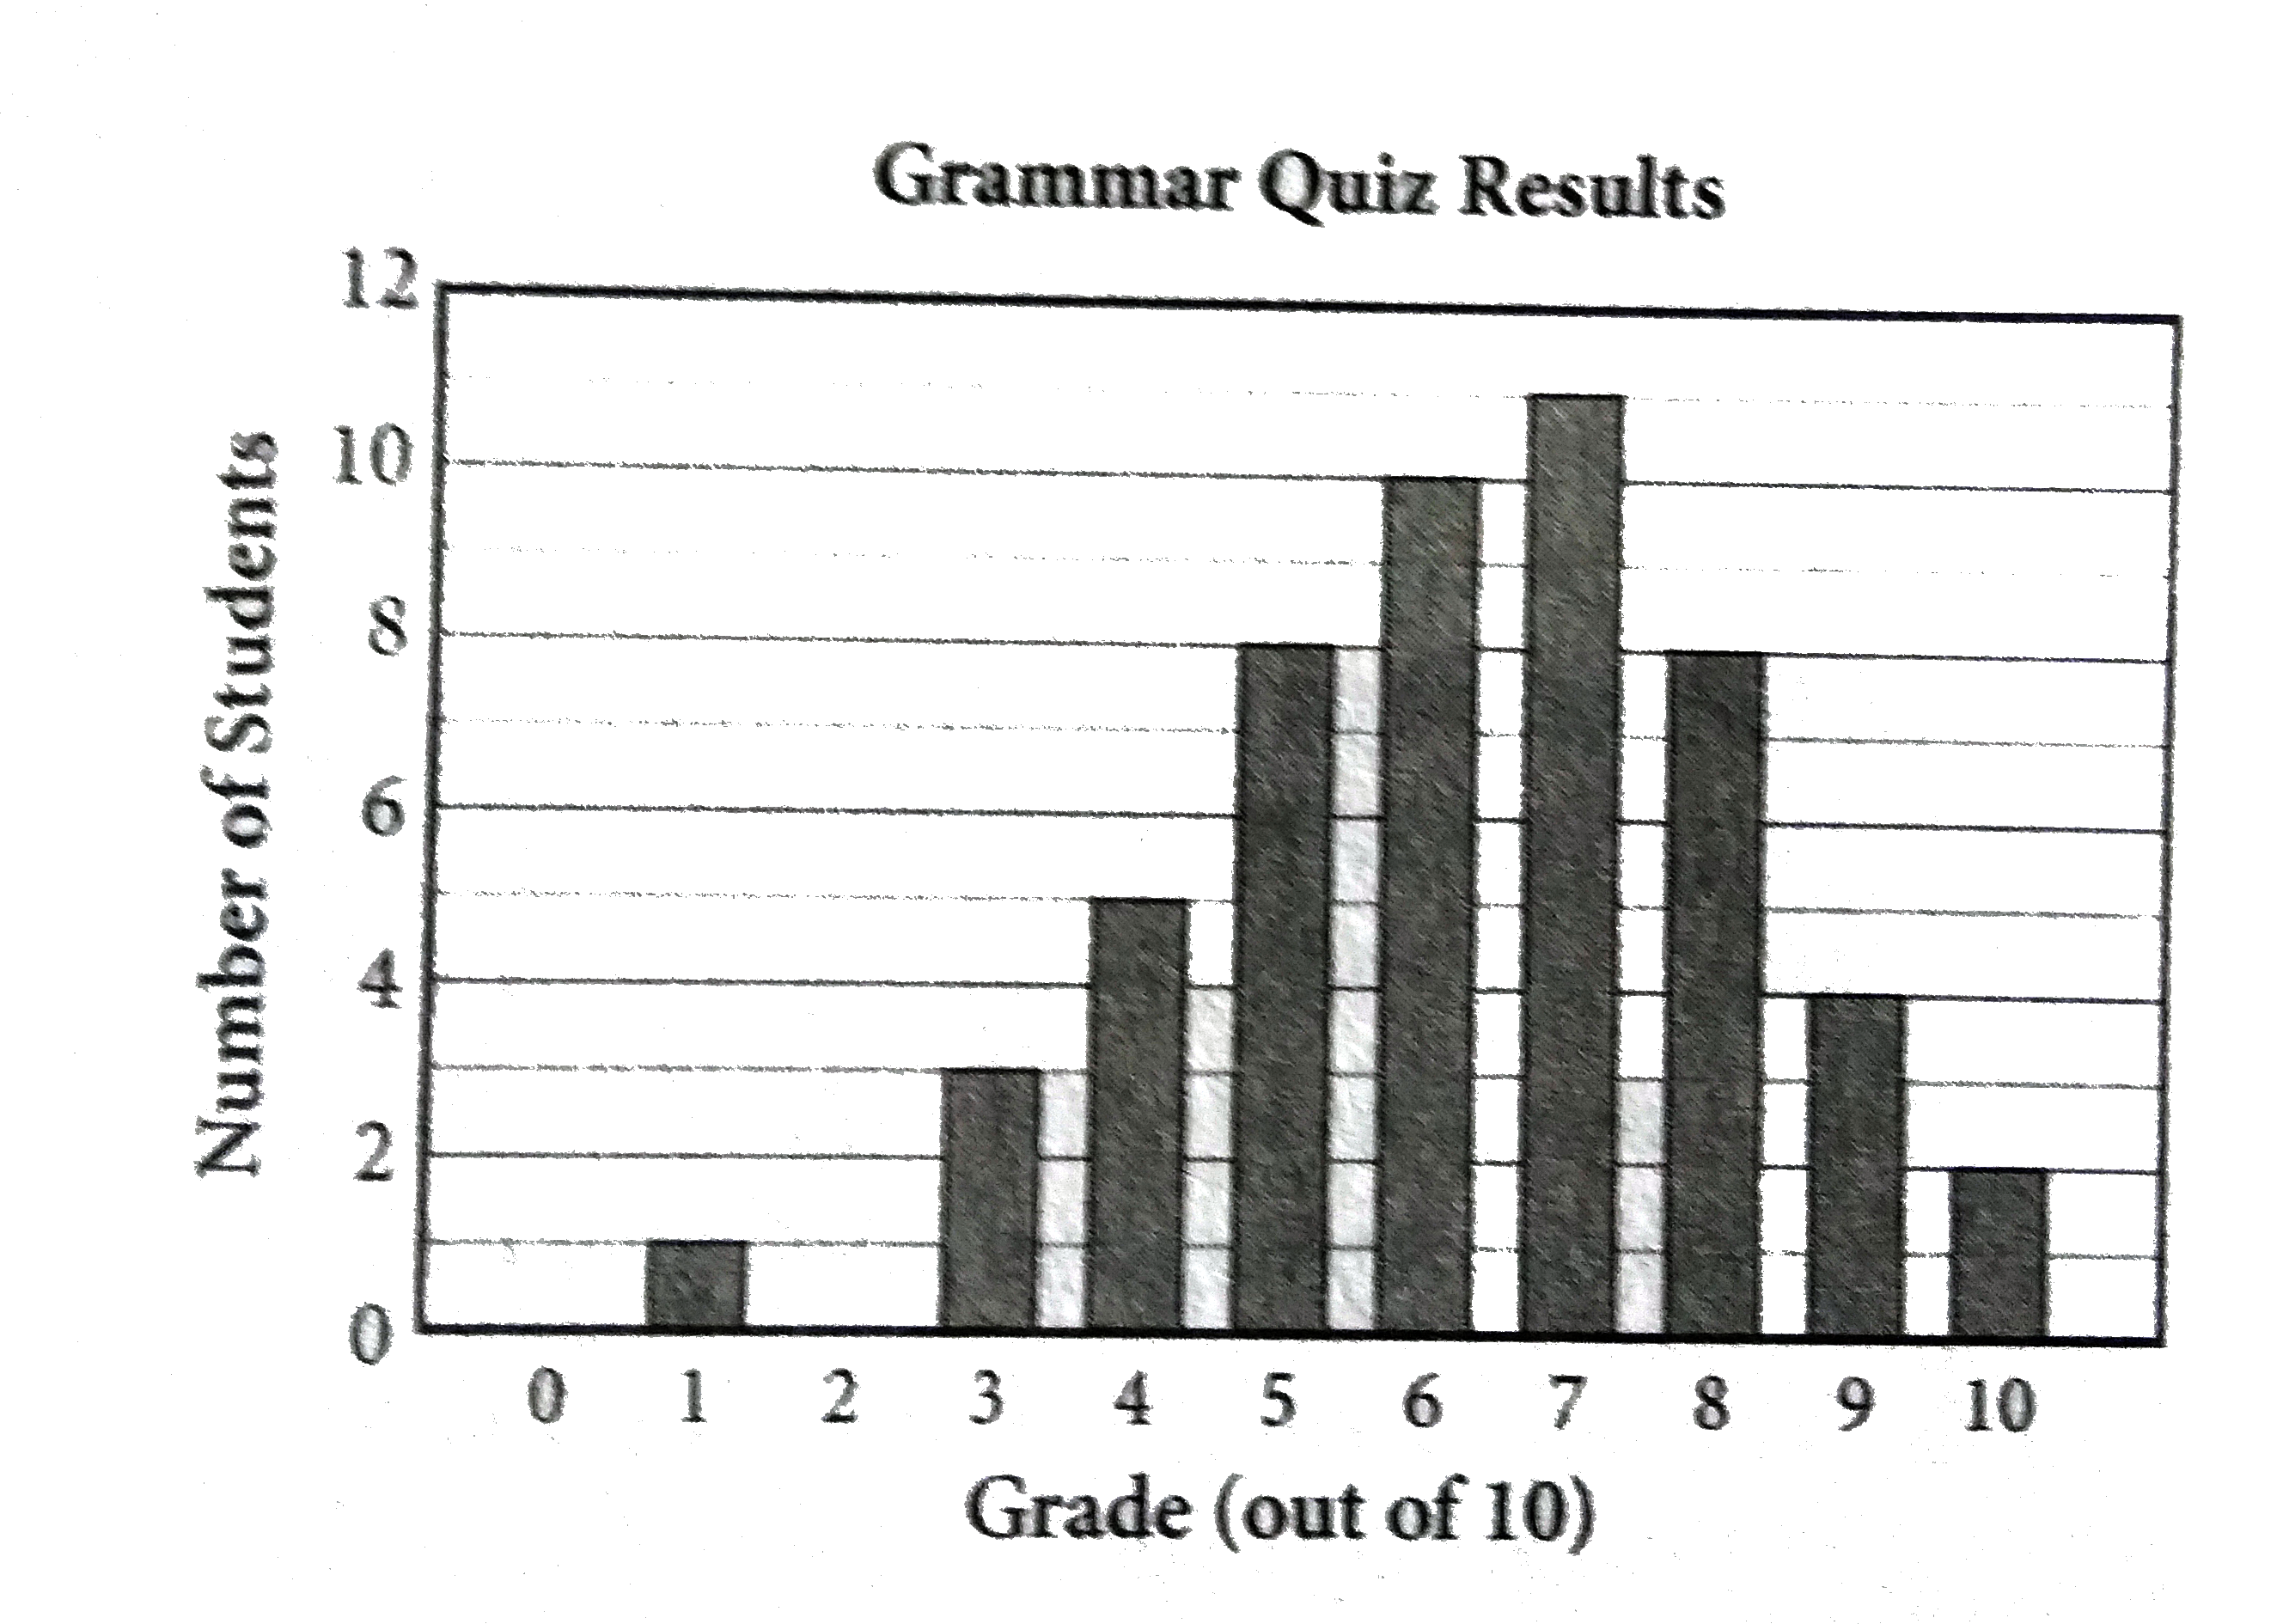
The bar graph shows the result of a grammar quiz in a language arts class. What is the difference between the mean and median of the quiz scores? Round your answer to the nearest hundredth.
The correct Answer is:B
Difficult: Medium
Category: Problem Solving and Data Analysis/ Statistics and Probability.
Strategic Advice: Knowing basic statistics definitions is the key to answering a question like this. The calculations aren't difficult- you just have to know how to perform them .
Getting to the Answer: When data values are arranged from least to greatest, the median is value in the middle. Add the bar heights to find that there are 5 students represented in the bar graph, which is an event number, so take the average of the two middle values to get the median. Half of 52 is 26, so the values in the these values are the 26th and 27th value. Both of these values are 6, so the median is 6. To find the mean, add all the quiz scores together and divide by the number of students 52. To need up the calculations, multiply each bar height by the corresponding score (metally if possible):
[(1×1)+(3×3)+(5×4)+(8×5)+(10×6)+(11×7)+(8×8)+(4×9)+(2×10)]/52=32752=6.2885.
Rounded to the nearest hundredth, the difference between the median and the mean is 6.29−6=0.29. Grib this in as. 29.
Topper's Solved these Questions
Similar Questions
At a certain bank, month held in account X earns a monthly interest equal to 2 percent of the original investment, while account Y earns a monthly interest equal to 2 reprecent of the current value of the account. If $500 is invested into each account, what is the positive difference between the value of account X and account Y after three years ? (Round you answer to the nearest dollar and ignore the dollar sign when gridding you response.)
View SolutionAges of the First 12 United States Presidents at the Beginning of Their Terms in Office
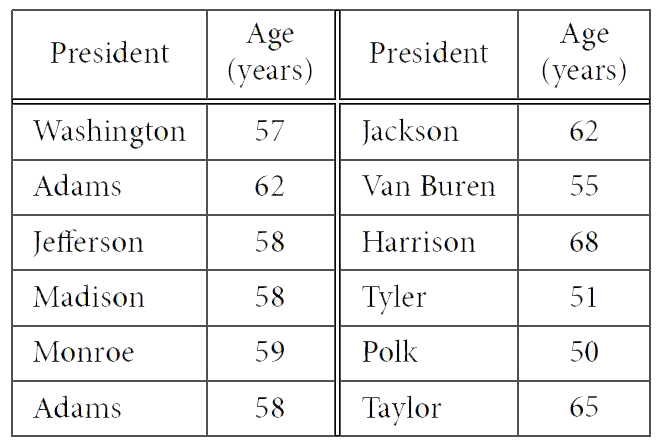
The table above lists the ages of the first 12 United States presidents when they began their terms in office. According to the table, what was the mean age, in years, of these presidents at the beginning of their terms? (Round your answer to the nearest tenth.)View Solution
Knowledge Check
- Question 1 - Select One
In a particular college, the test scores of the most recent test given for a particular Physics class and a particular Literature class were studied. Both tests were scored from 0 to 100 and had a total of 20 question, which were equally weighted with no partial credit. The physics class had 128 students and the Literature class had 75 students . The test results are shown in the two graphs below.
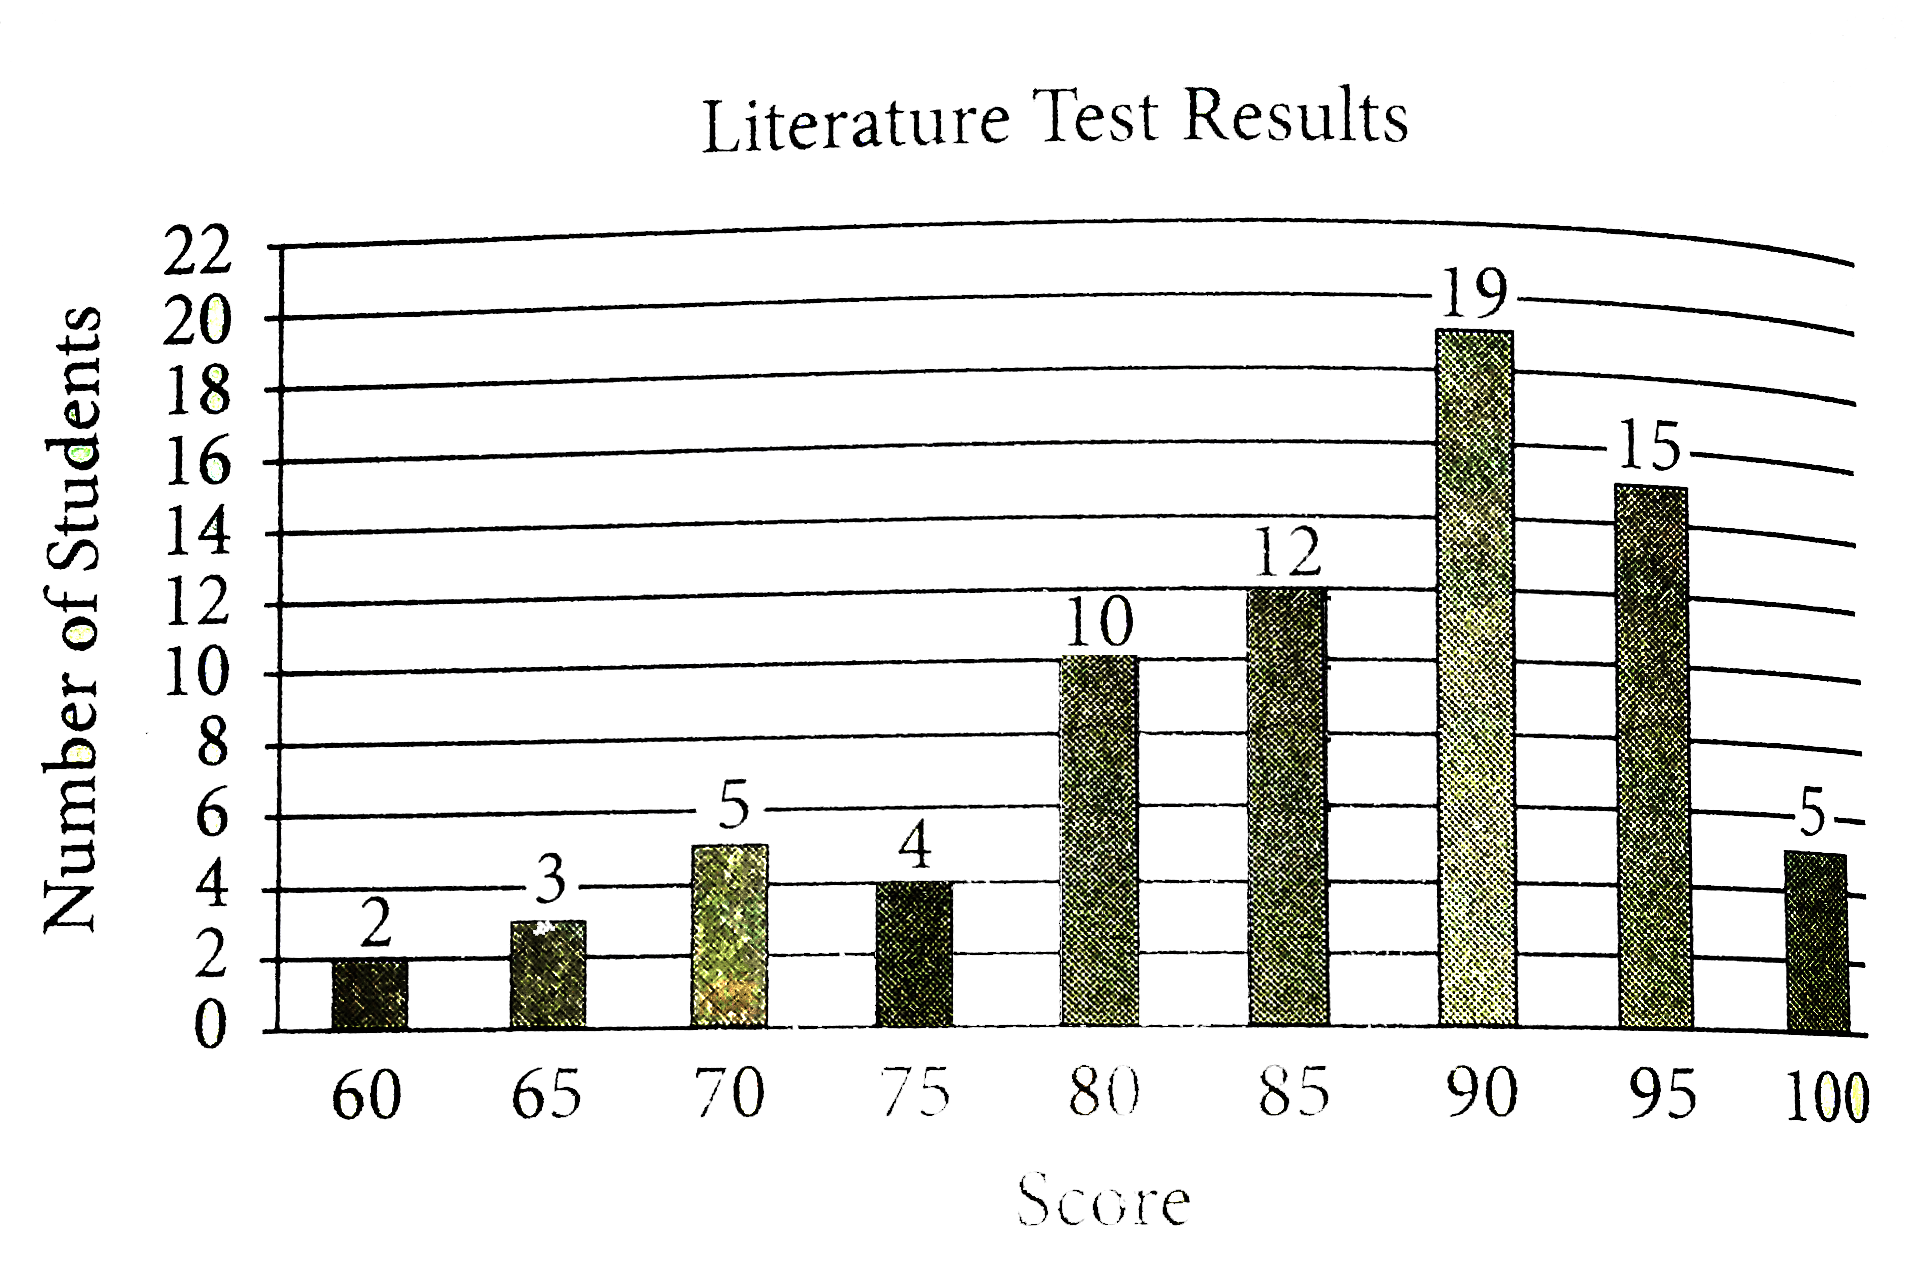
The dean of the college is comparing the scores from the two classes and calculates the median for each class. If the dean labels the median score of the Physics class P and the median score of the Literature class L, what is the sum of P and L?A175B170C85D80 - Question 2 - Select One
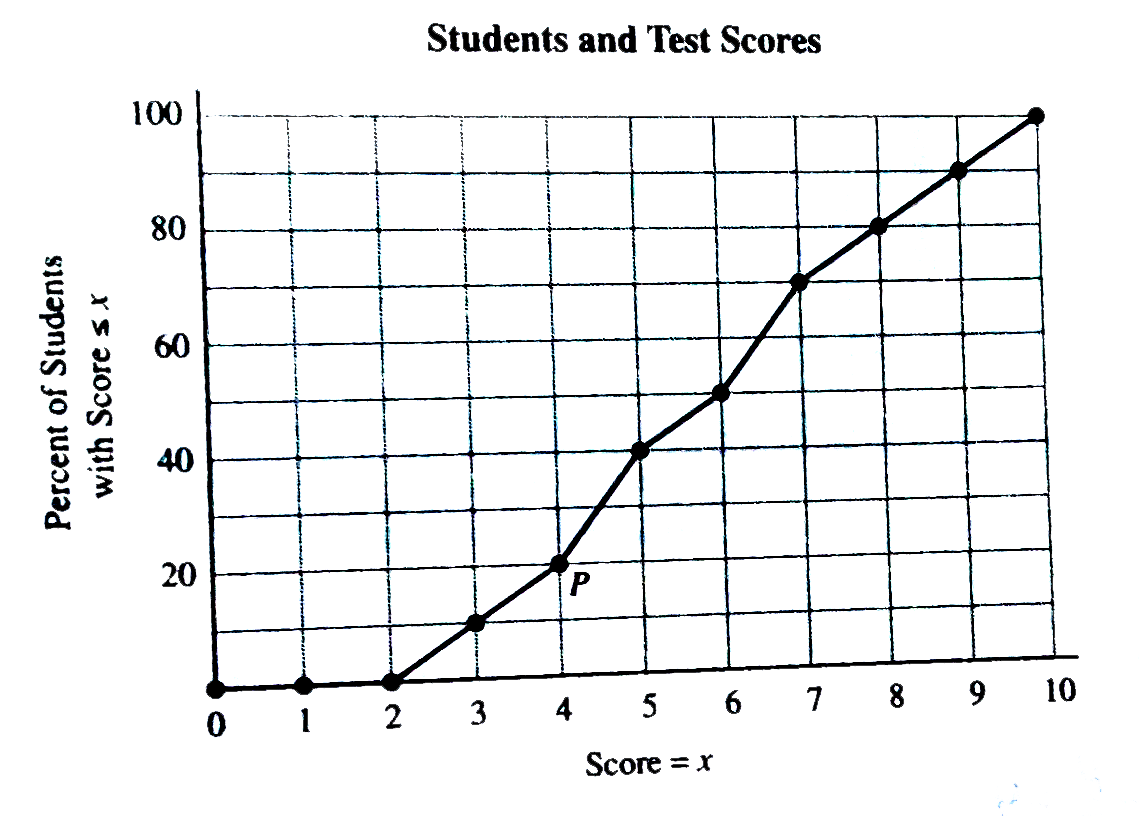
When a 10-question true -false quiz was given to 50 students , the number of correct answer ranged from 3 to 10 , as shown on the graph above . Each point on the graph shows the percent of students who earned scores less than or equal to x . For example , point P shows that 20 percent of the students received scores of 4 or less. According to the graph , how many students got scores of 6 ?A5B10C15D20

A chemical solvent is a substance that dissolves another to form a solution. For example, water is a solvent for sugar. Unfortunately, many chemical solvents are hazadous to the environment. One eco-friendly chemical solvent is chloroform, also known as trichloromethane (CHCl3). The table above shows the chemical makeup of one mole of chloroform.
Q.Carbon makes up what percent of the mass of one mole of chloroform? Round your answer to the nearest whole percent and ignore the percent sign when entering you answer.View SolutionRead the bar graph given in Figure and answer the following questions: What information is given by the bar graph? Which Doordarshan centre covers maximum area? Also tell the covered area. What is the difference between the areas covered by the centres at Delhi and Bombay? Which Doordarshan centres are in U.P. State? What are the areas covered by them?
View SolutionThe following bar graph shows the number of vehicles passing through a road crossing in Delhi in different time intervals on a particular day. Read the bar graph and answer the following questions: What does the bar graph represent? Also, give the maximum number of vehicles. When is the hourly traffic maximum? Also give the minimum number of vehicles. When is the hourly traffic minimum? What is the total number of vehicles passing through a crossing during a particular day?
View SolutionRead the bar graph given in Figure and answer the following questions: What information is given by the bar graph? What was the crop-production of rice in 1970-71? What is the difference between the maximum and minimum production of rice?
View SolutionExmine the given graph carefully.
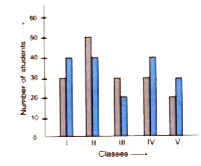
In the graph show above represents the number of girls in a particular class and represents the number of boys in the same class.
Read and answer the following questions.
(i) Which class has the least number of students ?
(ii) Which class has maximum number of students ?
(iii) What is the ratio between the number of girls and the number of boys of class V.View SolutionThe given bar graph shows the number of identical articles sold by 5 different stores A, B, C, D and E during a particular month.
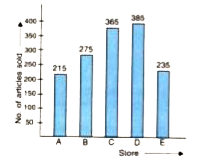
Study the bar graph and answer the following questions :
(i) Which store sold the largest number of articles ?
(ii) By what per cent is the sale of store D more than that of store B ?
(iii) Find the ratio of the total sale of the two highest selling stores to the total sale of the two least selling stores.
(iv) By how much must store E increase its sale to catch up with its nearest rival store ?View Solution
