The students in an environmental science class will be randomly assingned a storm to research, with no two students researching the same storm. Given that the students will each be assigned a hurricane or a major hurricane for their raports,what is the probability that students will be assigned a storm that occurred prior to 2000?
0.2618
0.3574
0.6426
0.7324
The correct Answer is:B
Difficult: Medium
Category: Problem Solving and Data Analysis/ Statistics and Probability.
Strategic Advice: In a probability question, the phrse " given that" indicates conditional probability, which means the total possible outcomes will be different from the total number of values in the table. Take this into amount when setting up your calculations.
Getting to the Answer: You're told that all student will be assigned a hurricane or major hurricane, so the total possible outcomes in the sum of these categories: 175+74=249. The question asks for the probability that a randomly selected storm occurred prior to 2000, so add together the number of the hurrinaces and major hurrinaces that occurred before 2000 (which includes 1990-1994 and 1995-1999): 23+5+41+20=89. This means the probability you're after is 89249=0.3574. (B) is therefore correct.
Topper's Solved these Questions
Similar Questions
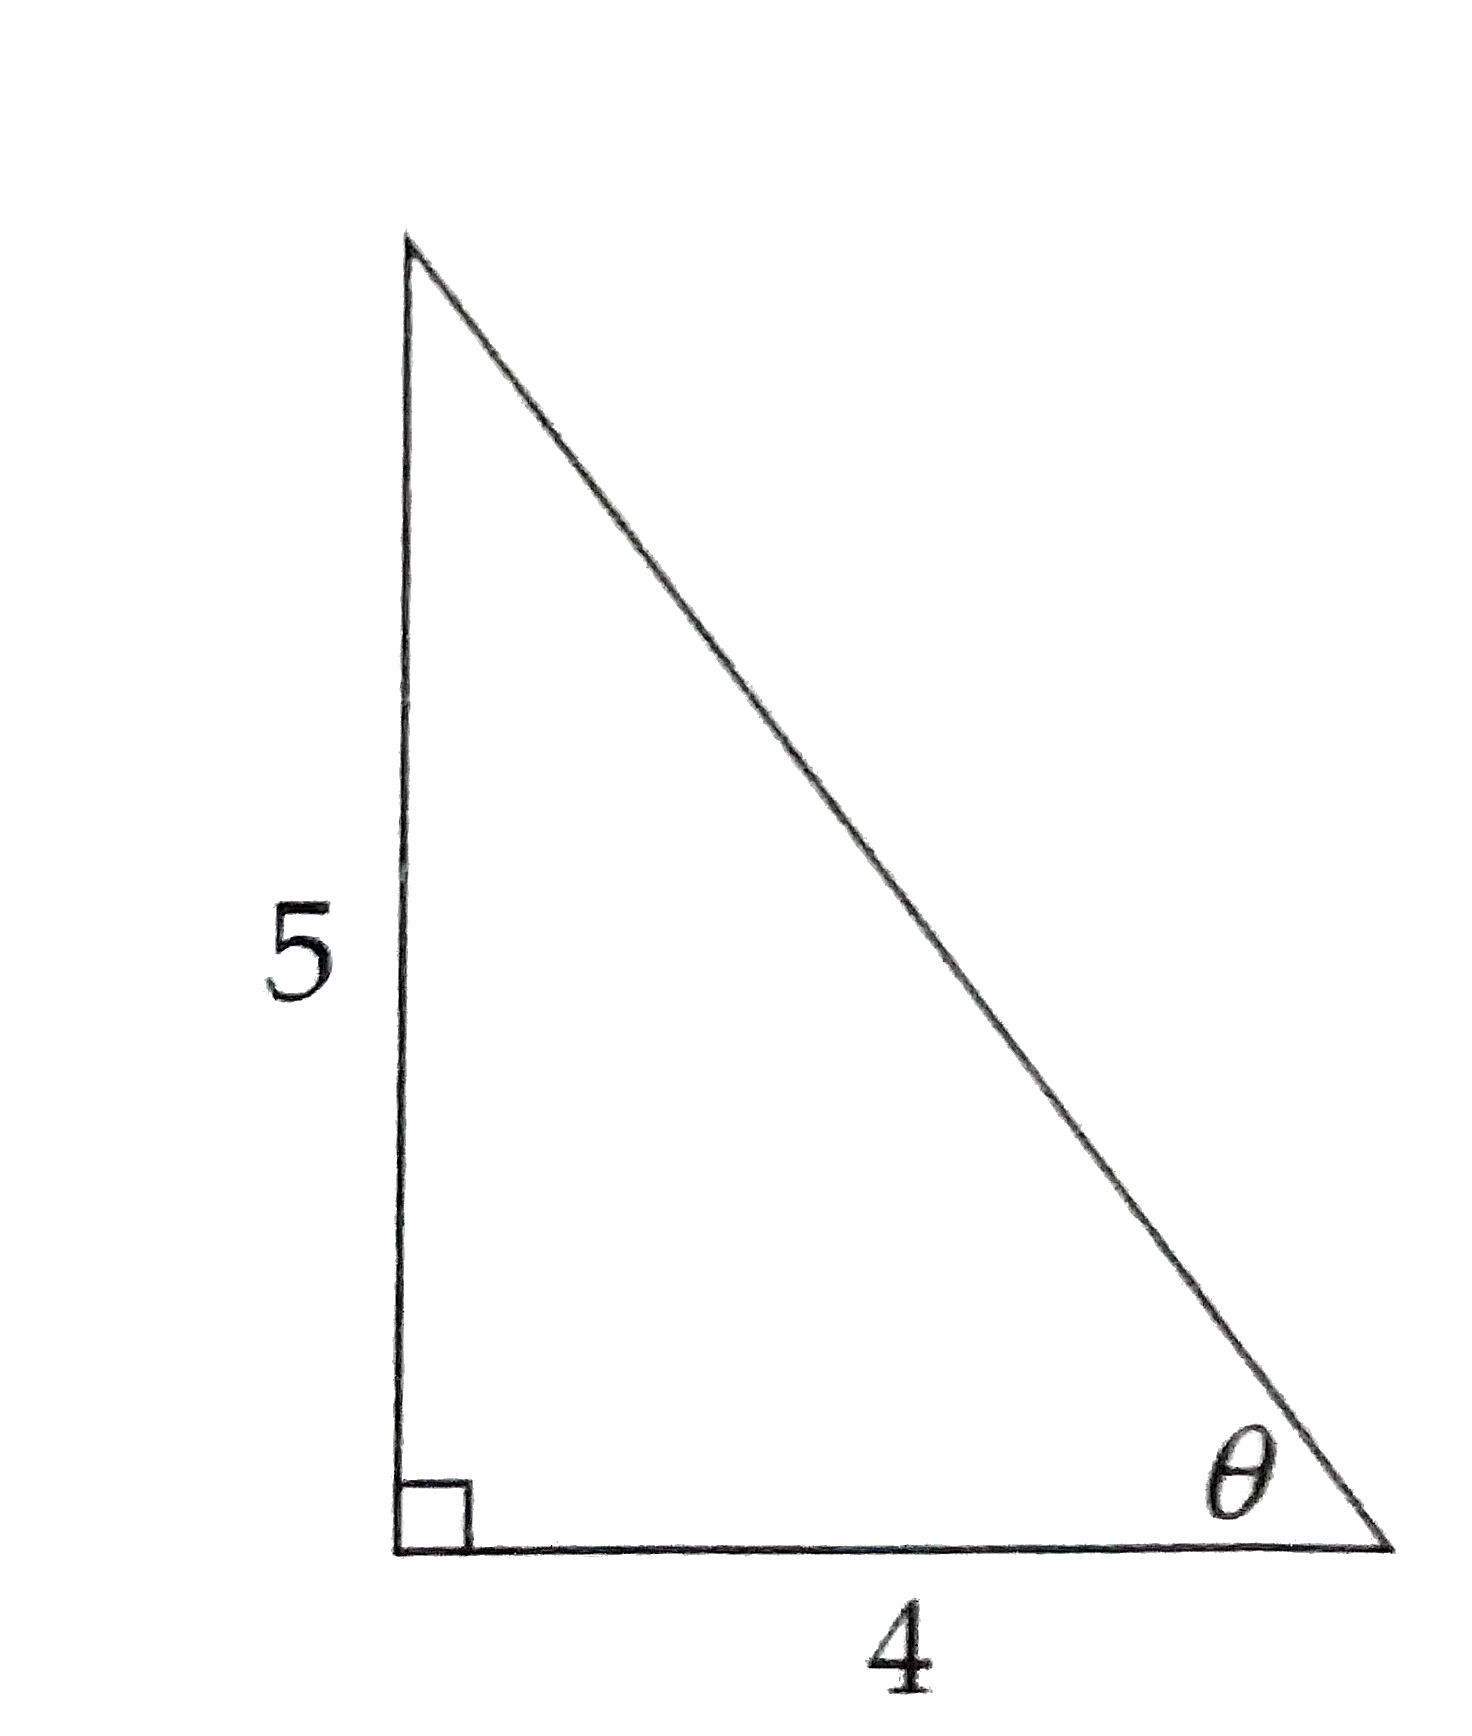
What is the value of θ ?

View SolutionDetermine the point of symmetry of a regular hexagon.
View SolutionDtermine the images of the following figure about the given line :
View SolutionMatch the following Column A to Column B

View SolutionMatch the following Column A to Column B

View SolutionMatch the following Column A to Column B

View SolutionFind the area of figure given below.

View SolutionFind the area of the figure given below.

View SolutionCalculate the volume of the given solid.
ltimg src="https://d10lpgp6xz60nq.cloudfront.net/physics_images/PS_MATH_VII_C06_E03_002_Q01.png" width="80%"gt
View SolutionThe area of the shaded part in the figure given below is ______.

View SolutionThe inequation represented by the graph given below is :
View SolutionThe inequation that best describes the graph given below is _________
View SolutionThe inequation that best describes the following graph is _________
View SolutionWhich inequations represent the shaded region in the given figure
View SolutionMatch the items given in column A and B: ltimg src="https://d10lpgp6xz60nq.cloudfront.net/physics_images/NCERT_BIO_XII_C16_E01_004_Q01.png" width="80%"gt
View Solution
