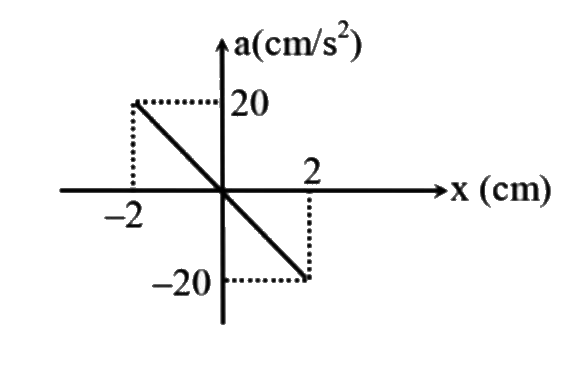
Acceleration-displacement graph of a particle executing SHM Is as shown in given figure. The time period of its oscillation is: (in sec)

A
π2
B
2π
C
π
D
π4
Text Solution
The correct Answer is:B
|
Topper's Solved these Questions
Similar Questions
Knowledge Check
Acceleration -displacemnet graph of a particle executing SHM is as shown in given figure. The time period of its oscillations is (in s)
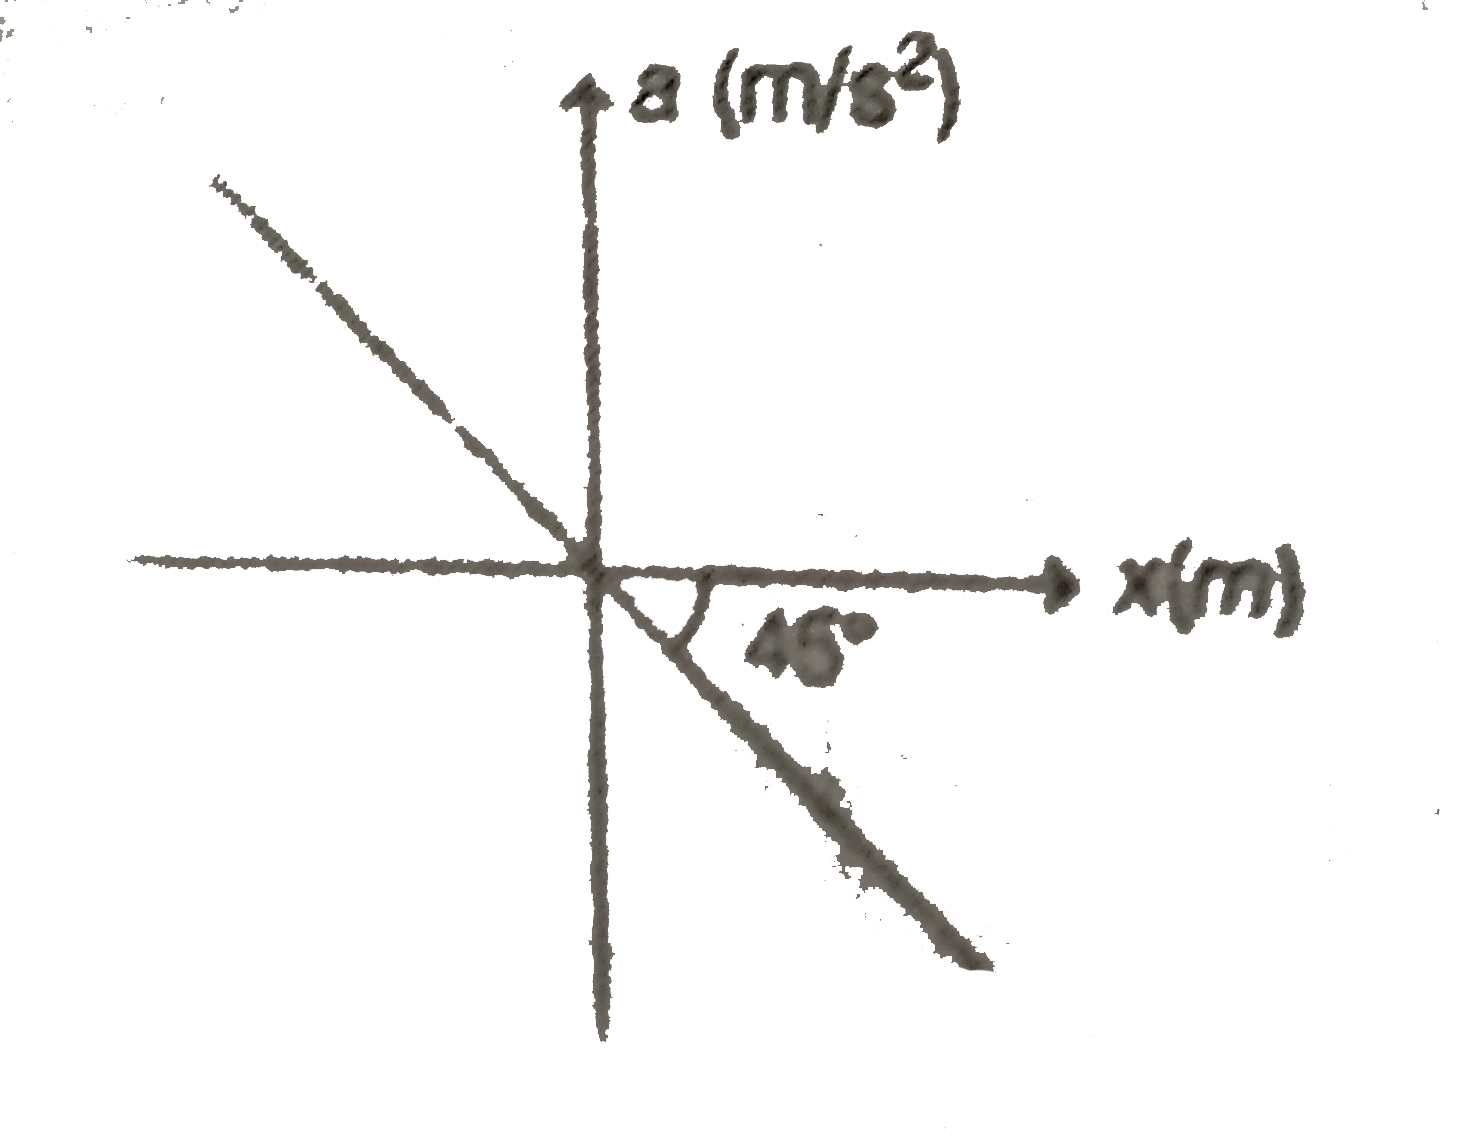 Aπ2B2piCpiDπ4
The acceleration versus displacement graph of a particle performing SHM is shown in figure. The time period of oscillation of particle in second is
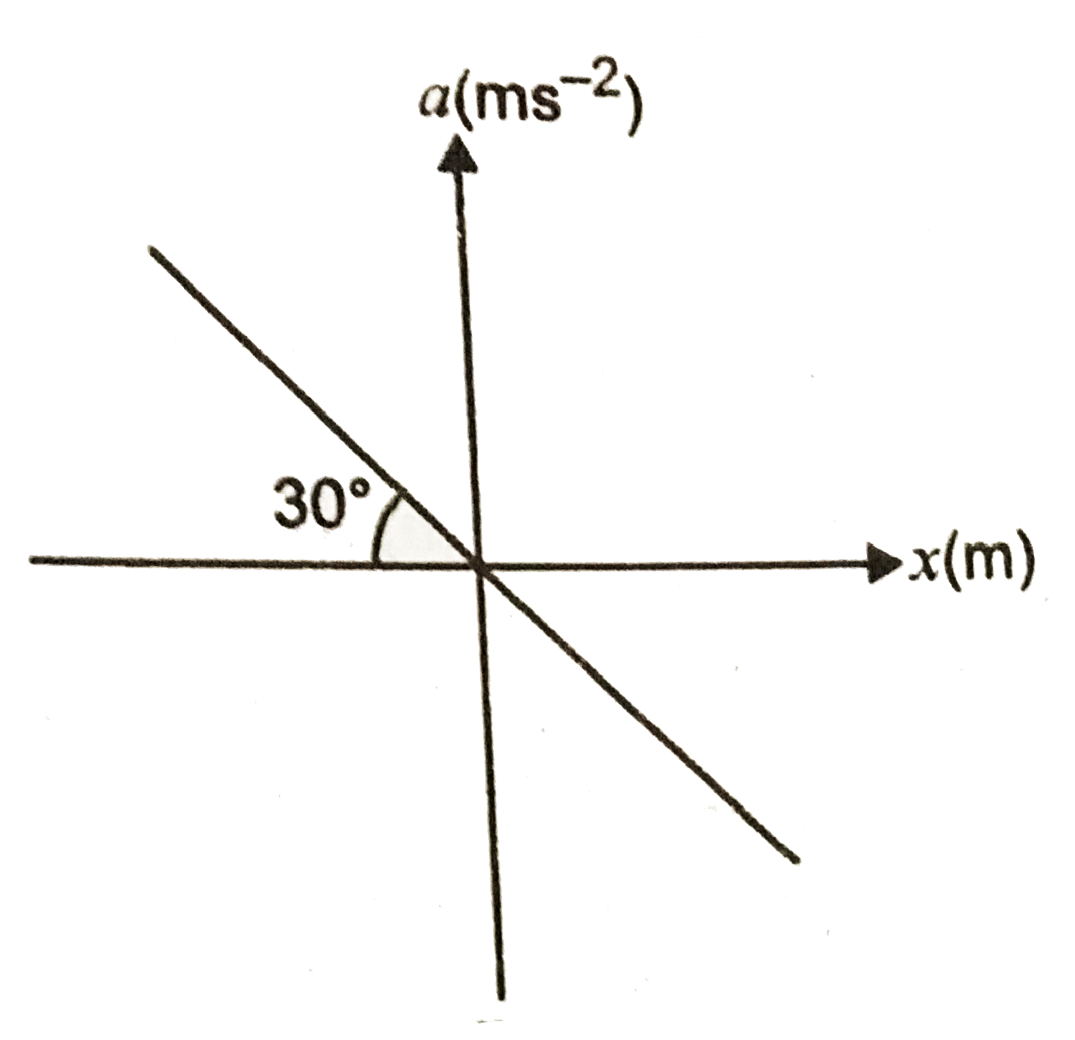 A2π×√2B2π×√3C2π×(2)1/4D2π×(3)1/4
The acceleration-displacement graph of a particle executing SHM is as shown in the figure. The velocity of the particle at y = 0 is (take tan14∘ = 0.25)
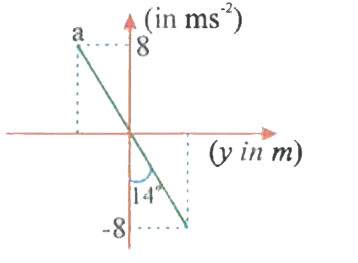 A1 ms−1B2 ms−1C4 ms−1D8 ms−1
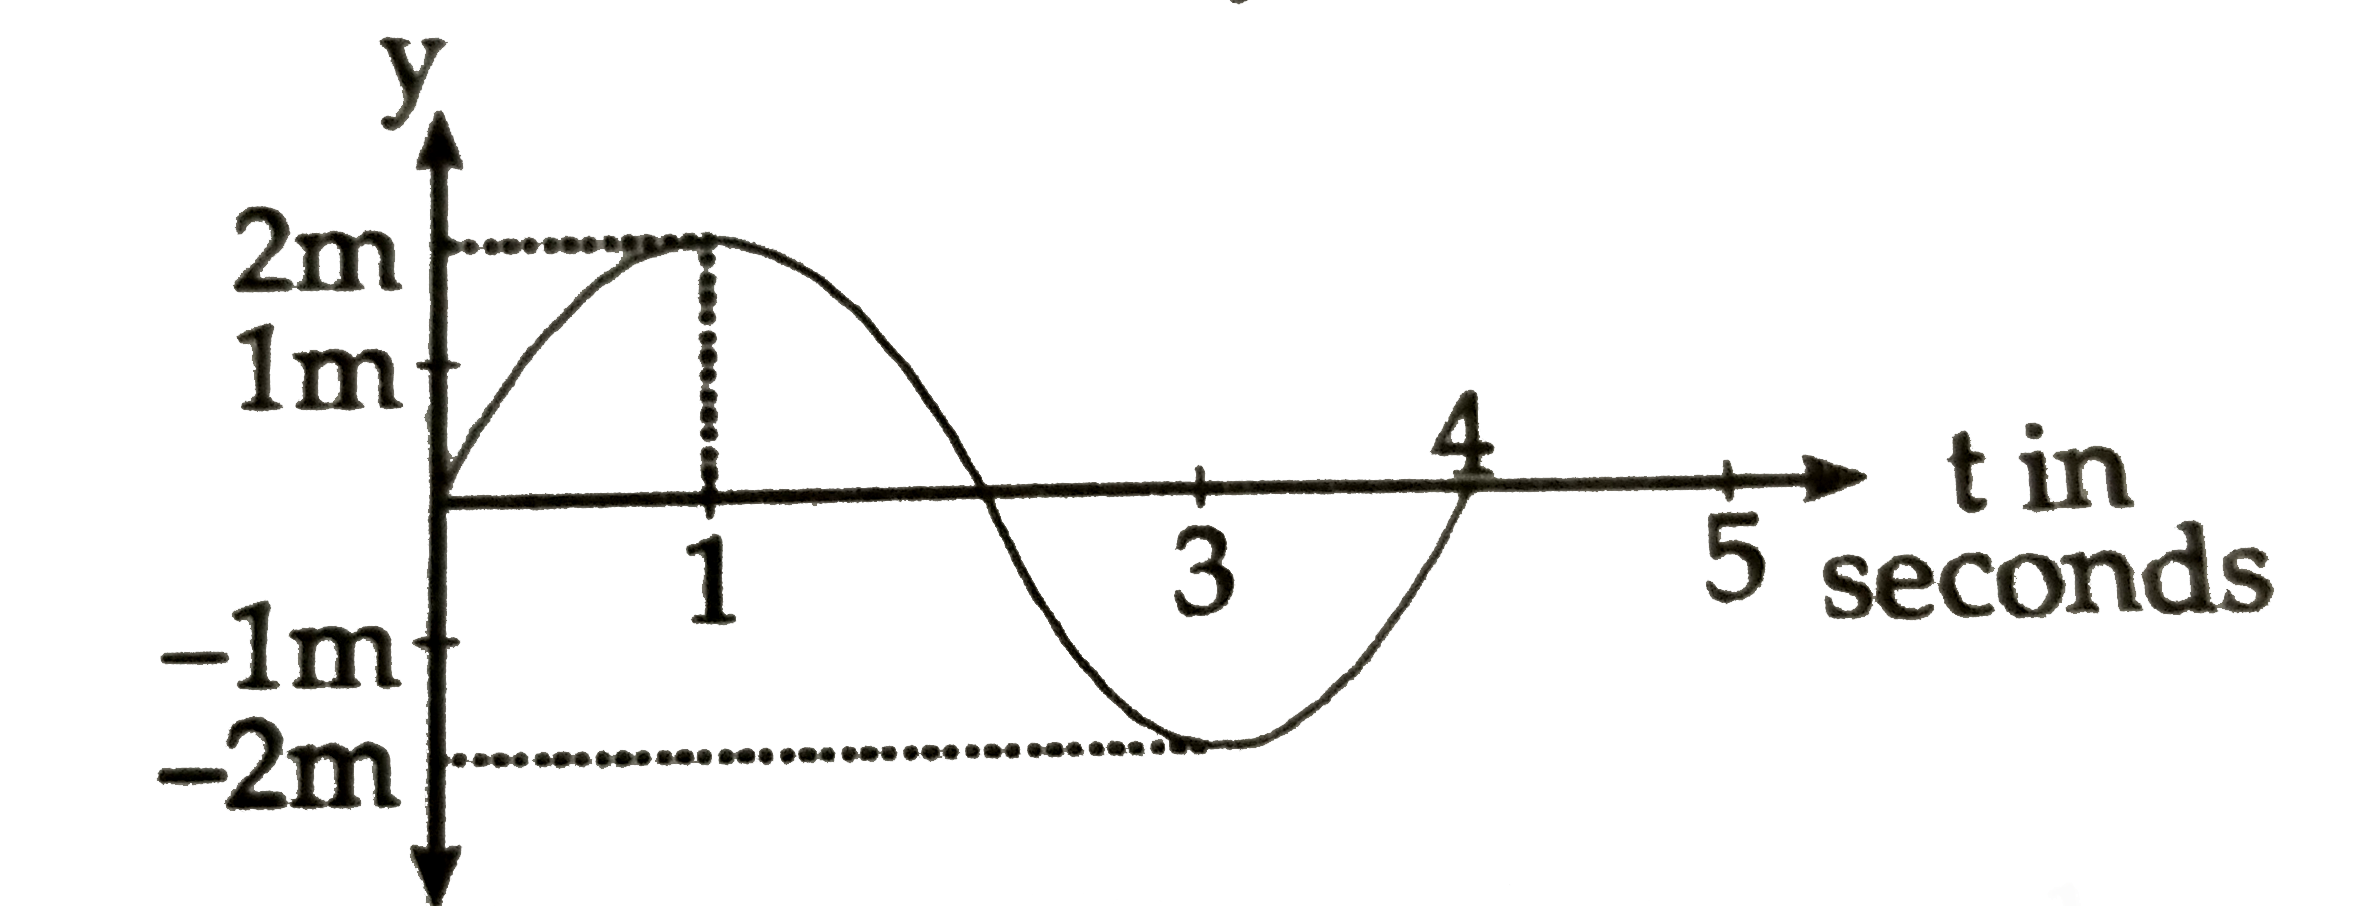
The displacement - time graph of a particle executing SHM is as shown in the figure. The maximum velocity of the particle is
View SolutionThe acceleration-displacement graph of a particle executing simple harmonic motion is shown in the figure. The frequency of oscillation is
View SolutionThe acceleration-displacement graph of a particle executing simple harmonic motion is shown in the figure. The frequency of oscillation is

View SolutionThe acceleration displacement graph of a particle executing simple harmonic motion is shown in figure. The time period of simple harmonic motion is
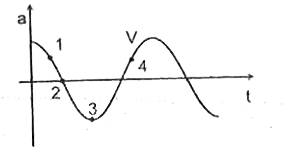
View SolutionAcceleration time graph of a particle executing SHM is as shown in the figure. Select the correct alternative (s)
View Solution
