The graph shows the change 'Δl' in the length of a thin uniform wire used by the application of force F at different temperatures T1 and T2. The variation suggests that
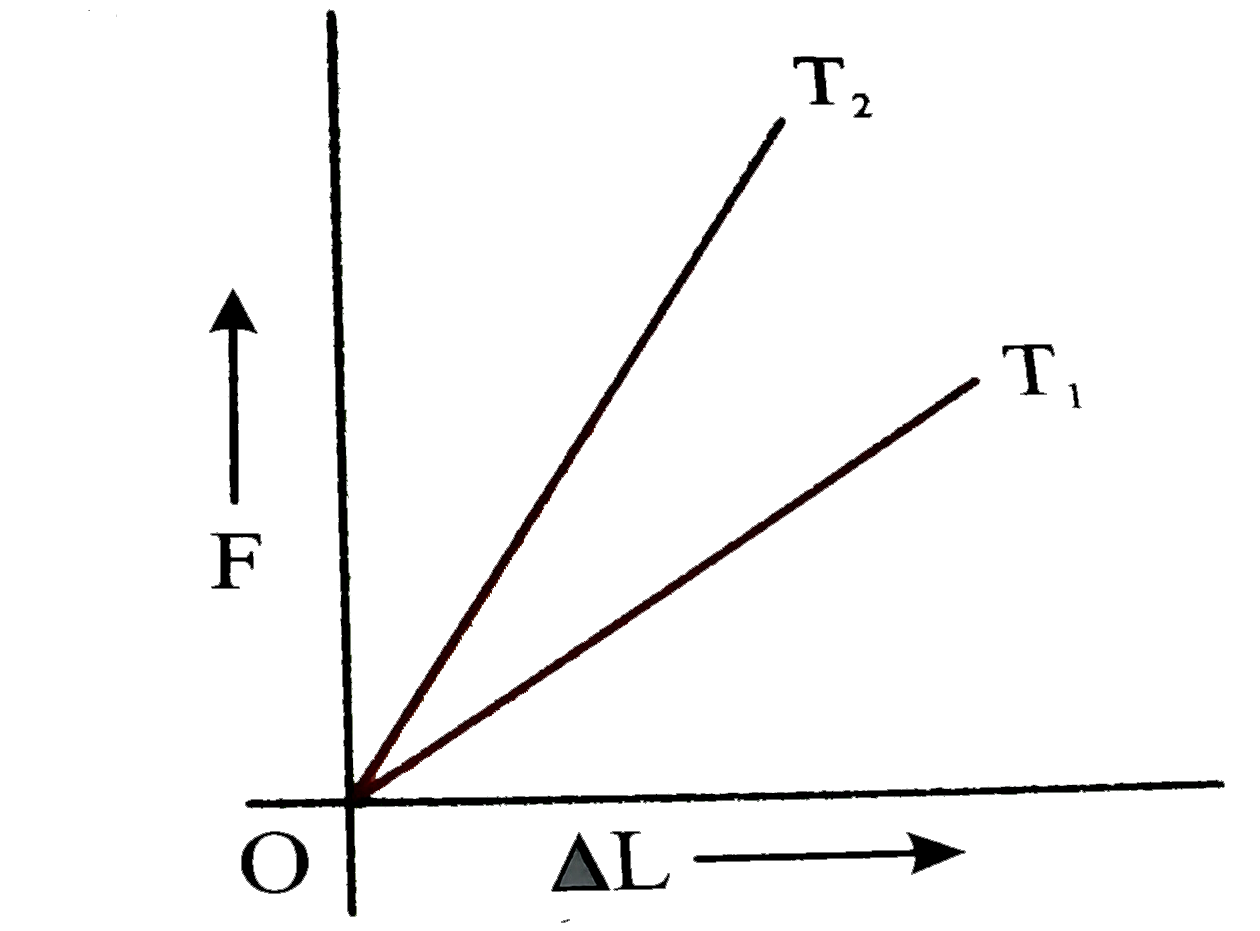
T1>T2
T1<T2
T2>T1
T1≥T2
Step by step video & image solution for The graph shows the change 'Delta l' in the length of a thin uniform wire used by the application of force F at different temperatures T_(1) and T_(2). The variation suggests that by Physics experts to help you in doubts & scoring excellent marks in Class 11 exams.
Updated on:21/07/2023Topper's Solved these Questions
Similar Questions
Knowledge Check
The diagram shows the change x in the length of the uniform wire caused by the application of stres F at two different temperatures T and T. The variations shown suggest that
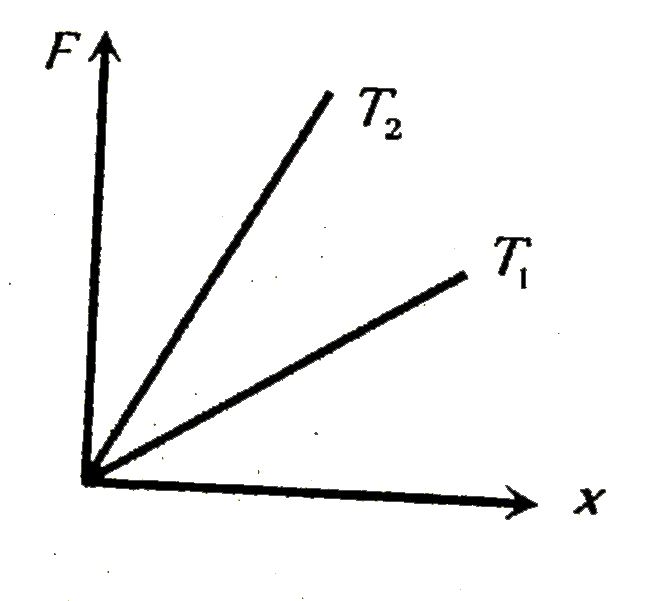 AT1>T2BT1<T2CT1=T2DNone of these
The figure shows the variation of V with i at temperatures T1 and T2. Then T1−T2 is proportional to
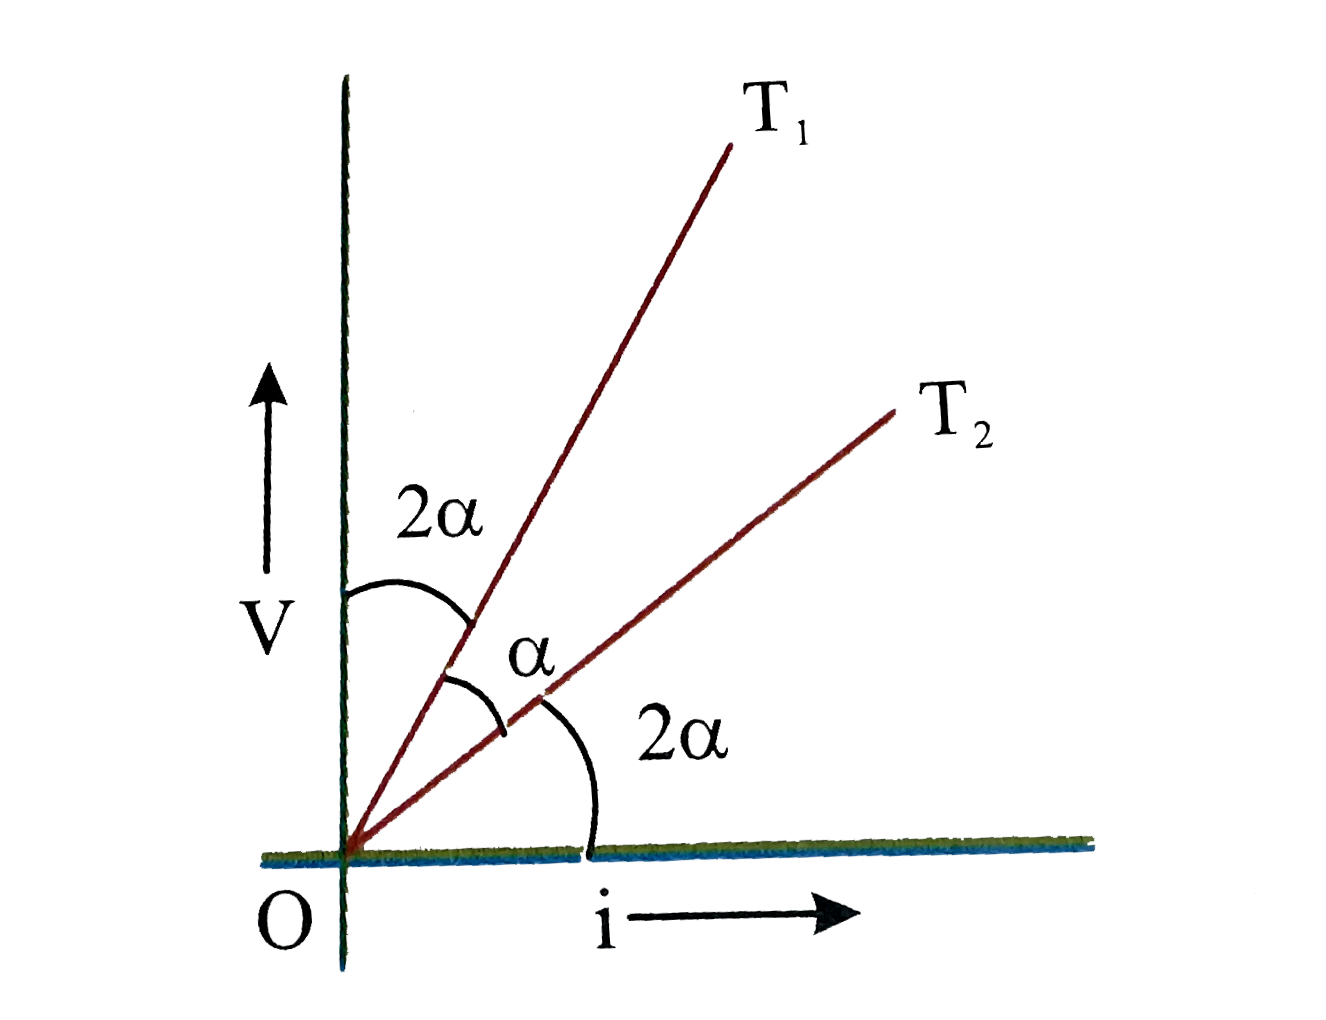 Atan2αBtanαCsinαDcos2α
The current (I) and voltage (V) graphs for a given metallic wire at two different temperature (T1) and (T2) are shown in fig. It is concluded that
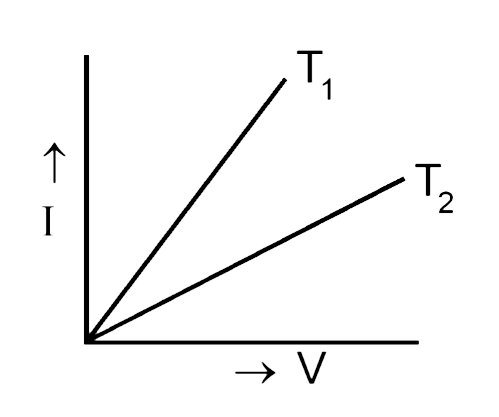 AT1=T2BT1>T2CT1<T2DNone of these
The current - voltage graphs for a given metallic wire at two different temperatures T1andT2 are shown in the figure.
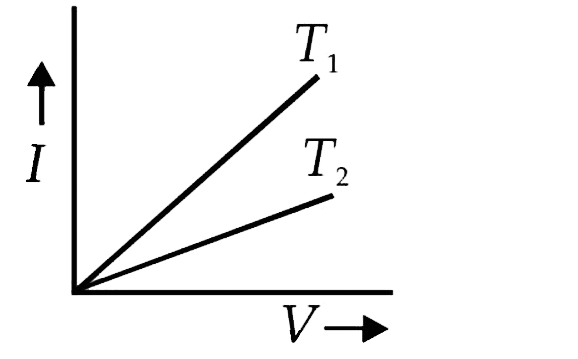
The temperature T2 is greater than T1.
View SolutionThe current (I) and voltage (V) graphs for a given metallic wire at two different temperature (T1) and (T2) are shown in fig. It is concluded that

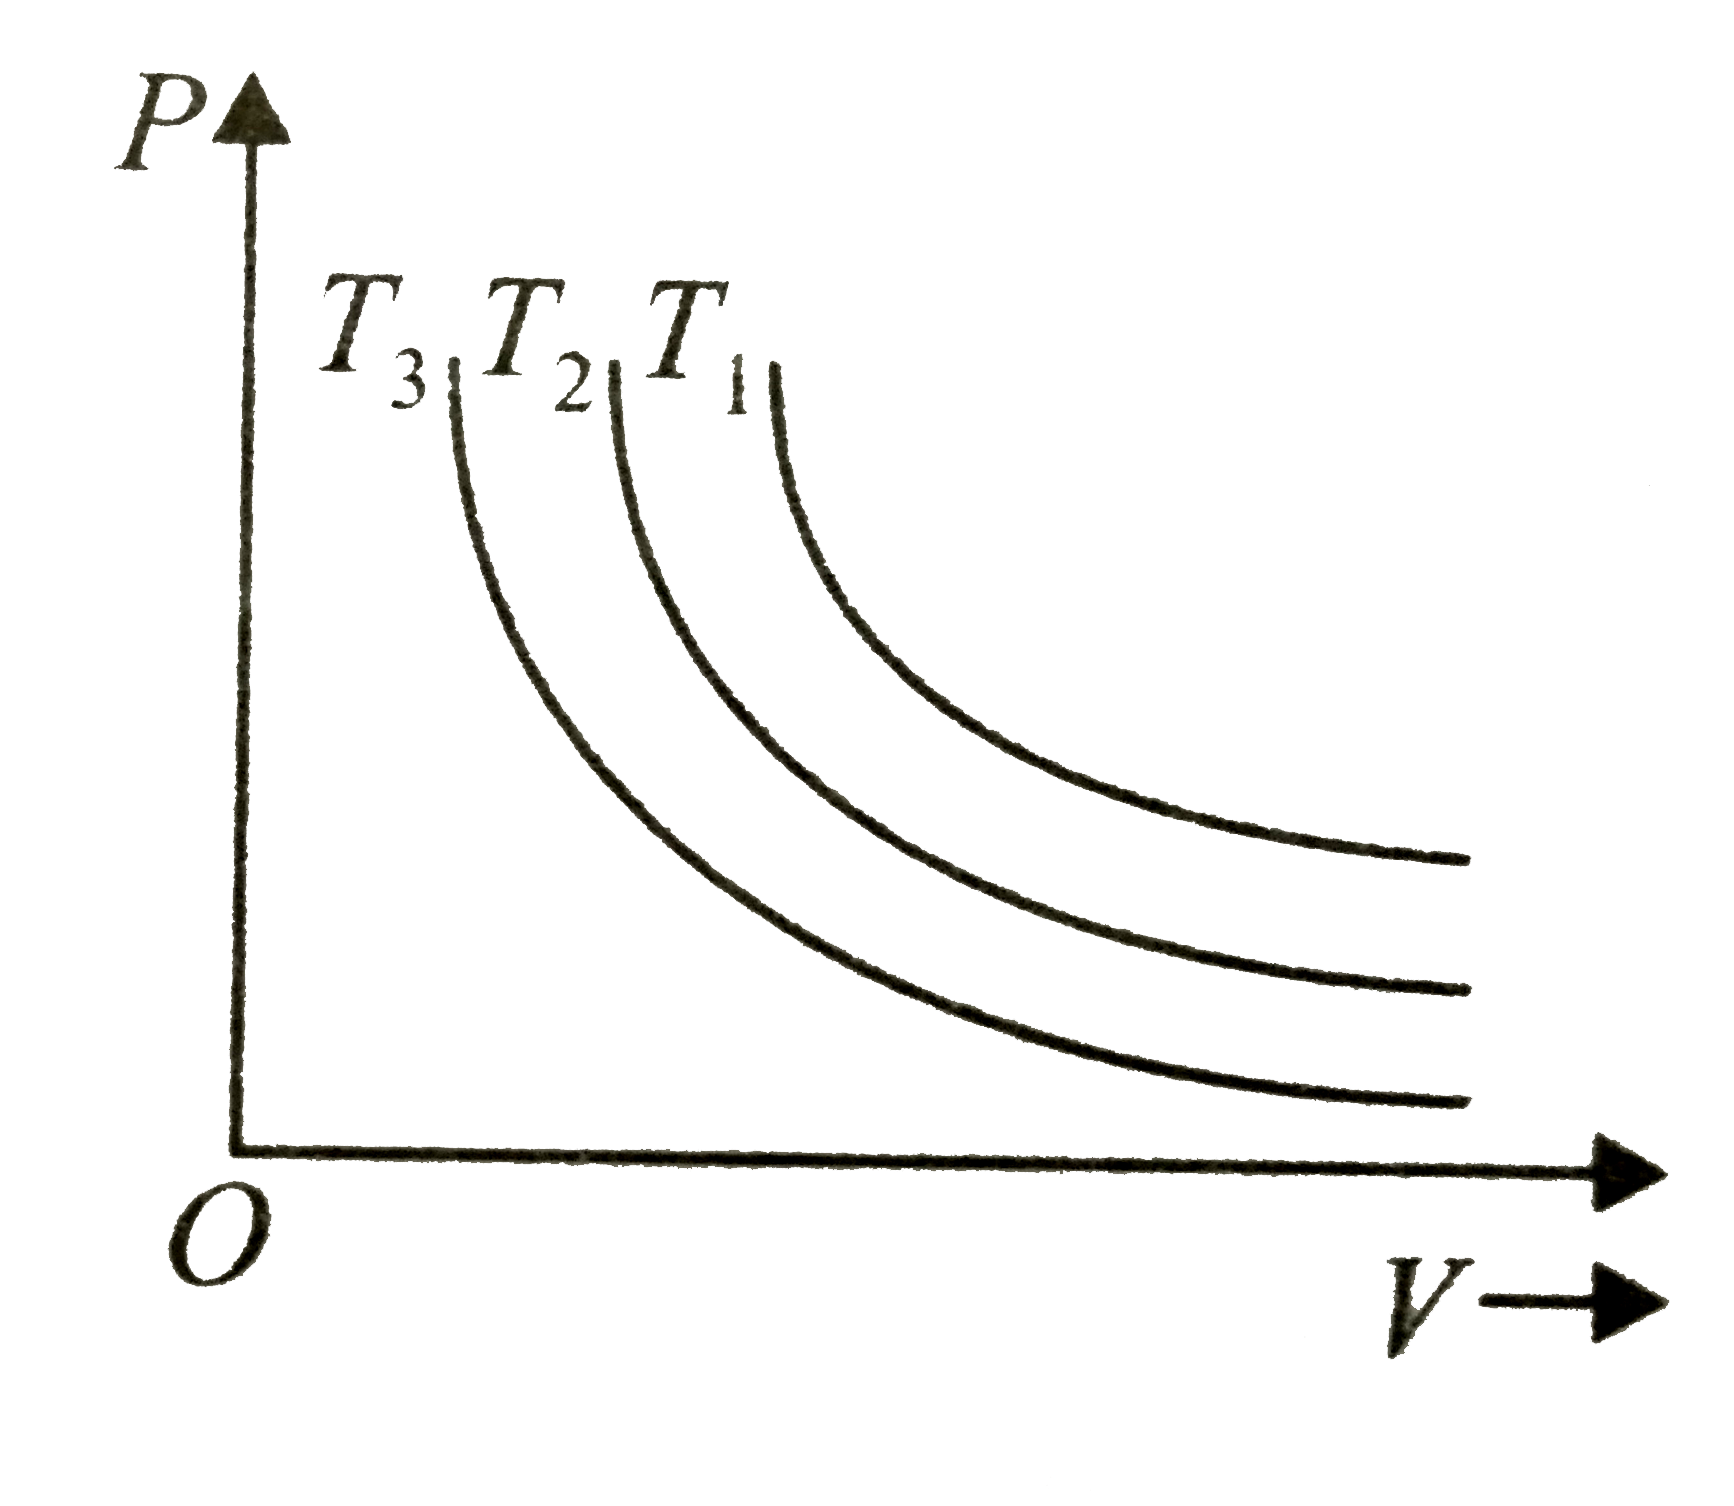
View SolutionThe isothermal diagram of a gas at three different temperatures T1,T2and_(3), is show in the given figure .Then
View SolutionFigure shows graphs of pressure vs density for an ideal gas at two temperatures Tt and T2
View SolutionThe voltage V and current I v graphs for a conductor at two different temperatures T1andT2 are shown in the figure. The relation between T1andT2 is

View Solution
