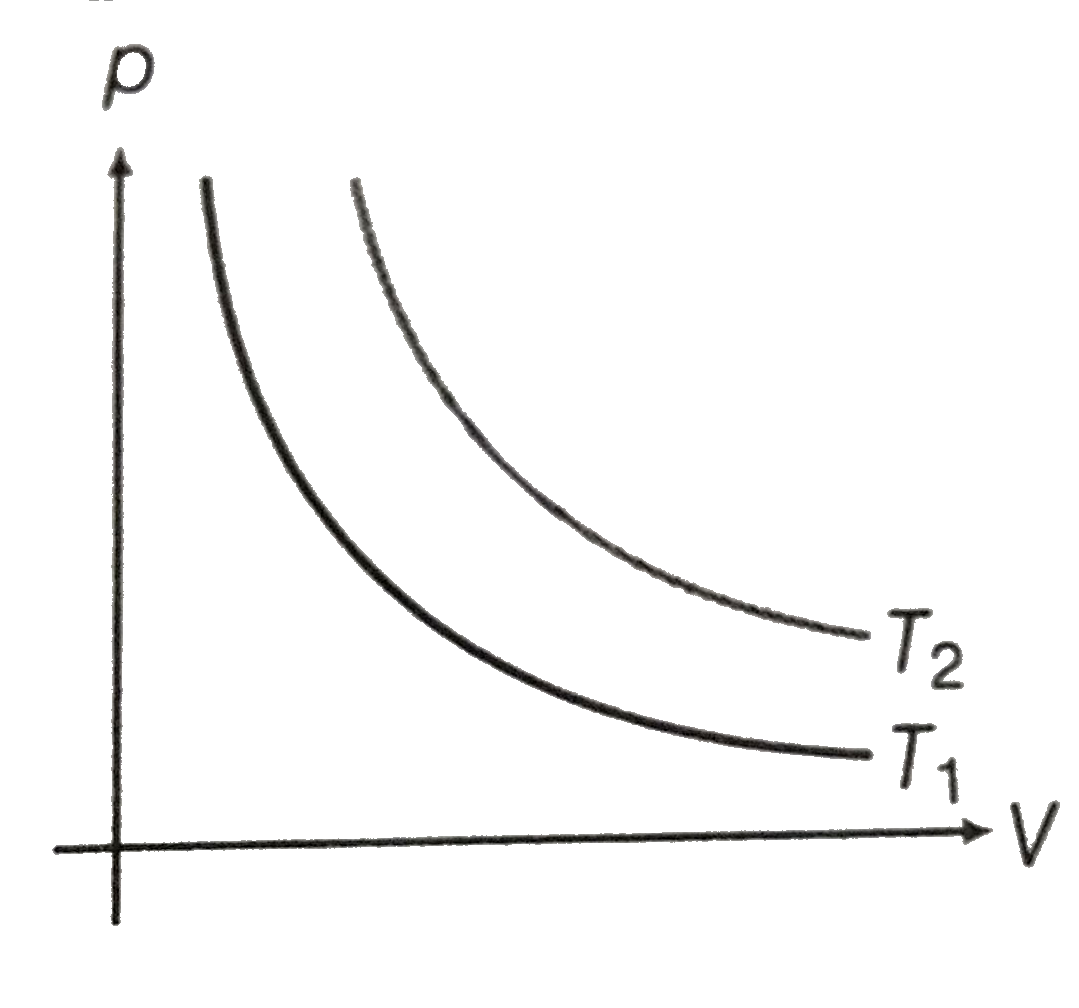
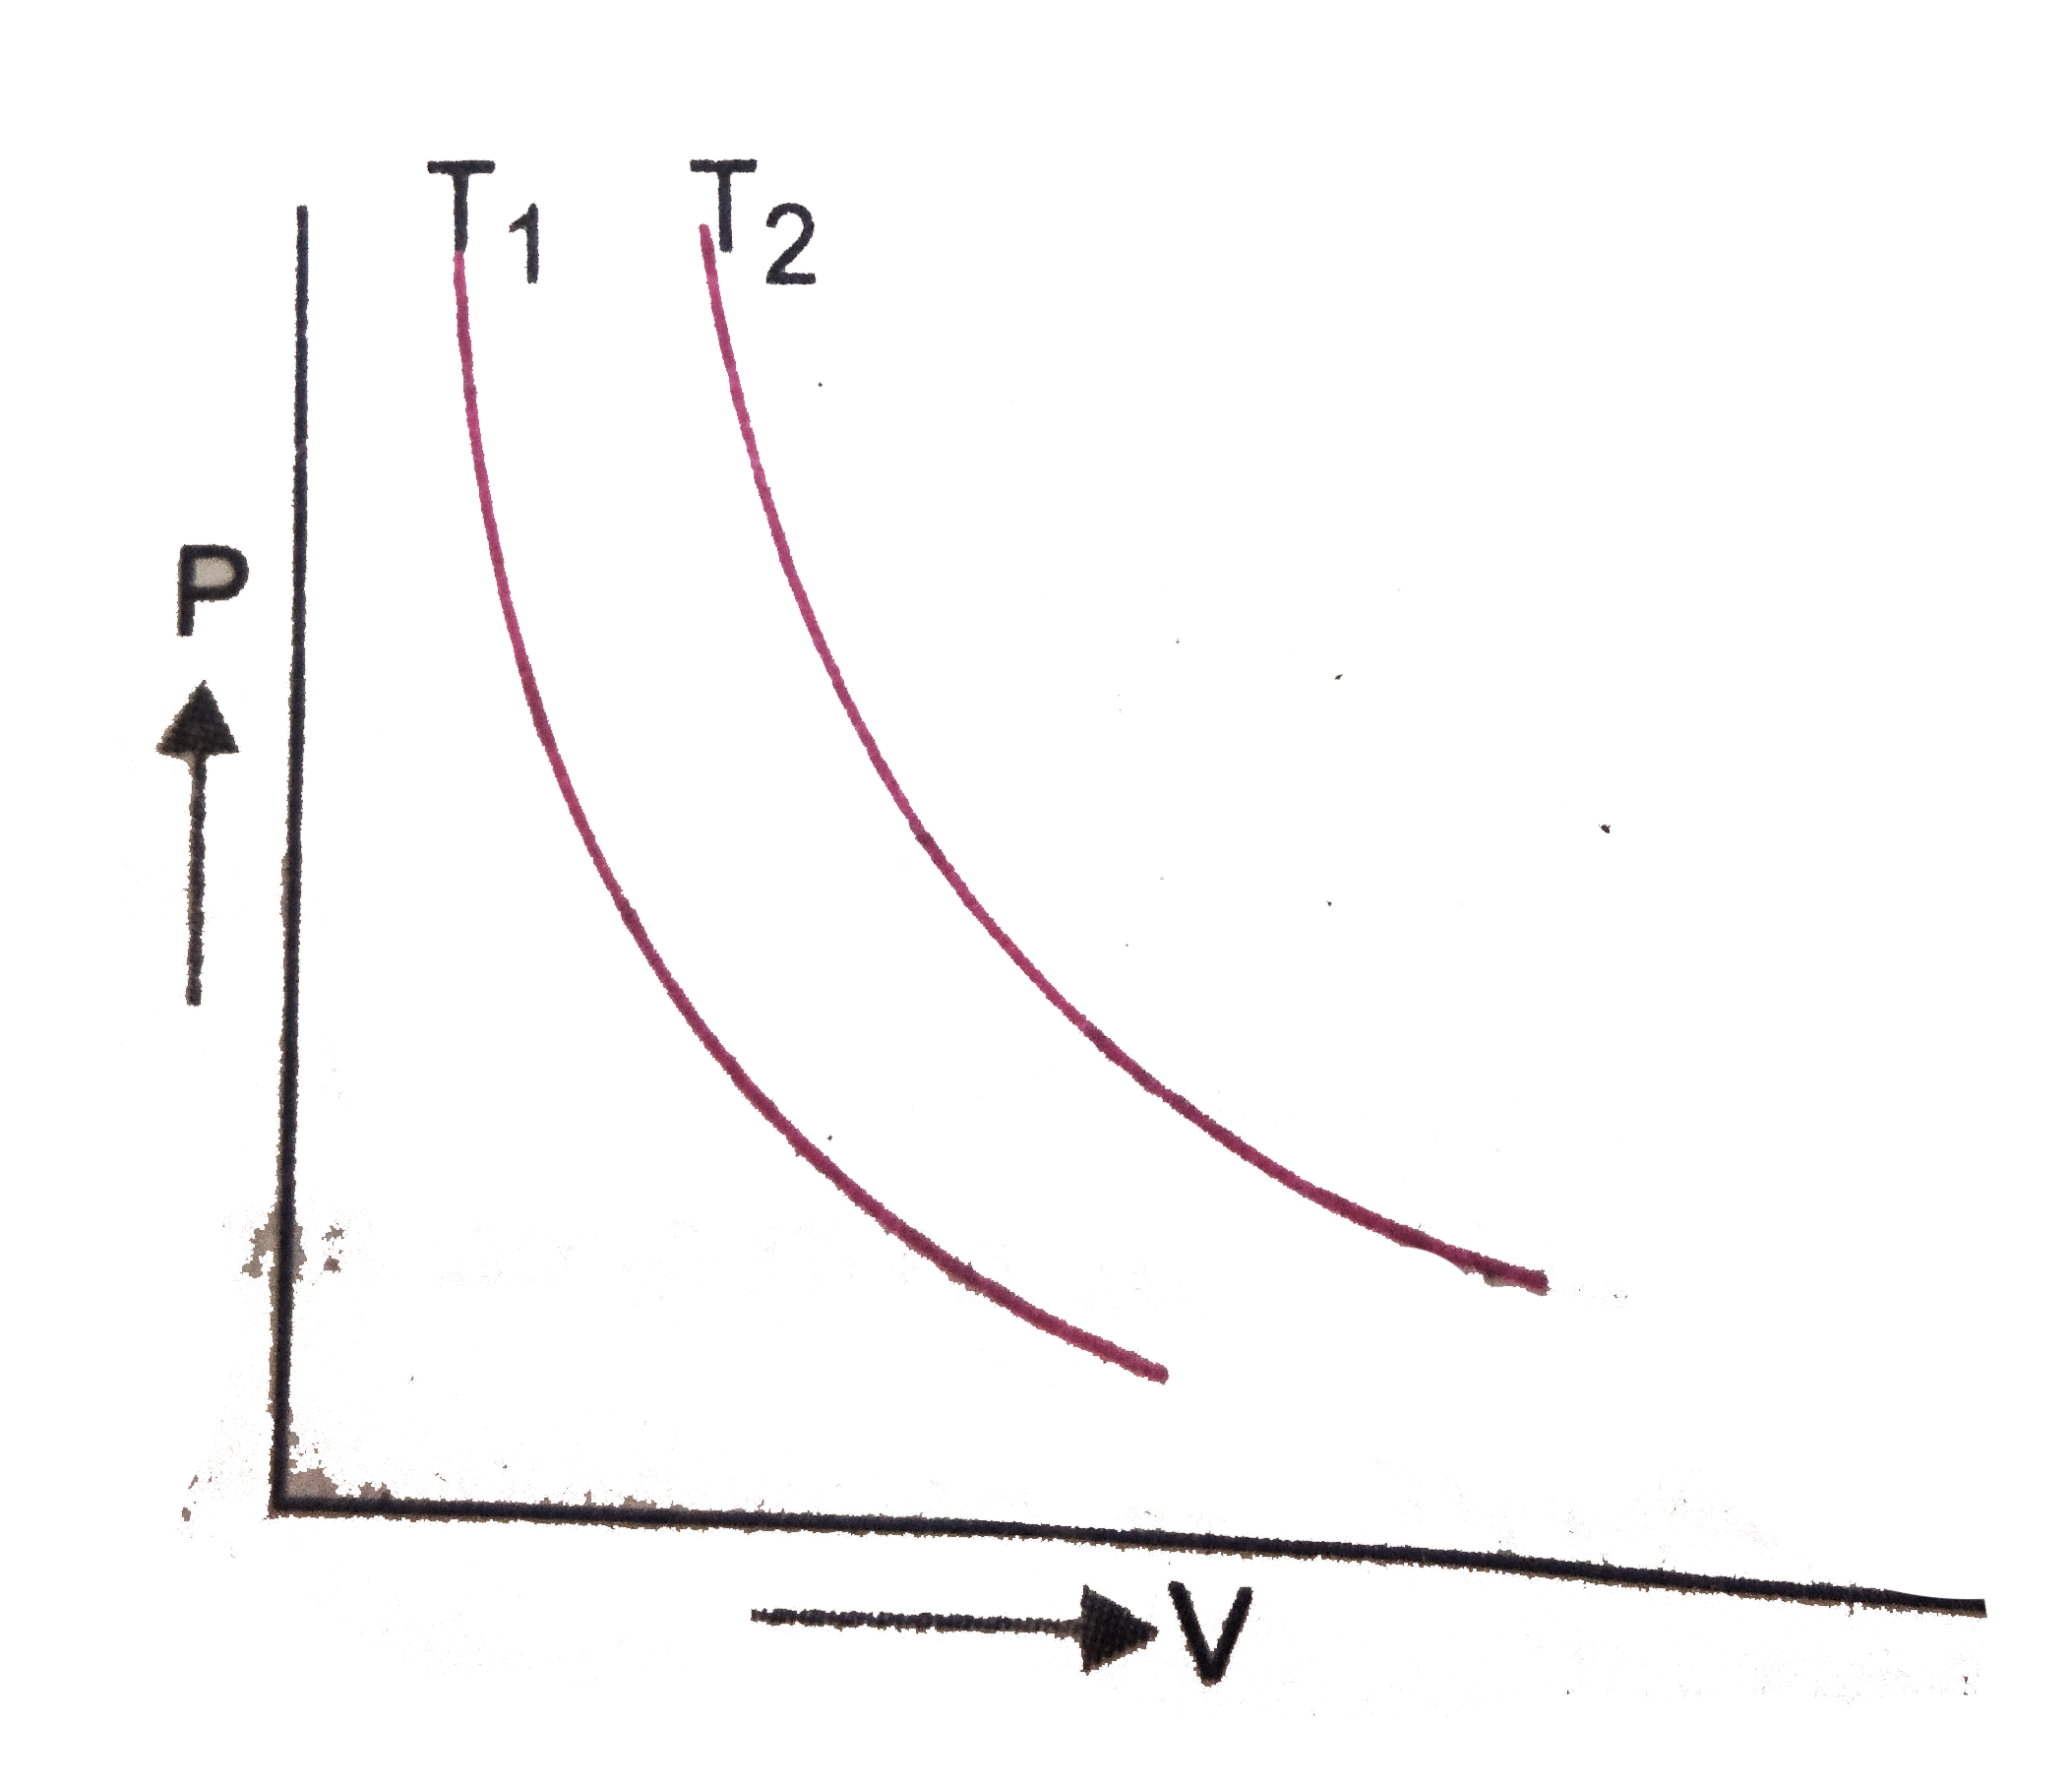
The graph of vs P at two different temperature and is [where ]
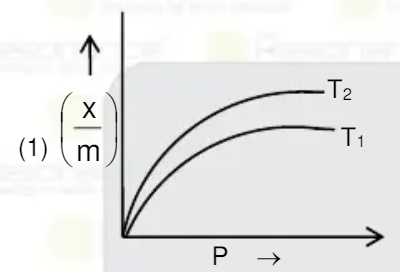
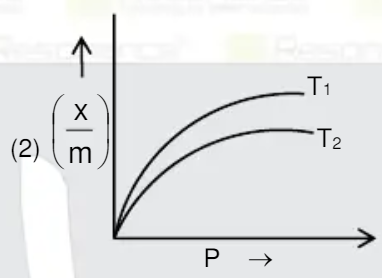
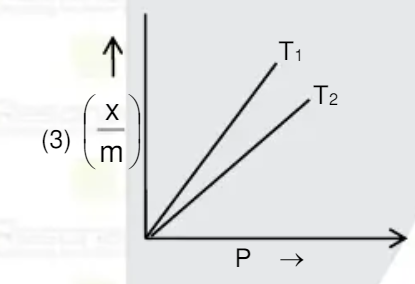
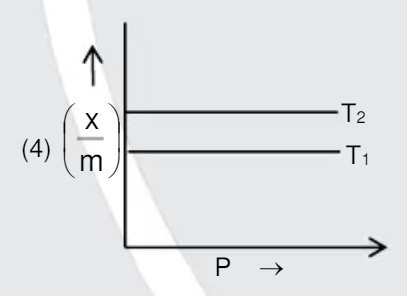
To solve the question regarding the graph of (x/m) vs P at two different temperatures T1 and T2 (where T1>T2), we need to analyze the relationship between temperature and the extent of adsorption.
1. Understanding the Variables:
- x is the amount of gas adsorbed.
- m is the mass of the adsorbent.
- P is the pressure of the gas.
- The term (x/m) represents the extent of adsorption.
2. Effect of Temperature on Adsorption:
- As temperature increases, the kinetic energy of the molecules also increases. This leads to a greater tendency for adsorbed molecules to escape from the surface of the adsorbent.
- Therefore, the extent of adsorption decreases with an increase in temperature.
3. Comparison of Temperatures:
- Given that T1>T2, we can conclude that:
- At temperature T1, the extent of adsorption (x/m) will be lower compared to that at temperature T2.
- Thus, for a given pressure P, the graph for T1 will lie below the graph for T2.
4. Analyzing the Graphs:
- We need to identify the graph where the curve for T2 is above the curve for T1.
- The correct graph will show that as pressure P increases, the extent of adsorption (x/m) for T2 is greater than that for T1.
5. Conclusion:
- Based on the above analysis, the correct option will be the one where the curve corresponding to T2 is positioned higher than that of T1 on the graph of (x/m) vs P.
- x is the amount of gas adsorbed.
- m is the mass of the adsorbent.
- P is the pressure of the gas.
- The term (x/m) represents the extent of adsorption.
- As temperature increases, the kinetic energy of the molecules also increases. This leads to a greater tendency for adsorbed molecules to escape from the surface of the adsorbent.
- Therefore, the extent of adsorption decreases with an increase in temperature.
- Given that T1>T2, we can conclude that:
- At temperature T1, the extent of adsorption (x/m) will be lower compared to that at temperature T2.
- Thus, for a given pressure P, the graph for T1 will lie below the graph for T2.
- We need to identify the graph where the curve for T2 is above the curve for T1.
- The correct graph will show that as pressure P increases, the extent of adsorption (x/m) for T2 is greater than that for T1.
- Based on the above analysis, the correct option will be the one where the curve corresponding to T2 is positioned higher than that of T1 on the graph of (x/m) vs P.
Similar Questions
Knowledge Check
Assertion : Current versus potential difference (i-V) graph for a conductor at two different temperatures T1 and T2 is shown in figure. Hence T1>T2.
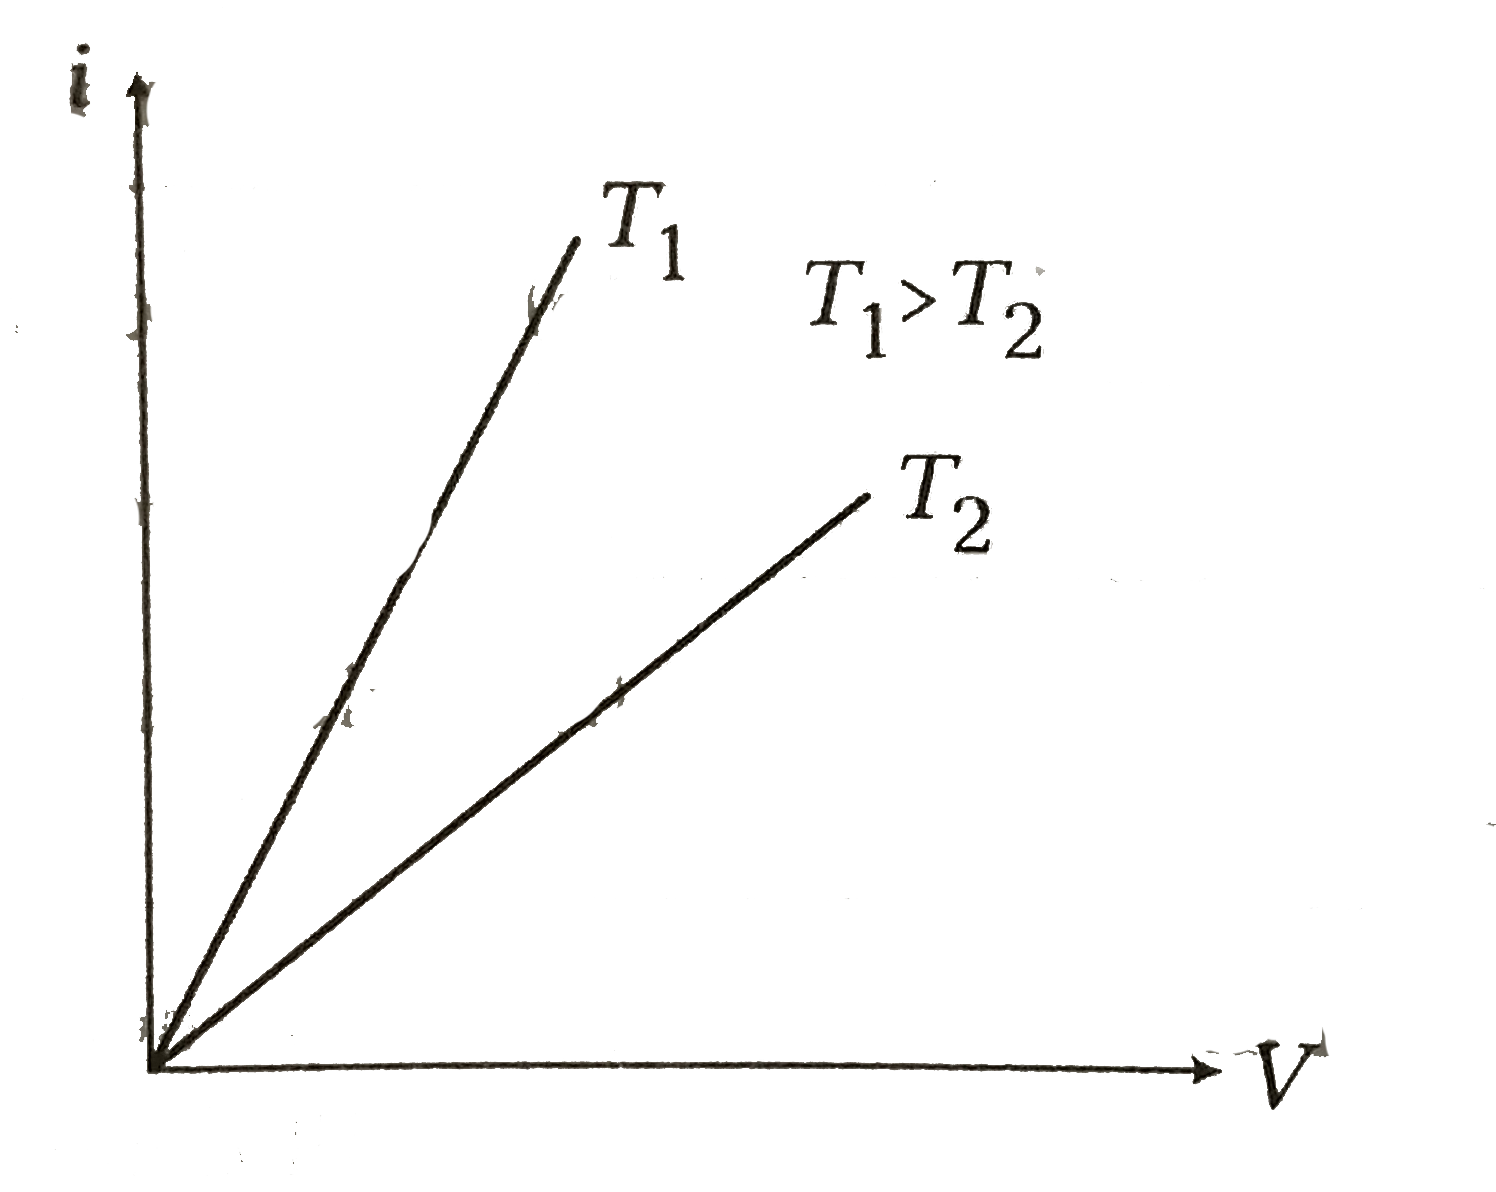
Reason : Resistance of a conductor increases with rise in temperature.AIf both Assertion and Reason are true and Reason is the correct explanation of Assertion.BIf both Assertion and Reason are true and Reason is not correct explanation of Assertion.CIf Assertion is true but Reason is false.DIf Assertion is false but Reason is true.The voltage V and current I v graphs for a conductor at two different temperatures T1andT2 are shown in the figure. The relation between T1andT2 is
 AT1>T2BT1<T2CT1=T2DT1=1T2
V- I graph for a metallic wire at two different temperature T1 and T2 is shown in figure. Which of the two temperature is higher and why?
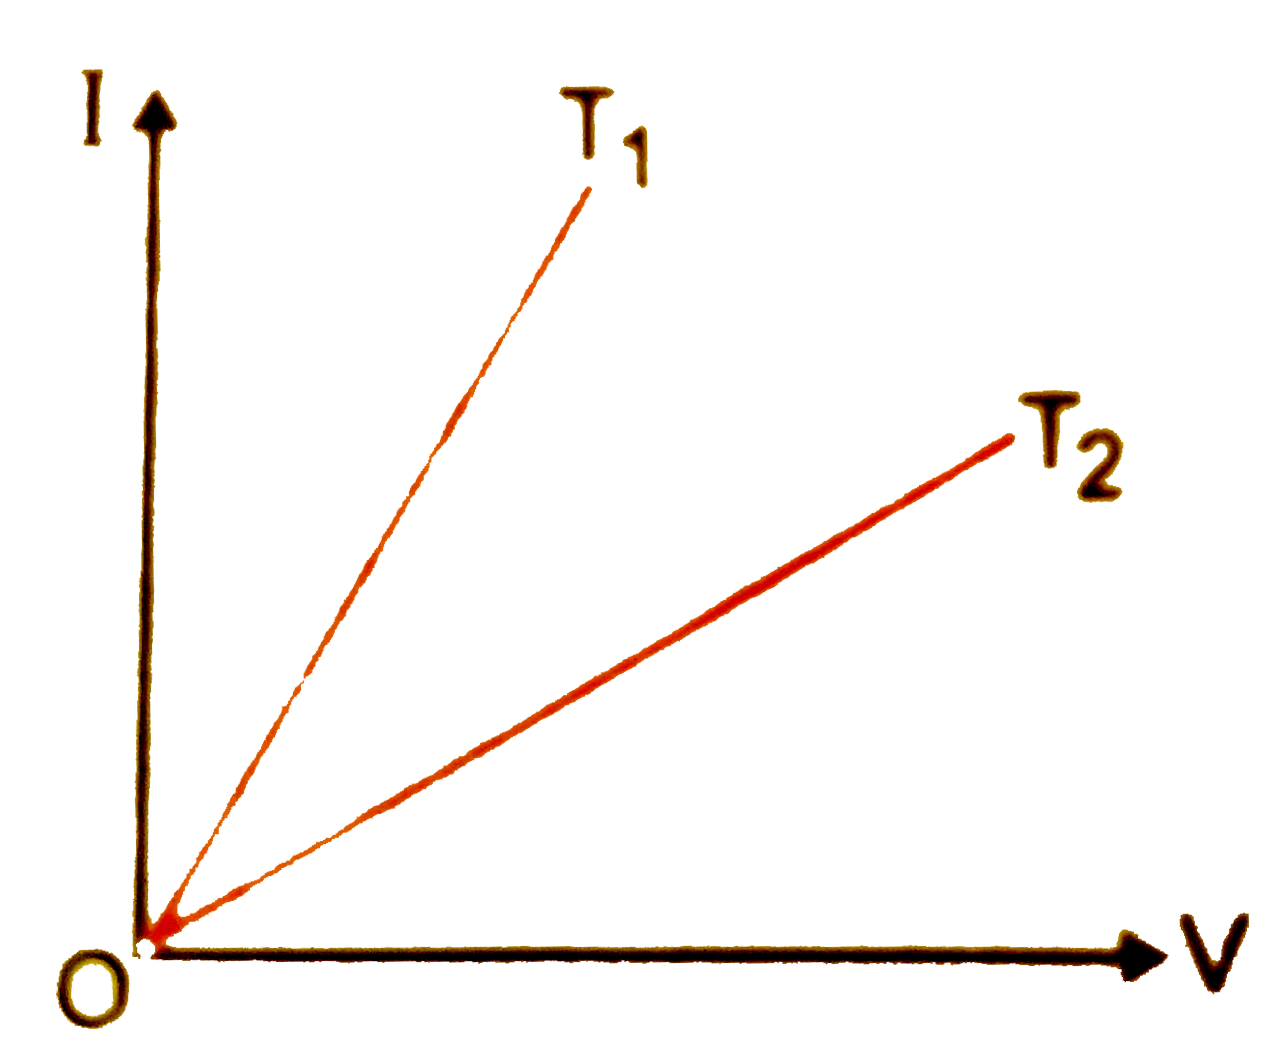
View SolutionThe voltage-current (V-I) graph of a metallic conductor at two different temperature T1 and T2 is shown in figure. At which temperature is the resistance higher?
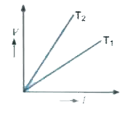
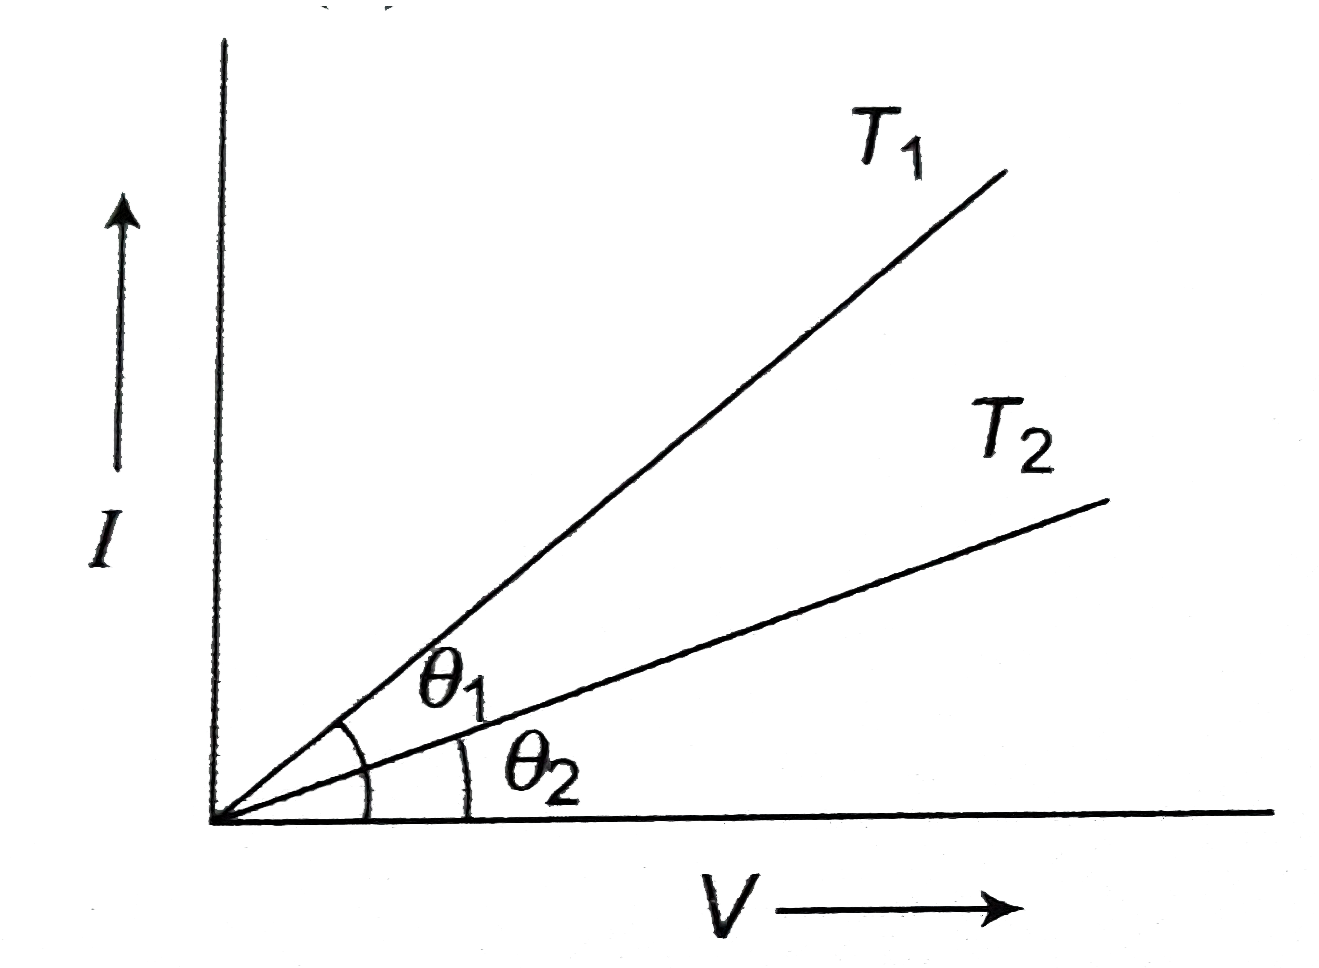
View SolutionThe current-voltage graph for a given speciment at two different temperatures T1 and T2 are shown in the figure. Is the specimen ohmic ?
(b) At which temperature resistance is greater ?
( c) Which temperature is higher ?
 .
.
View SolutionThe stress-strain graph for a metallic wire is shown at two different temperature, T1 and T2 which temperature is high T1 or T2 ?
View SolutionThe current - voltage graphs for a given metallic wire at two different temperatures T1andT2 are shown in the figure.
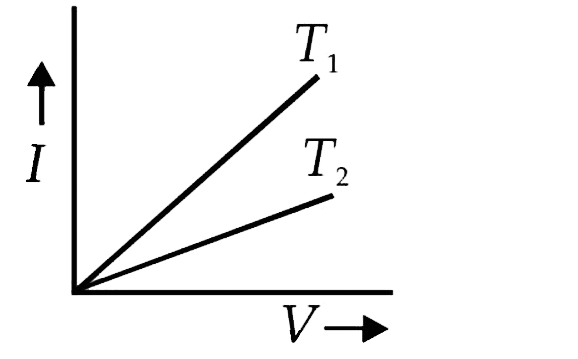
The temperature T2 is greater than T1.
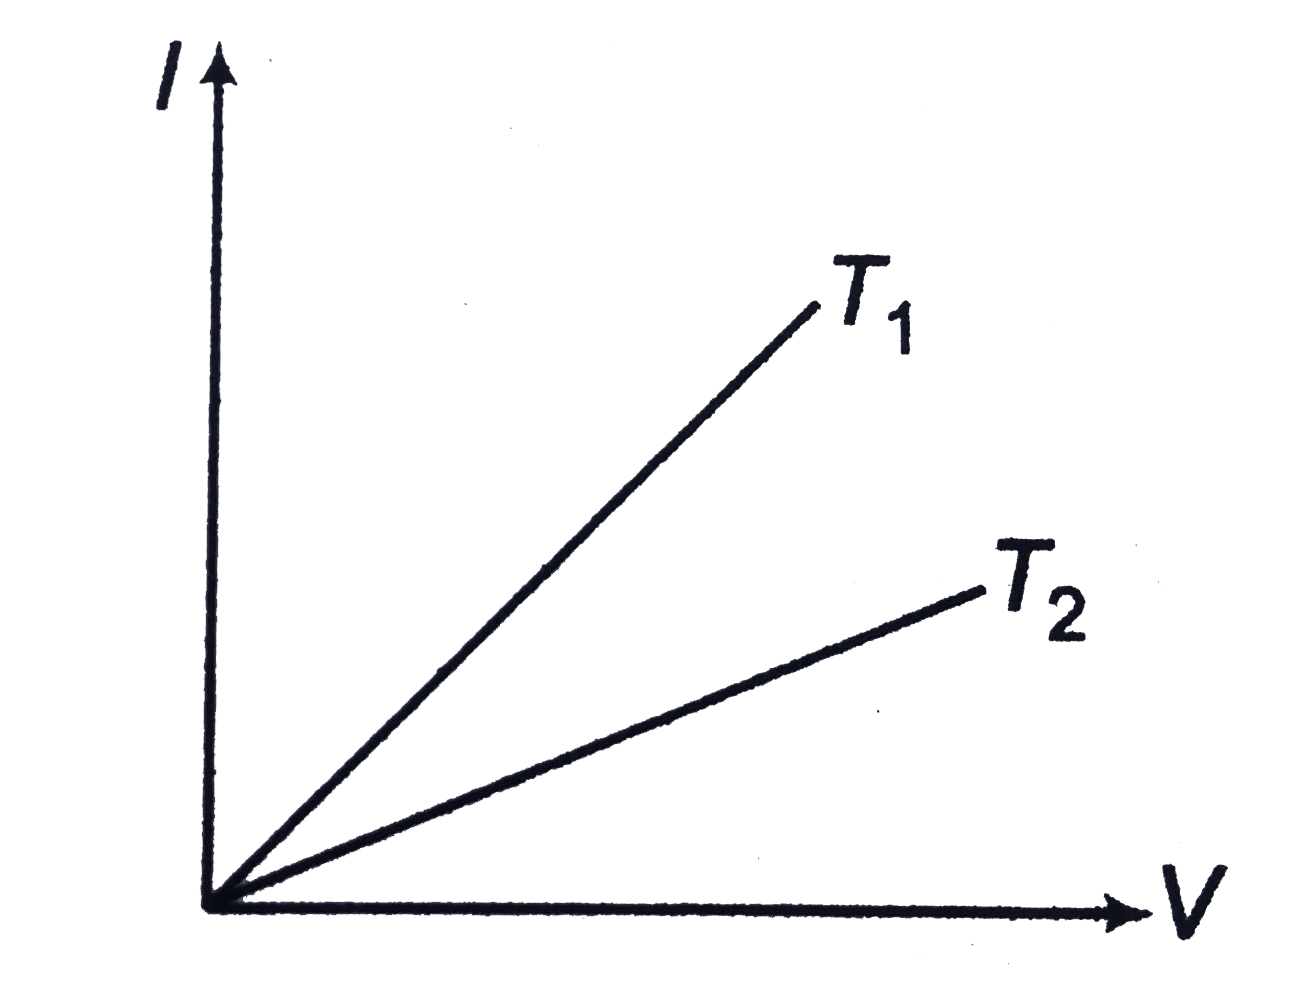
View SolutionThe current voltage graphs for a given metalic wire two different temperature T1 and T2 are shown in figure The temperature T2 is greater than T1. Is this statement true or false?
View Solution

