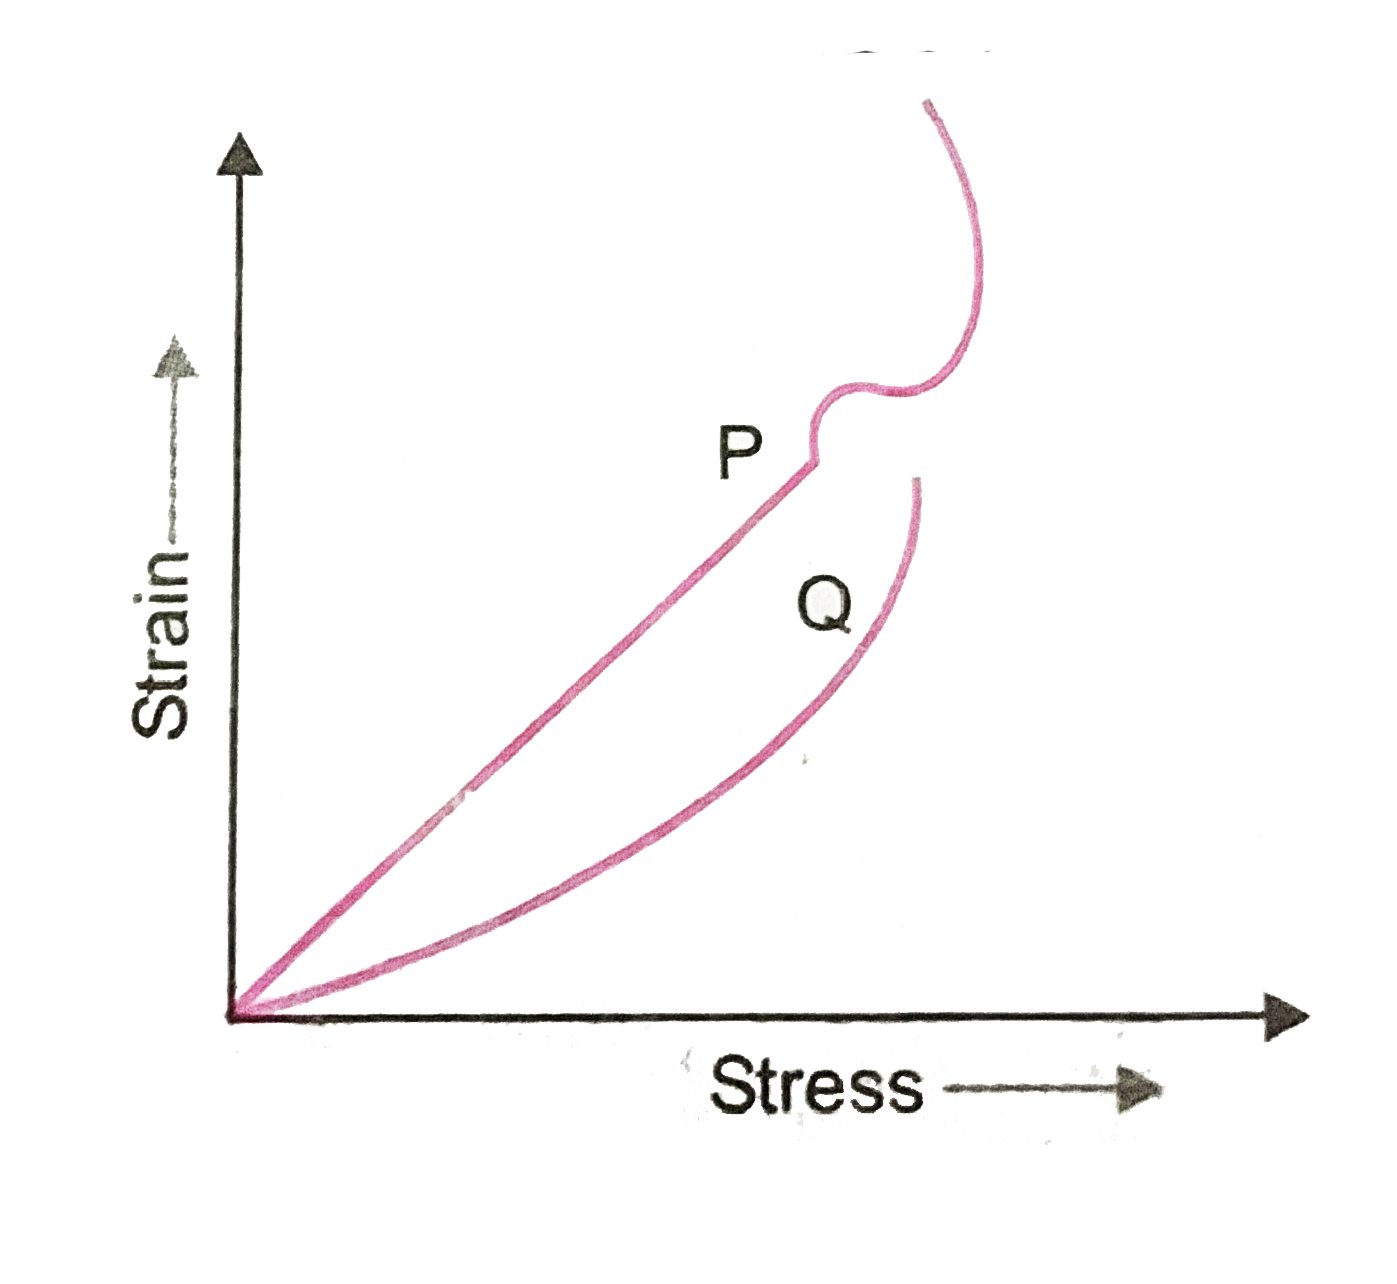
Figure shows the stress-strain curve of two metals P and Q. From the graph, it can be concluded that
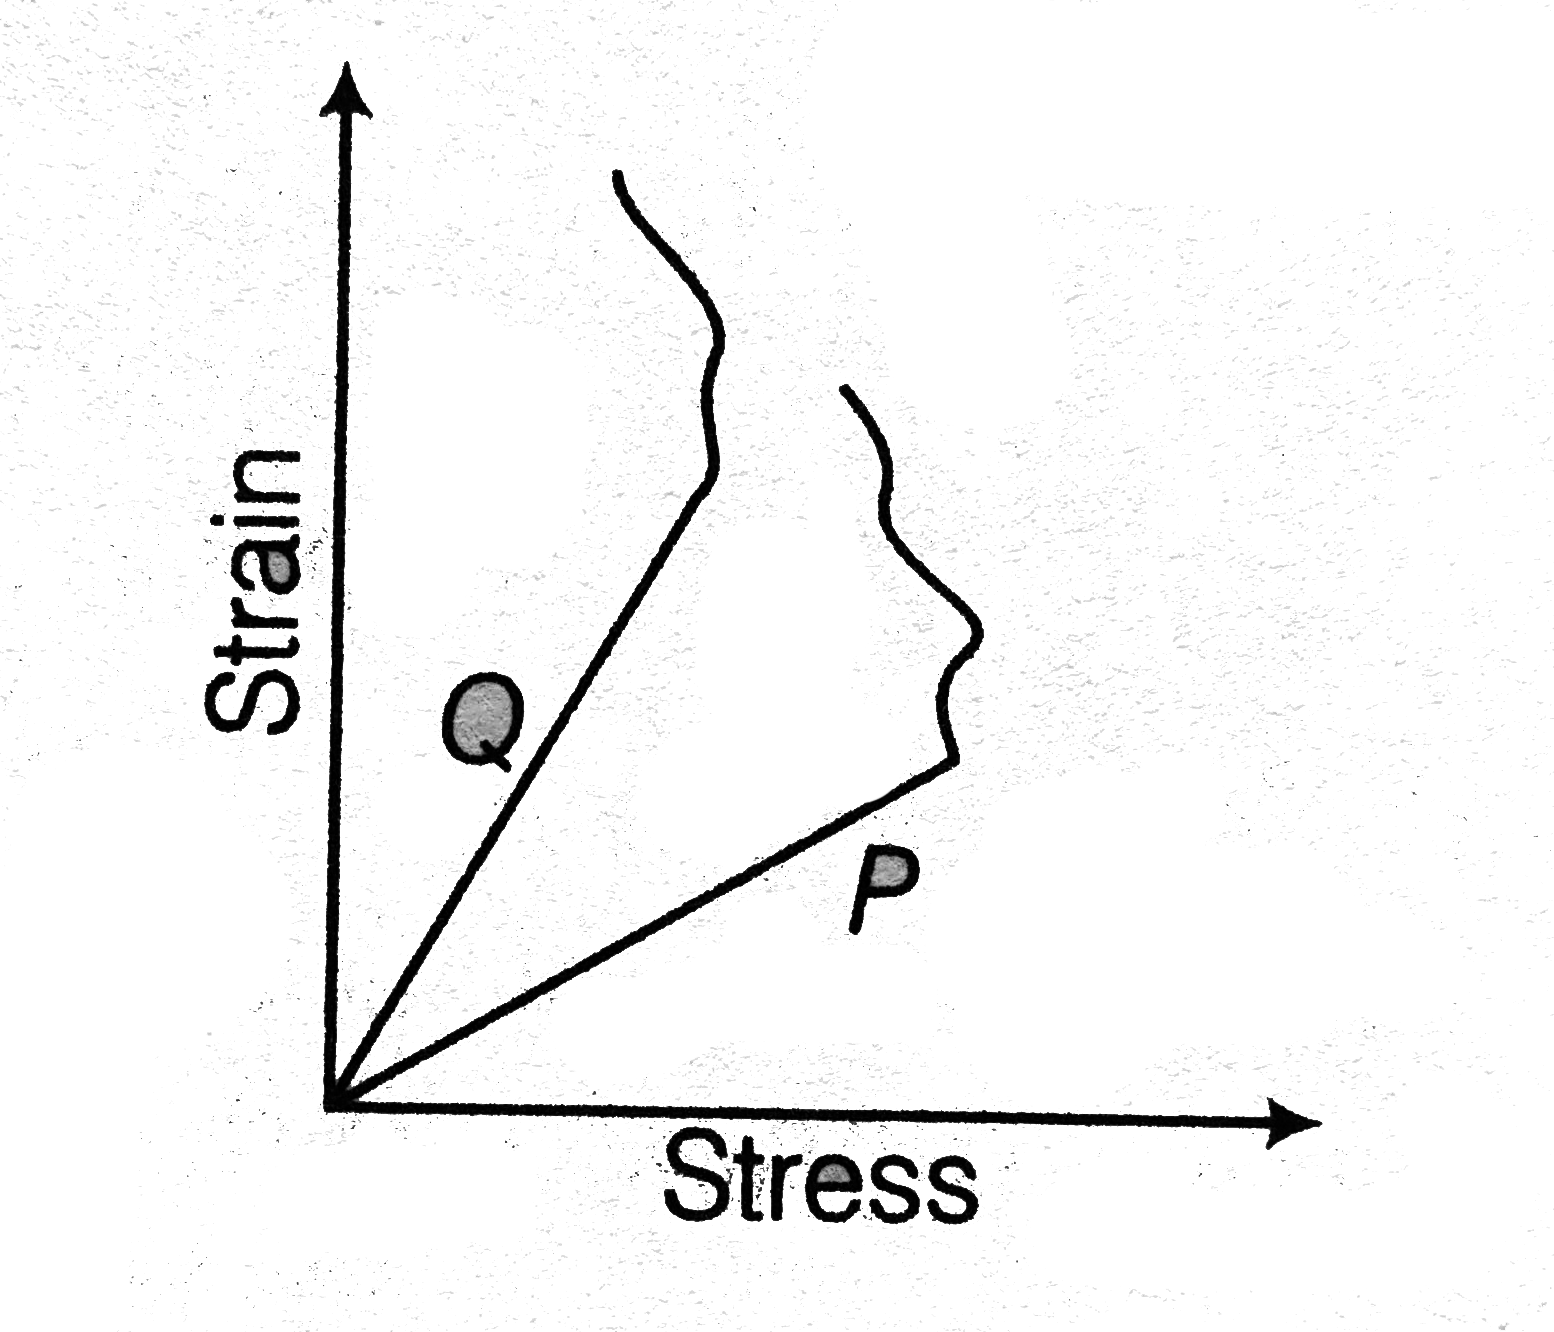
(A) P has greater young's modulus and lesser ductility
(B) Q has greater young's modulus and lesser ductility
(C) P has greater young's modulus and greater ductility
(D) Q has greater young's modulus and greater ductility
The correct Answer is:A
In the figure , the reciprocal of slope of stress - strain (x and y- axes ) curve , upto proportionality limit, gives young's modulus. The measure of ductility is obtained as the length of the stress-strain curve between yield point and ultimate load.
Topper's Solved these Questions
- BOOK - DC PANDEYCHAPTER - ELASTICITYEXERCISE - Level 1 Subjective8videos
ELASTICITY
- BOOK - DC PANDEYCHAPTER - ELASTICITYEXERCISE - Level 2 Single Correct10videos
ELASTICITY
- BOOK - DC PANDEYCHAPTER - ELASTICITYEXERCISE - Assertion And Reason22videos
ELASTICITY
- BOOK - DC PANDEYCHAPTER - CURRENT ELECTRICITYEXERCISE - All Questions434videos
CURRENT ELECTRICITY
- BOOK - DC PANDEYCHAPTER - ELECTROSTATICSEXERCISE - Integer17videos
ELECTROSTATICS
Similar Questions
Knowledge Check
- Question 1 - Select One or More
Figure shows the stress-strain graphs for materials .A and B. From the graph it follows that
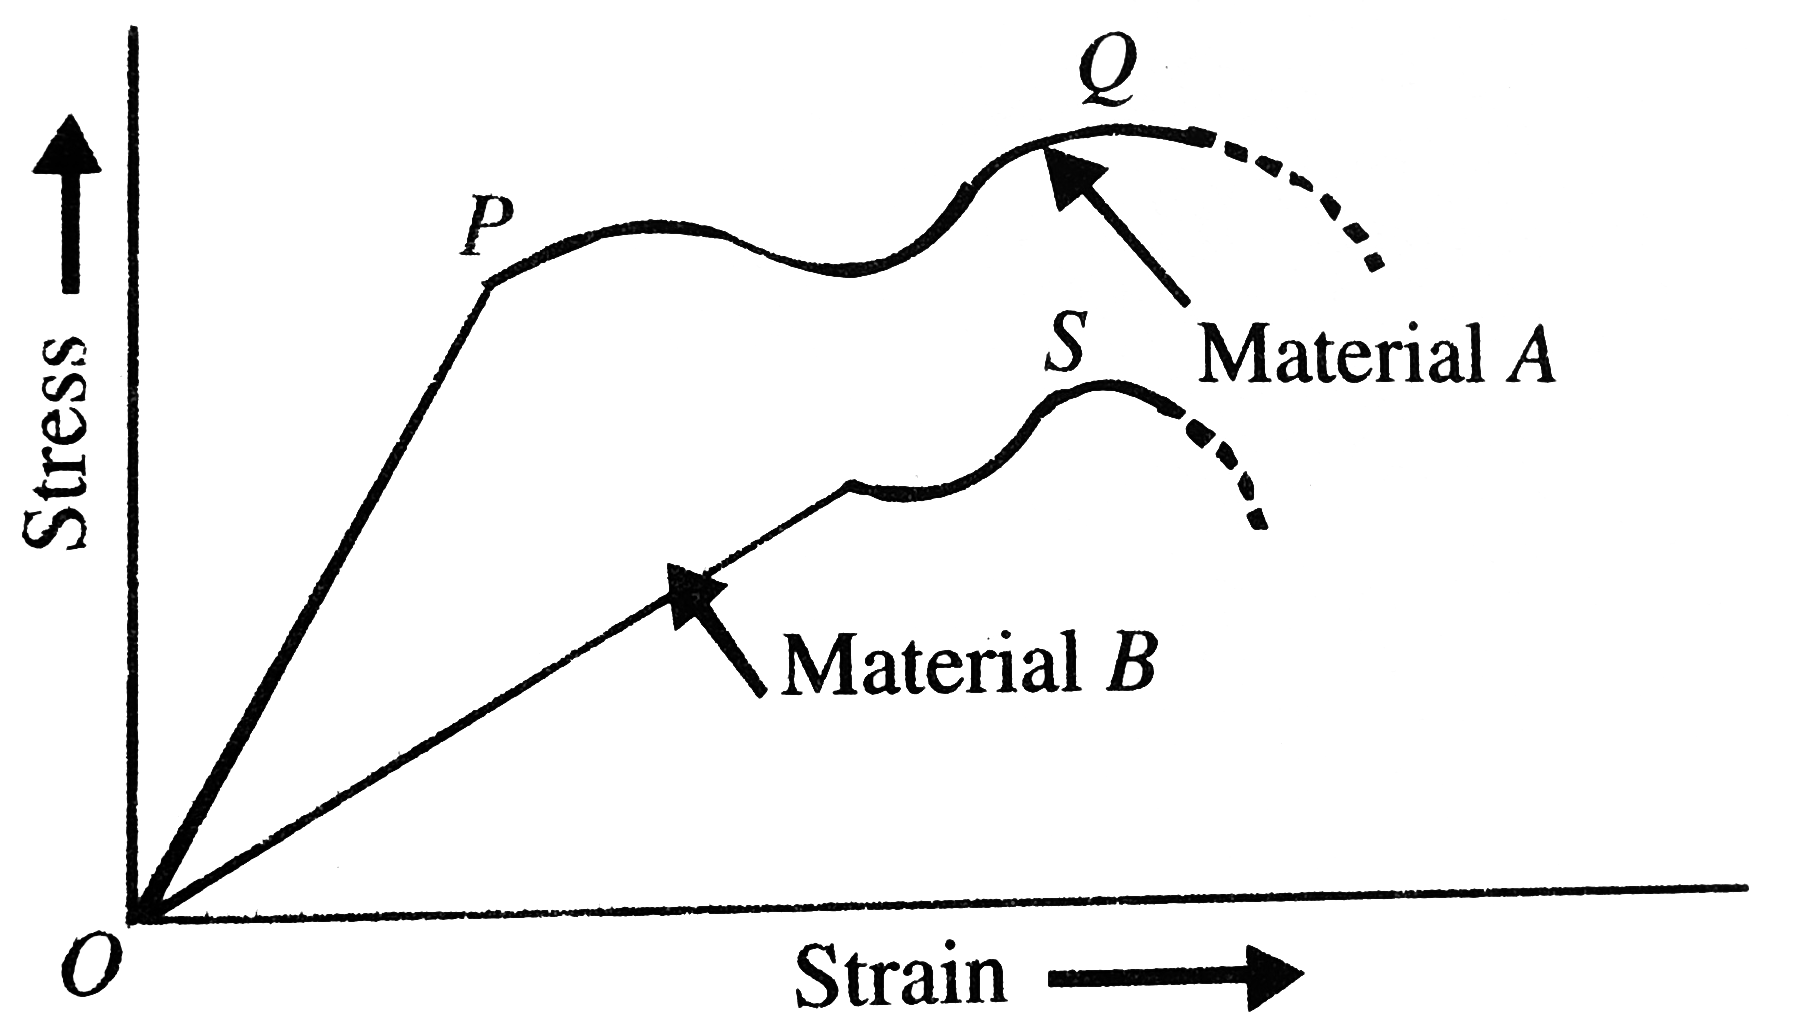 Ato material A has a higher Young's modulusBmaterial B is more ductileCmaterial A can withstand greater stressDmaterial B can withstand greater stress
 - Question 2 - Select One
The diagram shows stress v/s strain curve for the materials A and B. From the curves we infer that
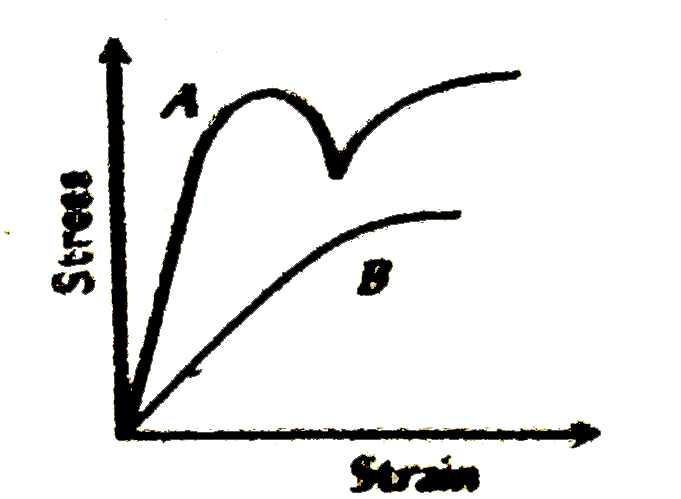 AA is brittle but B is ductileBA is ductile and B is brittleCBoth A and B are ductileDBoth A and B are brittle
 - Question 3 - Select One
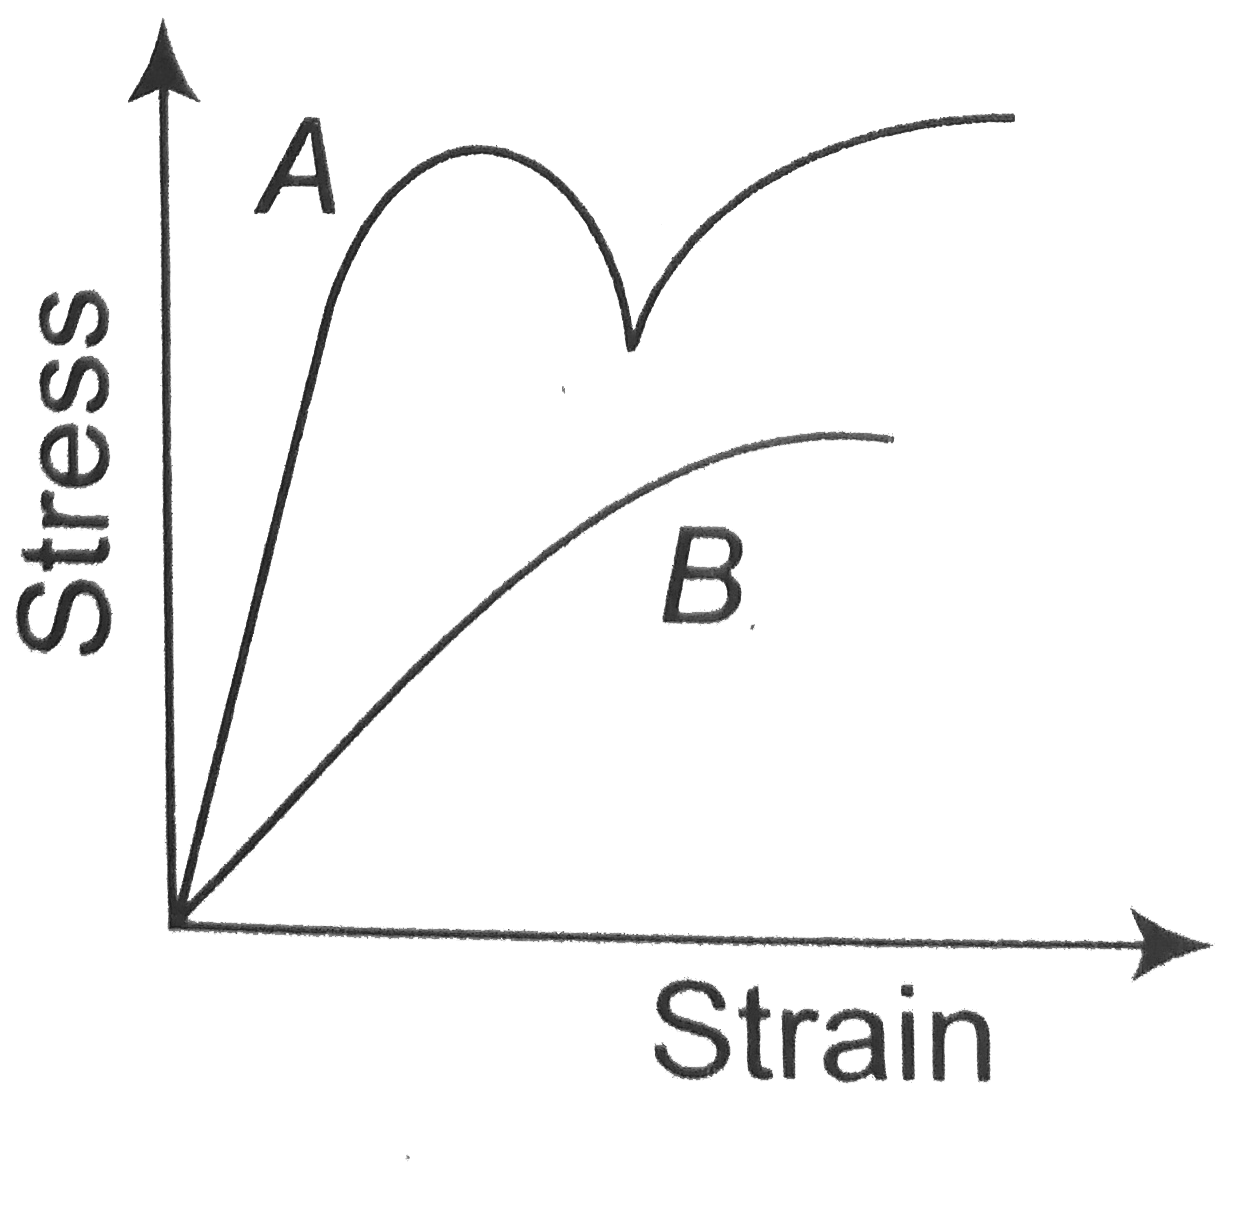
The diagram shoes stress v/s strain curve for the materials A and B. From the curves we infer thatAA is brittle but B is ductileBA is ductile and B is brittleCBoth A and B are ductileDBoth A and B are brittle
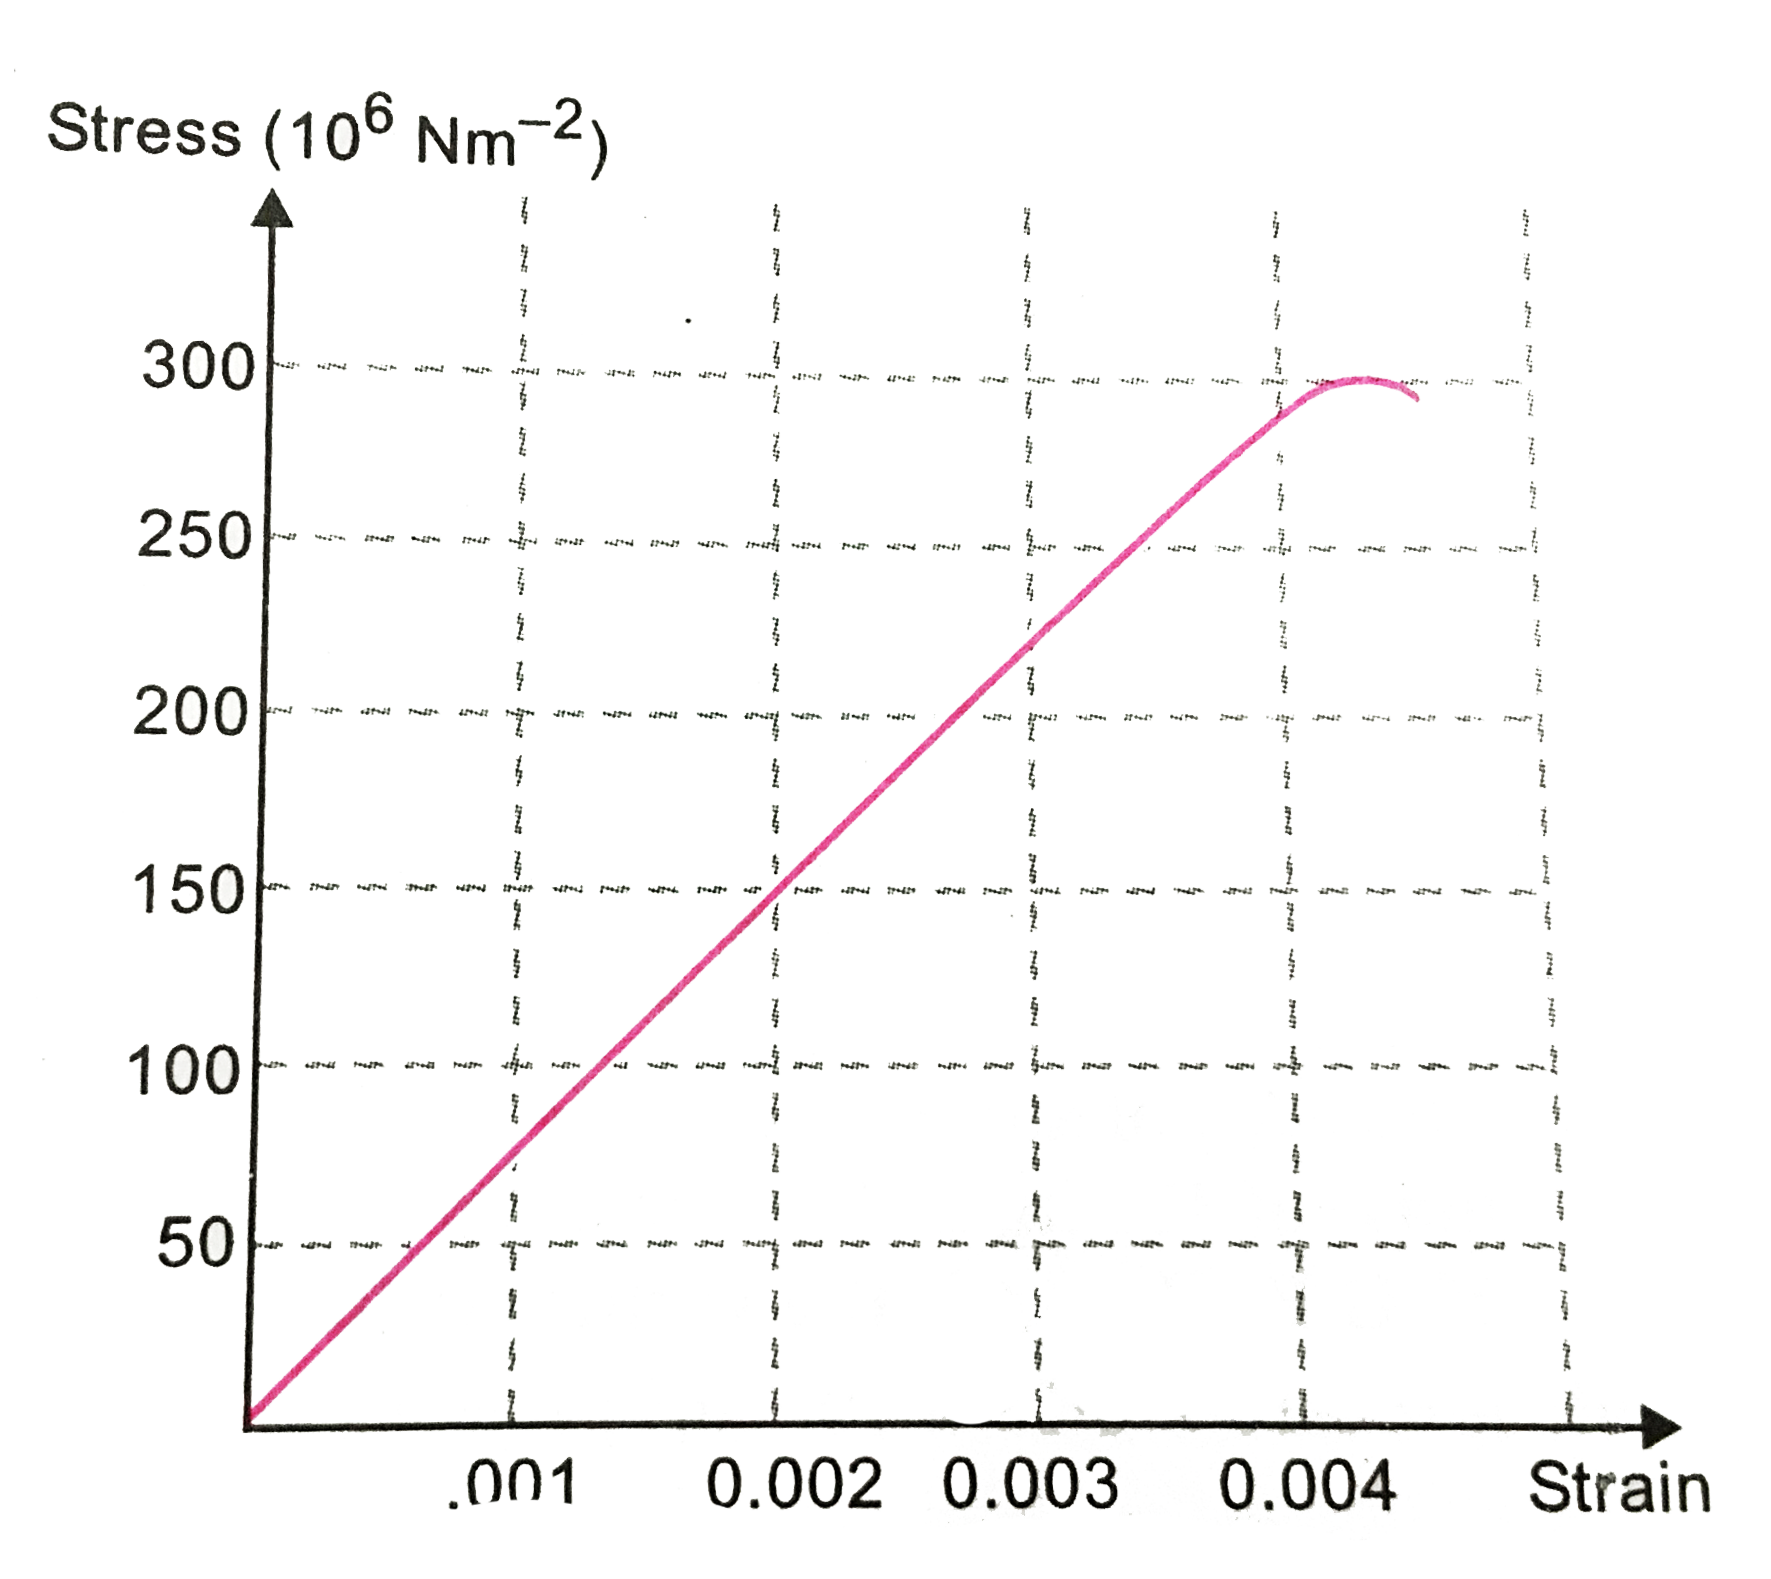
Fig., shows the stress-strain curve for a given materal. What are (a) Young's modulus and (b) approximate yield strength for this material?
 View Solution
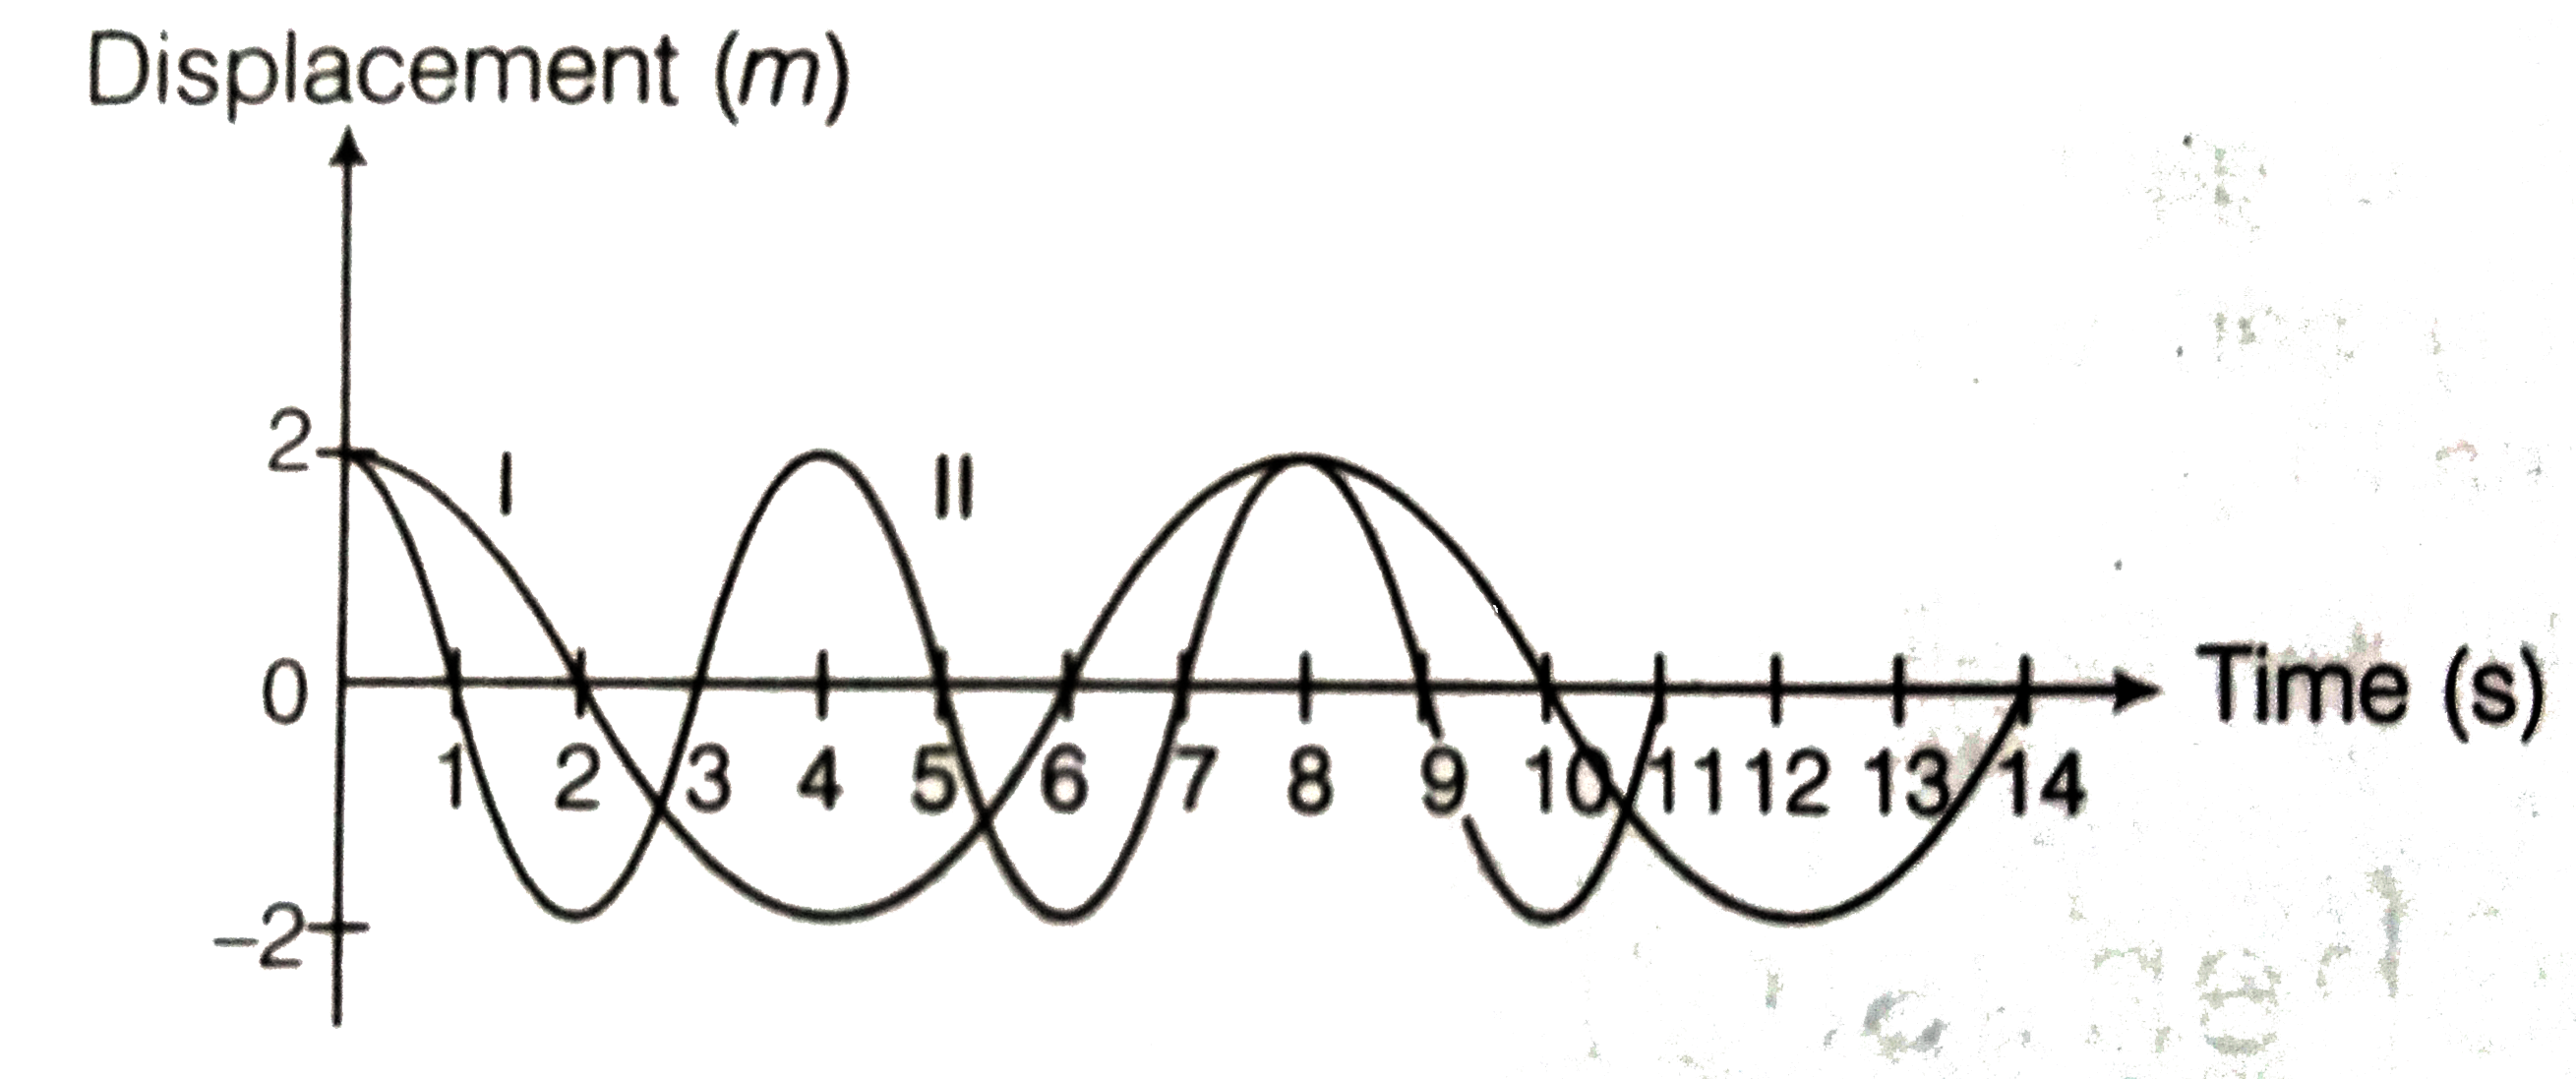
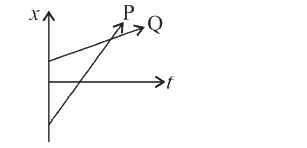
Figure shows the displacement -time curve of the particles P and Q. Which of the following statement is correct ?
 View Solution
In plotting stress versus strain curves for two material P and Q, a student by mistake puts strain on the y-axis stress on ther x-axis as shown in the figure. Then the correct statement is/are
 View Solution
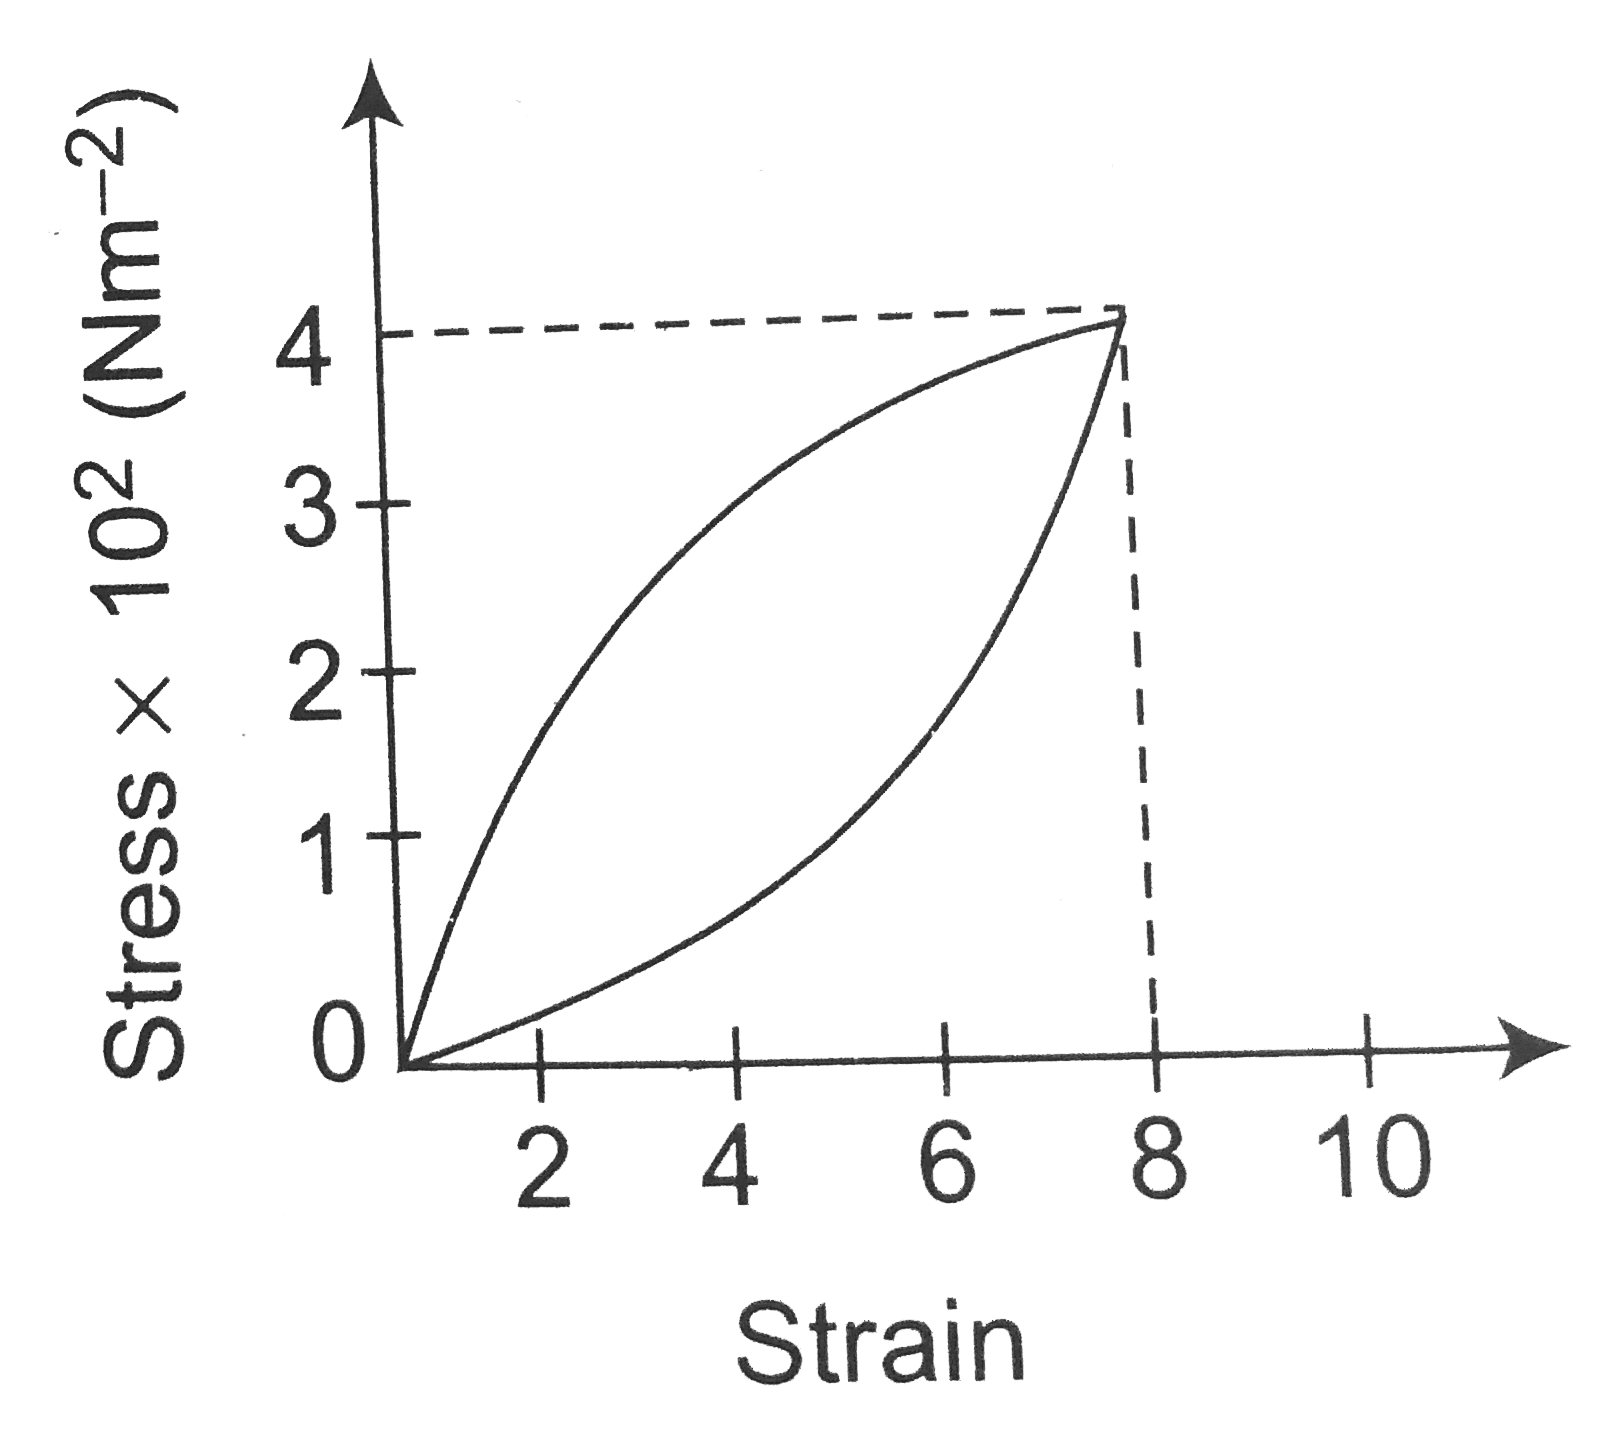
A rubber of volume 2000 cc is alternately subjected to tension and released. The figure shown the stress-strain curve of rubber. Each curve is a quadrant of an ellipse. The amount of energy lost as heat per cycle per unit volume will beView SolutionThe graph shows the variation of temperature (T) of one kilogram of a material with the heat (H) supplied to it. At O, the substance is in the solid state. From the graph, we can conclude that
 View Solution


