In order to build a longitudianl dataest, data of adult finches Geospiza fortis living on one of the Galapagos islands were collected. The beak shape data collected between 1971-2001 are shown in the graph.

Study the graph and select the correct statement.
The fluctuating direction in the beak shape is most probable due to change in the enviorment.
The graph as a whole does not indicate evolutionary change in the beak shape as the time interval is too small and evolution requires thousands of years to occur.
The graph indicates that the beak shape may lead to convergent evolutin in the finches of Galapagos inslands.
The change in any phenotypic character requires selection to alter the expression of large number of geries in coordinated fashion. Henc,e it is unlikely that change in the beak shape depicted in the graph is a result of evolution.
The correct Answer is:A
The diversity in beak shape is most probable due to changes in environment which lead to natural selection and gene flow among species. The graph does indicate evolutionary change. It has been shown that evolution can occur with surprising speed, as fast as those resulting from artifical selection. The selection in case of finches was strong and the populations evolved in a matter or generations. The Galapagos finches afford an excellent example of adaptive radiation. It is assumed taht a stock of ancestral finches reached the islands from the mainland and then in the absence of much competition, evolved to fill many of the empty ecological niches. There a change in a phenotypic character can be attributed to alteration in the expression of one to several genes. Thus the change in beak shape can be atributed to evolution.
Topper's Solved these Questions
Similar Questions
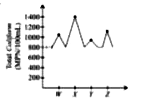
In a study, water samples of Yamuna river were collected from four different cities (W, X, Y and Z) to check the presence of Coliform bacteria. The result obtained was plotted in the given graph.
Select the incorrect statement regarding this.
View SolutionAs part of his science project, Prithvi was supposed to record the temperature every hour one Saturday from 6 am to midnight. At noon, he was taking lunch and forgot to record the temperature. At 8:00 pm, his favourite show came on and so forgot again. He recorded the data so collected on a graph sheet as shown below.
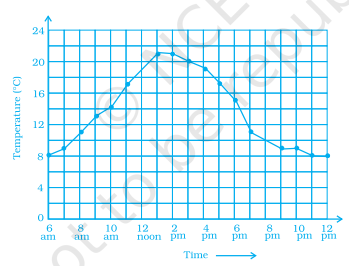
(a) Why does it make sense to connect the points in this situation?
(b) Describe the overall trend, or pattern, in the way the temperature changes over the time period shown on the graph.
(c) Estimate the temperature at noon and 8 pm.
View Solution
Knowledge Check
In order to build a longitudinal data set, data of adult finches Geospiza fortis living on one of the Galapagos islands were collected. The beak shape data collected between 1971-2001 are shown in the graph.

Study the graph and select the correct statement.AThe fluctuating direction in the beak shape is most probable due to change in the environment.BThe graph as a whole does not indicate evolutionary change in the beak shape as the time interval is too small and evolution requires thousands of years to occur.CThe graph indicates that the beak shape may lead to convergent evolutin in the finches of Galapagos inslands.DThe change in any phenotypic character requires selection to alter the expression of large number of geries in coordinated fashion. Henc,e it is unlikely that change in the beak shape depicted in the graph is a result of evolution.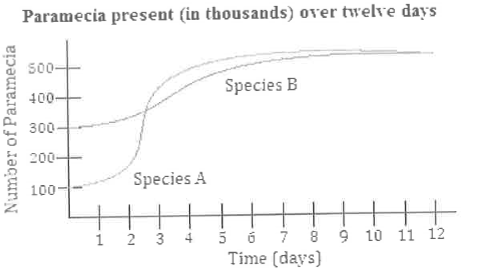
A small puddle is monitored by scientists for the number of paramecia present. The scientists are in two distinct species, let's call them ''species A'' and ''species B''. At time t = 0, the scientists measure and estimate the amount of species A and species B present in the puddle. They then proceed to measure and record the number of each species of paramecium present every hour for 12 days. the data for each species were then fit by a smooth curve, as shown in the graph above. Which of the following is a correct statement about the data above?AAt time t = 0, the number species B present is 150% greater than the number of species A presentBAt time t = 0, the number of species A present is 75% less than the number of species B presentCFor the first 3 days, the average growth rate of species B is higher than the average growth rate of species A.DThe growth rate of both rate of both species A and species B decreases for the last 8 days.The effect of solute concentration of the mass of tissue cells is studied.It is observed from the collected data that the tissue cells were isotonic to 10 % solute concentration Which of the following graph represents that the cells are isotonic 10 % solute concentrations
A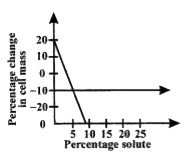 B
B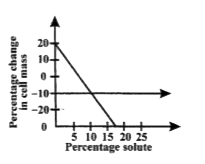 C
C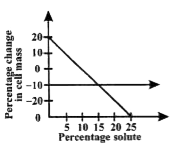 D
D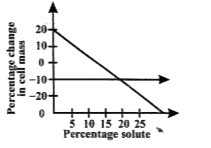
Match List-I with List-II and select the correct answer from the codes given below the lists:


View SolutionConsider the following four sttements (1,2,3 and 4) and select the right option for incorrect statements .
(1) Mendelian experiments had large sampling size, which gave greater credibility to the date that he collected .
(2) Recessive allele in influences the appeareance of phenotype even in the presence of an altemative allele.
(3) Multiple alleles can be found only when population studies are made .
(4) In F2 generation of Mendelian monohybrid cross, the tall and dwarf traits were identical to their parental types and showed blending .
View SolutionThe effect of solute concentration of the mass of tissue cells is studied.It is observed from the collected data that the tissue cells were isotonic to 10 % solute concentration Which of the following graph represents that the cells are isotonic 10 % solute concentrations
View SolutionGiven below are four jumbled sentence. Pick the option that gives their correct order.
A. Their classmate, Koushal, hardly studied and spent much of his time wasting on prattles.
B. He made himself busy by collecting old pens and used papers in order to avoid studies.
C. Poonam, the class teacher, was very much loved and respected by her students.
D. Three of them were very intelligent and spent most of their time studying with Poonam.
View SolutionStudy following statements regarding the preparation of herbarium sheets.
(i) Plant should be collected in flowering stage.
(ii) Every detail regarding the plant such as locality, ecological conditions, vegetative and floral characters, etc. should be noted.
(iii) Plants are evenly pressed by unfolding all the plant parts between blotting papers (or newspapers) with the help of plant pressers.
(iv) Blotting papers need not be changed until the plant gets dried.
(v) After drying, the plant specimen is carefully mounted/pasted on the herbarium sheets.
(vi) The herbarium sheet is labelled on the lower right hand corner representing the number of plant specimen, data of collection, etc.
Which of the above statements is/are not correct ?
View Solution
