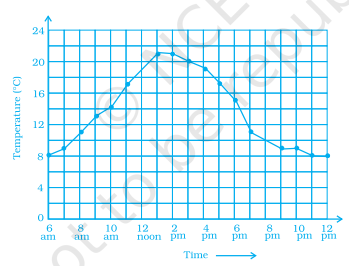
As part of his science project, Prithvi was supposed to record the temperature every hour one Saturday from 6 am to midnight. At noon, he was taking lunch and forgot to record the temperature. At 8:00 pm, his favourite show came on and so forgot again. He recorded the data so collected on a graph sheet as shown below.

(a) Why does it make sense to connect the points in this situation?
(b) Describe the overall trend, or pattern, in the way the temperature changes over the time period shown on the graph.
(c) Estimate the temperature at noon and 8 pm.
Step by step video & image solution for As part of his science project, Prithvi was supposed to record the temperature every hour one Saturday from 6 am to midnight. At noon, he was taking lunch and forgot to record the temperature. At 8:00 pm, his favourite show came on and so forgot again. He recorded the data so collected on a graph sheet as shown below. (a) Why does it make sense to connect the points in this situation? (b) Describe the overall trend, or pattern, in the way the temperature changes over the time period shown on the graph. (c) Estimate the temperature at noon and 8 pm. by Maths experts to help you in doubts & scoring excellent marks in Class 8 exams.
Updated on:21/07/2023Topper's Solved these Questions
- INTRODUCTION TO GRAPHS BOOK - NCERT EXEMPLARCHAPTER - INTRODUCTION TO GRAPHS EXERCISE - THINK AND DISCUSS
4 Videos
- EXPONENTS AND POWERSBOOK - NCERT EXEMPLARCHAPTER - EXPONENTS AND POWERSEXERCISE - EXERCISE
195 Videos
- LINEAR EQUATIONS IN ONE VARIABLEBOOK - NCERT EXEMPLARCHAPTER - LINEAR EQUATIONS IN ONE VARIABLEEXERCISE - THINK AND DISCUSS
3 Videos
Similar Questions
Knowledge Check
Which one of the following years is supposed to have recorded the warmest temperature the world over?
A1990B1998C1885D1950From 9.00 Am to 2.00 PM. The temperature rose at a constant rate from 21∘C to 36∘C. What was the temperature at noon ?
A27∘CB30∘CC32∘CD28.5∘CThe lowest temperature is recorded by:
A1. Maximum thermometerB2. Mercurial thermometerC3. Alcohol thermometerD4. none of these.
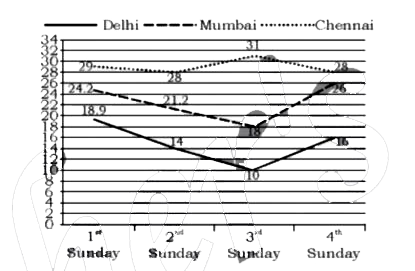
The line graph shows the temperature on four sundays of three cities

In the given graph when was the maximum temperature recorded in delhi
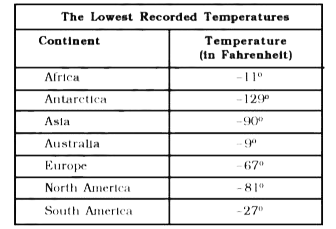
View SolutionThe table shows the lowest recorded temperatures for each continent. Write the continents in order from the lowest recorded temperature to the highest recorded temperature.

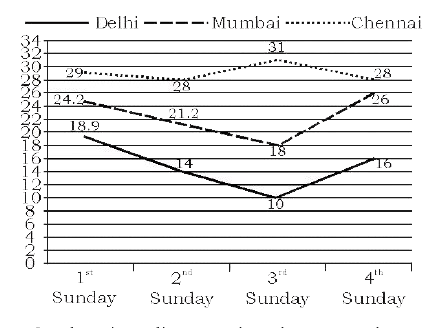
View SolutionThe line graph shows the temperature on four Sundays of three cities
 In the given line graph , when was the maximum temperature recorded in Chennai
View SolutionHe collects old stamps. This is his favourite hobby.
View SolutionWhen was a global network of daily temperature records created ?
View Solution
