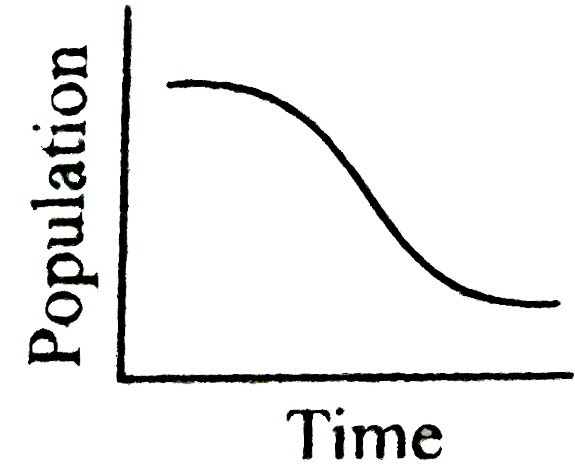
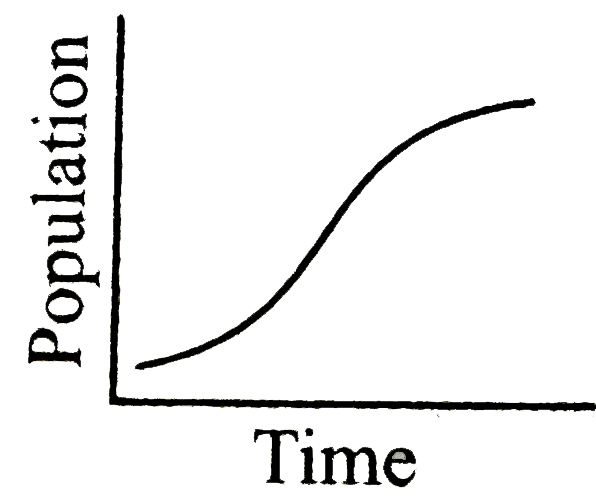
In a given population of 2000 indivials, 80 births and 125 deaths were reported over a given period of time. Which of the following graphs will correspond to it ?
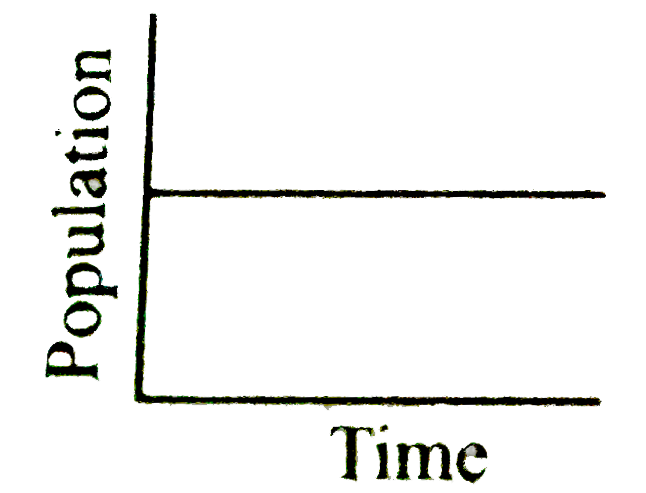
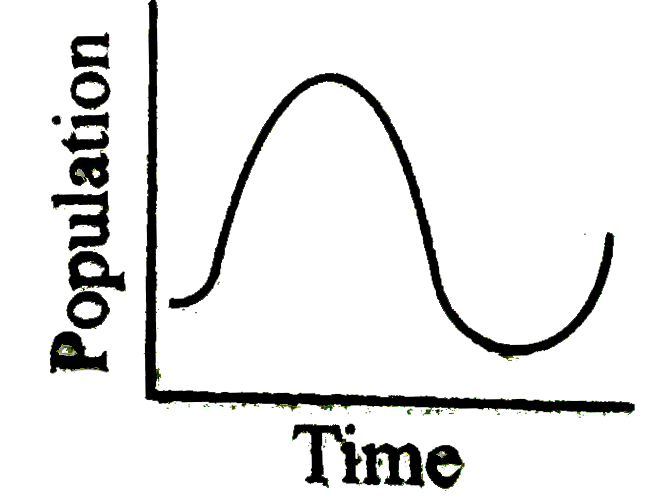
The correct Answer is:A
To solve the problem regarding the population dynamics given the data of births and deaths, we can follow these steps:
1. Identify the Initial Population:
The initial population is given as 2000 individuals.
2. Determine the Number of Births:
According to the information provided, there were 80 births reported.
3. Determine the Number of Deaths:
The number of deaths reported is 125.
4. Calculate the Net Change in Population:
To find the net change in the population, we can use the formula:
Net Change=Births−Deaths
Substituting the values:
Net Change=80−125=−45
This indicates a decrease in the population.
5. Calculate the New Population Size:
To find the new population size after the births and deaths, we can use:
New Population=Initial Population+Net Change
Substituting the values:
New Population=2000−45=1955
6. Interpret the Population Trend:
Since the number of deaths (125) is greater than the number of births (80), the population is declining.
7. Choose the Correct Graph:
Based on the analysis, the graph that corresponds to a declining population trend should be selected. Therefore, option A, which shows a decline in population over time, is the correct choice.
Final Answer:
The graph that corresponds to the given data is Option A, as it represents a declining population trend.
---
The initial population is given as 2000 individuals.
According to the information provided, there were 80 births reported.
The number of deaths reported is 125.
To find the net change in the population, we can use the formula:
Net Change=Births−Deaths
Substituting the values:
Net Change=80−125=−45
This indicates a decrease in the population.
To find the new population size after the births and deaths, we can use:
New Population=Initial Population+Net Change
Substituting the values:
New Population=2000−45=1955
Since the number of deaths (125) is greater than the number of births (80), the population is declining.
Based on the analysis, the graph that corresponds to a declining population trend should be selected. Therefore, option A, which shows a decline in population over time, is the correct choice.
The graph that corresponds to the given data is Option A, as it represents a declining population trend.
Topper's Solved these Questions
Similar Questions
Knowledge Check
- Question 1 - Select One
Which of the following graph corresponds to a population of 2000 individuals, with 800 births and 1200 deaths over a given period of time?
A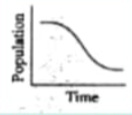 B
B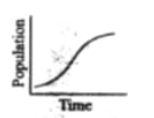 C
C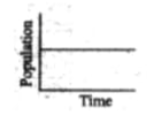 D
D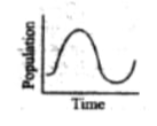
- Question 2 - Select One
Which of the following is true about the given graph?
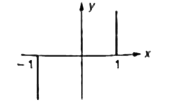 AA. x=|y|y,y≠0BB. y=|x|x,x≠0CC. x=−|y|y,y≠0DD. y=−|x|x,x≠0
 - Question 3 - Select One
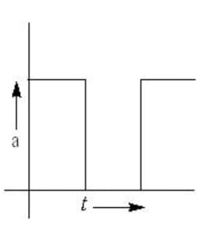
Figure shows the acceleration-time graphs of a particle. Which of the following represents the corresponding velocity -time graph?
 A
A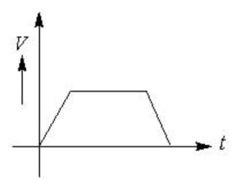 B
B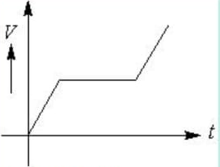 C
C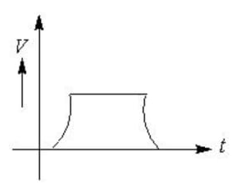 D
D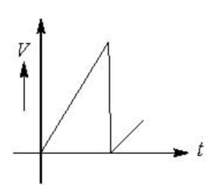
The graph below shws the velocity versus time graph for a body
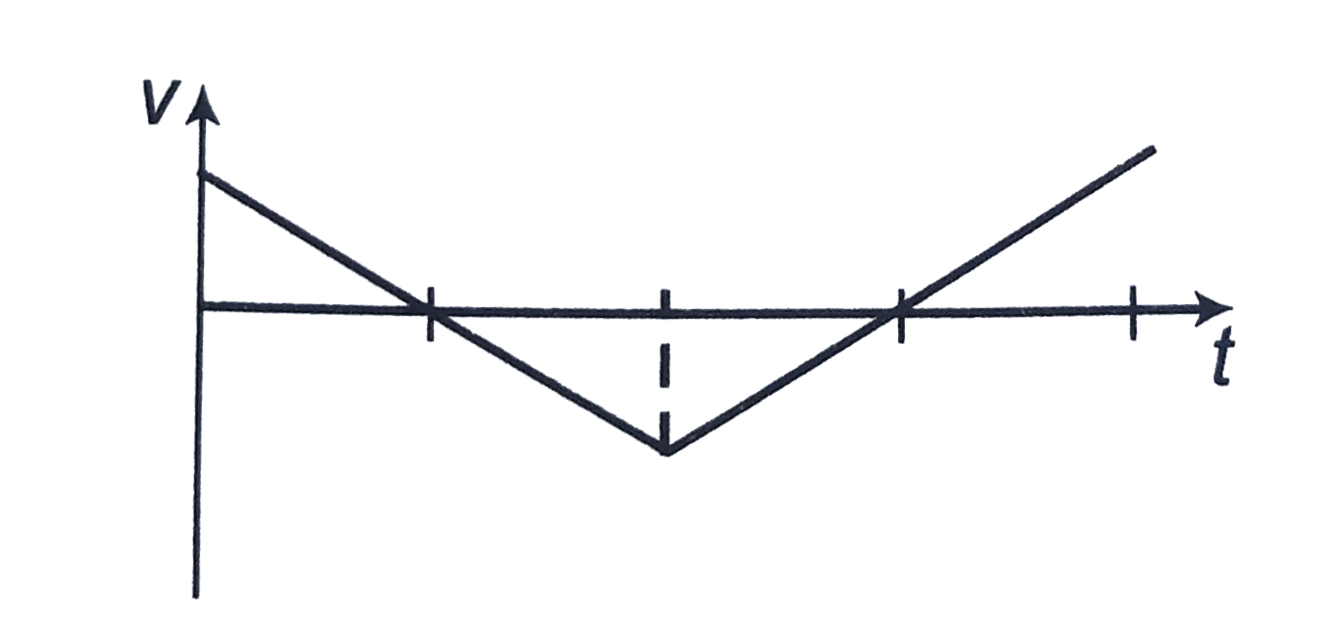
Which of the following graph represents the corresponding acceleration v//s time graph?View Solutionचार देशों की जन्म दर एवं मृत्यु दर नीचे दी गई है | किसकी समष्टि वृद्धि दर सबसे कम होगी ?
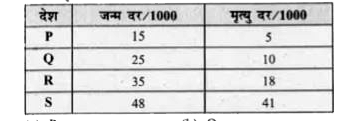 View Solution
The current I in an inductance coil varies with time according to the graph given in the figure.
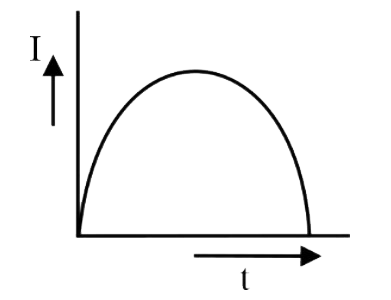
Which one of the following graphs gives the variation of voltage with time across the inductor?View SolutionA certain reaction A→B follows the given concentration (molarity) - time graph. Which of the following statement is true?
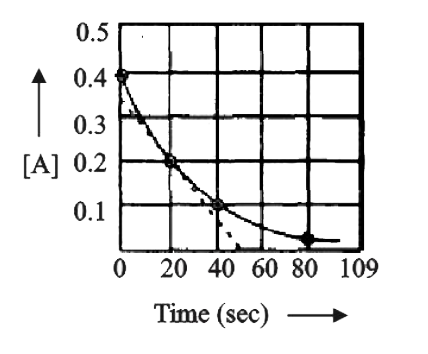 View Solution
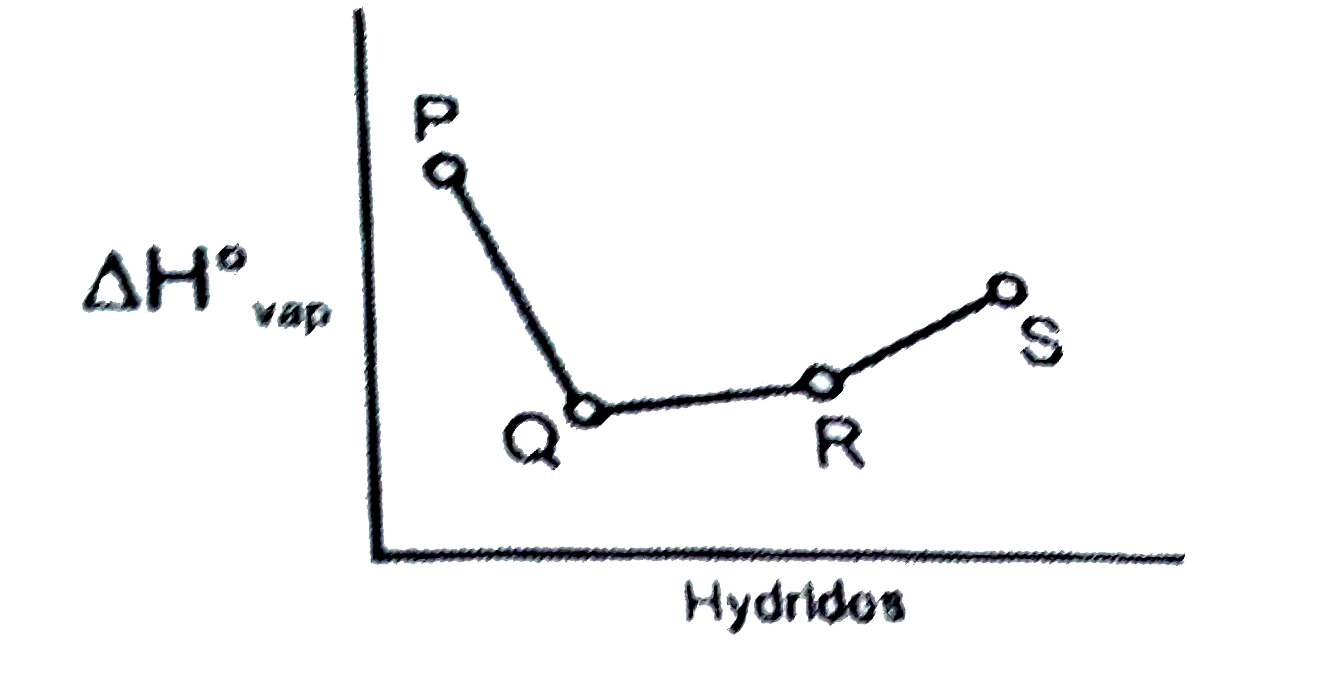
ΔHvaporisation (KJ/mol) are given for the hydrides of halogens in the following graph. The hydride HF will correspond to
 View Solution


