If N= population density at time t, then population density at time t+1 can be written as. Nt+1=Nt+[(A+B)−(C+D)]. Select the correct option for A,B,C and D in the above equation.
A can be mortality and B can be natality
B can be immigration and C can be natality
C can be mortality and D can be immigration
A can be natality and D can be emigration.
The correct Answer is:D
A and B are natality and immigration. They add to population density. C and D are mortality and emigration. They decrease population density.
Topper's Solved these Questions
Similar Questions
Study the schematic representation given above and answer the following questions : (a)Identify A in it. (b)Identify D in it. (c)When the population density at time t is N as shown above, write the population density at time t+1 in the form of an equation using appropriate symbols.

View Solution(a) Write an equation for Verhulst Pearl logistic . Growth where
N = Population density at a time t
r = Intrinsic rate of natural increase
K = Carrying capacity
(b) Draw a graph for a population whose population density has reached the carrying capacity .
(c) Why is the logistic growth model considered a more reallistic one for most animal populations ?
(d) Draw a growth curve where resources are not limiting to growth of a population.
View Solution
Knowledge Check
The integral form of the exponential growth equation as Nt=N0ert
A. population density after time t
B. population density at time zero
C. intrinsic rate of natural increase
D. the base of natural logarithms (2.71828)
Identify A,B,C and D fromt eh given equation.AA-r,B-e,C-No,D-NtBA−Nt,B−N0,C−r,D−eCA−N0,B−Nt,C−r,D−eDA−N0,B−Nt,C−e,D−rThe change in population size at a given time interval t , is given by the expression
Nt=N0+B+I−D−E
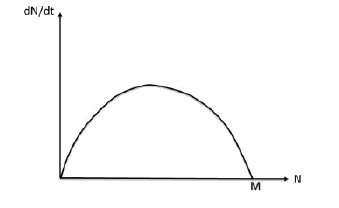
I , B and D stand respectively forAa rate of immigration , mortality rate, natality rateBrate of emigration , natality rate , mortality rateCmortality rate , rate of immigration , natality rateDrate of immigration , natality rate , mortality rateIn the graph below. where N is population size and tis time. M represents
 Aspecific growth rate.BMedian population sizeCcarrying capacityDminimum population size without going extinct.
Draw and explain a logistic curve for a population of density (N) at time (t ) whose intrinsic rate of natural increase is (r) and carrying capacity is (k).
View SolutionA⊕−−→ population density(N)T←−−B.
If A increases the population density and B decrases then identify A and B
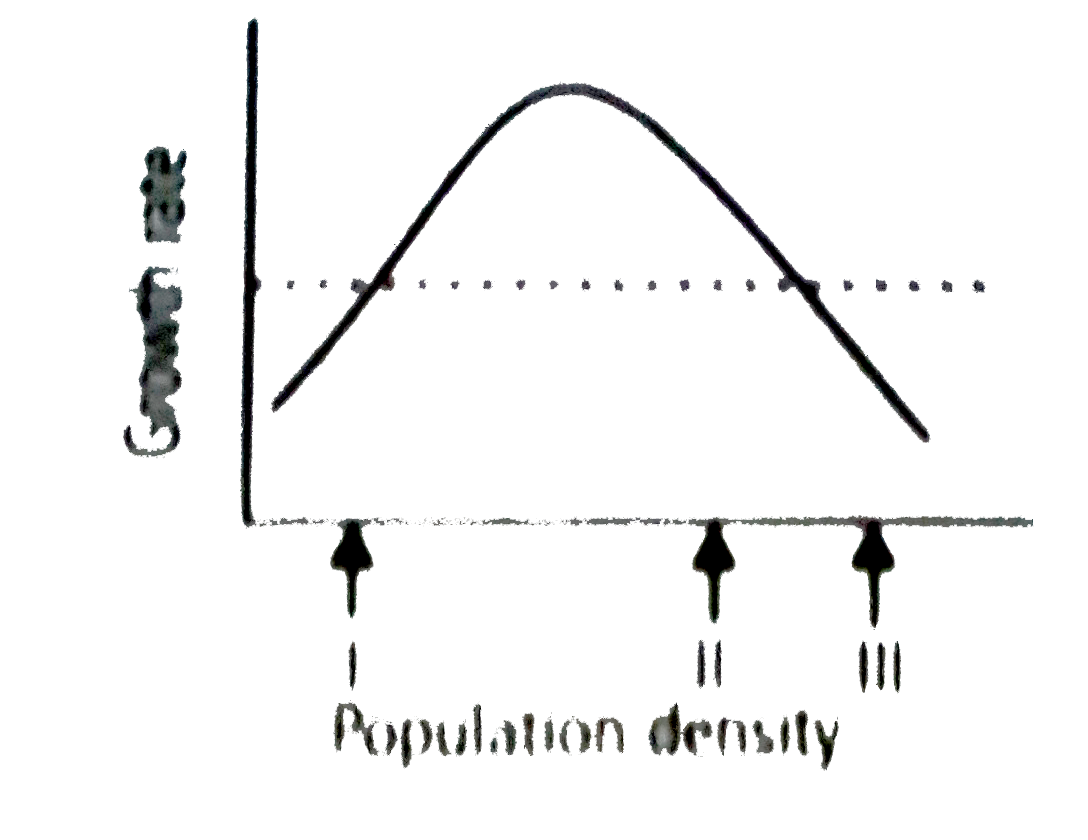
View SolutionThe relationship between population density (Nt) and population growth rate (R=Nt+1lNt) in a certain animal species is shown below.

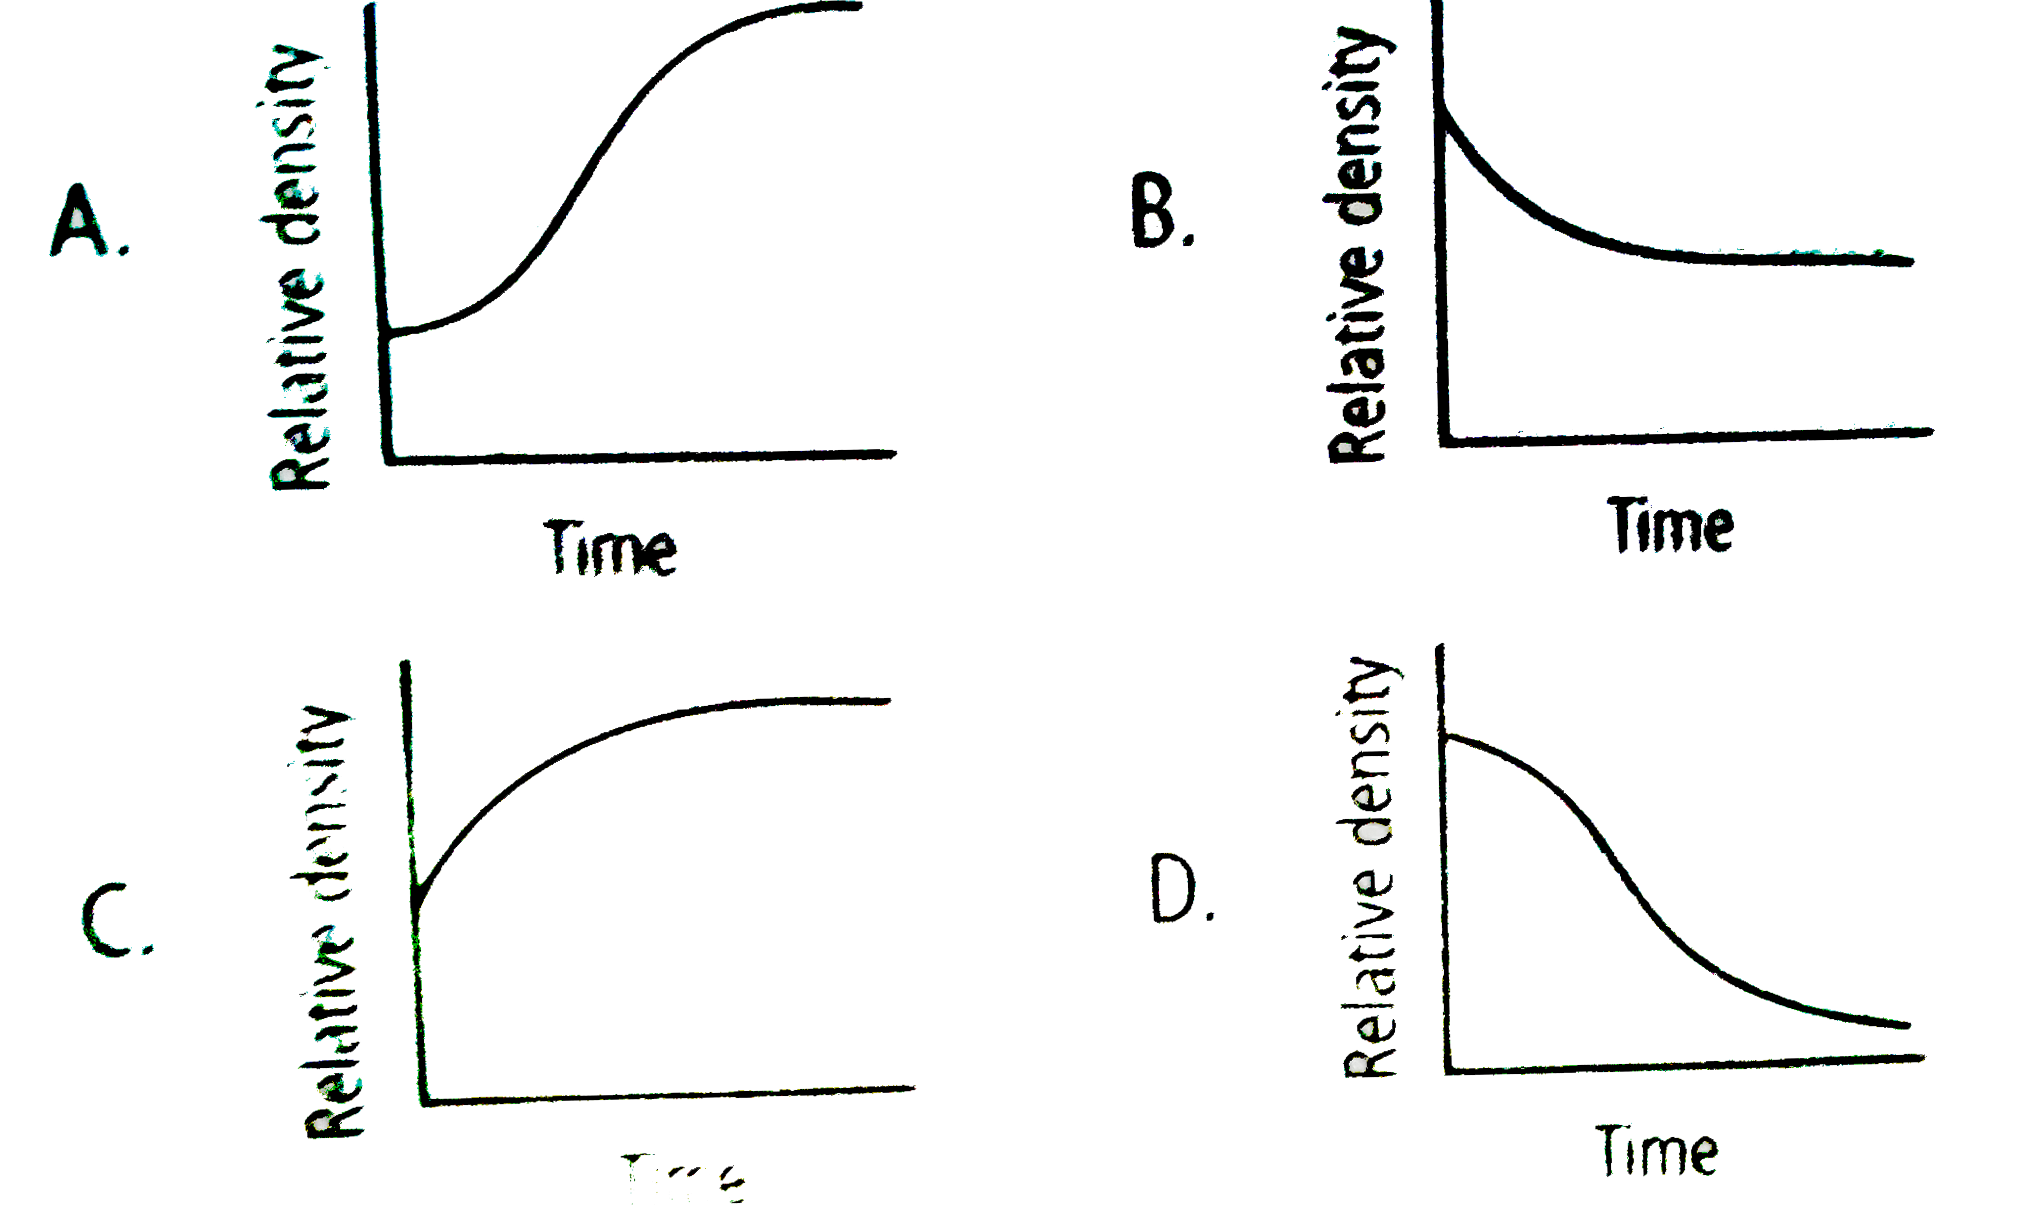
Choose from the following graphs the appropriate populations growth patterns that would be obtained if the population is at the densities (I, II, III) shown in the graph above. [Note : THe y-axis in A to D is relative density that cannot be compared to the absolute density in the figure]

View SolutionThe formula for the calculation of population density is D=n/at, in this formula "a" represents :
View SolutionIn change in population size, Nt = N0 + B + I - D - E. What do I, B, D stand for?
View Solution
