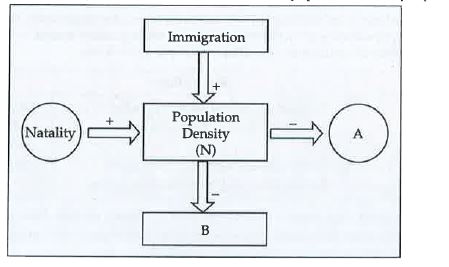
Study the schematic representation given above and answer the following questions :
(a)Identify A in it.
(b)Identify D in it.
(c)When the population density at time t is N as shown above, write the population density at time t+1 in the form of an equation using appropriate symbols. 
Step by step video & image solution for Study the schematic representation given above and answer the following questions : (a)Identify A in it. (b)Identify D in it. (c)When the population density at time t is N as shown above, write the population density at time t +1 in the form of an equation using appropriate symbols. by Biology experts to help you in doubts & scoring excellent marks in Class 12 exams.
Updated on:21/07/2023Topper's Solved these Questions
Similar Questions
Observe flow chart given below:
(a) Name the processes represented as A and B.
(b) If 'N' , is the population density at time t, then write down the population density equation at time t+1.
View SolutionStudy the given map and answer the following questions:
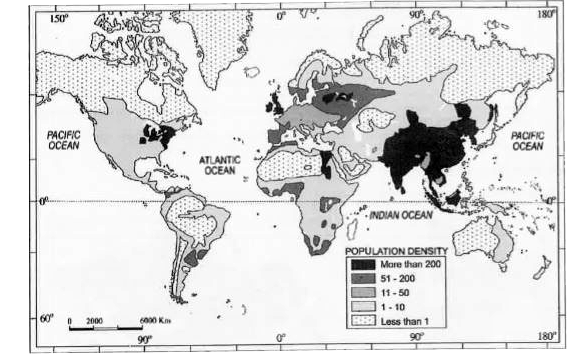
(i) Name the nations having high density of population in Asia.
(ii) Name the nations having less than one person of pupulation density.
(iii) Give appropriatge reasons for the above two questions.
View Solution
Knowledge Check
A⊕−−→ population density(N)T←−−B.
If A increases the population density and B decrases then identify A and BAA-natality B-mortalityBA-immigration B-emigrationCboth 1 and 2DA-emigration,B-immigrationIf N= population density at time t, then population density at time t+1 can be written as. Nt+1=Nt+[(A+B)−(C+D)]. Select the correct option for A,B,C and D in the above equation.
AA can be mortality and B can be natalityBB can be immigration and C can be natalityCC can be mortality and D can be immigrationDA can be natality and D can be emigration.
Study the given experimental set-up and answer the following questions.
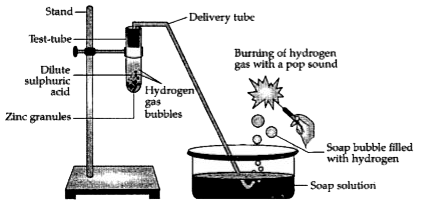
Write the products formed in the above process:
View Solution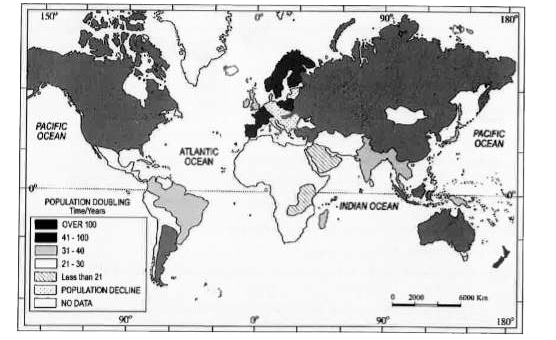
Study the given map and answer the following questions: <
(i) Name the nations that take a very long time to double their population ? Why?
(ii)Which are the nations taking about 31 to 40 years to double their population ? Why ?
View SolutionStudy the diagram given below and answer the following questions.
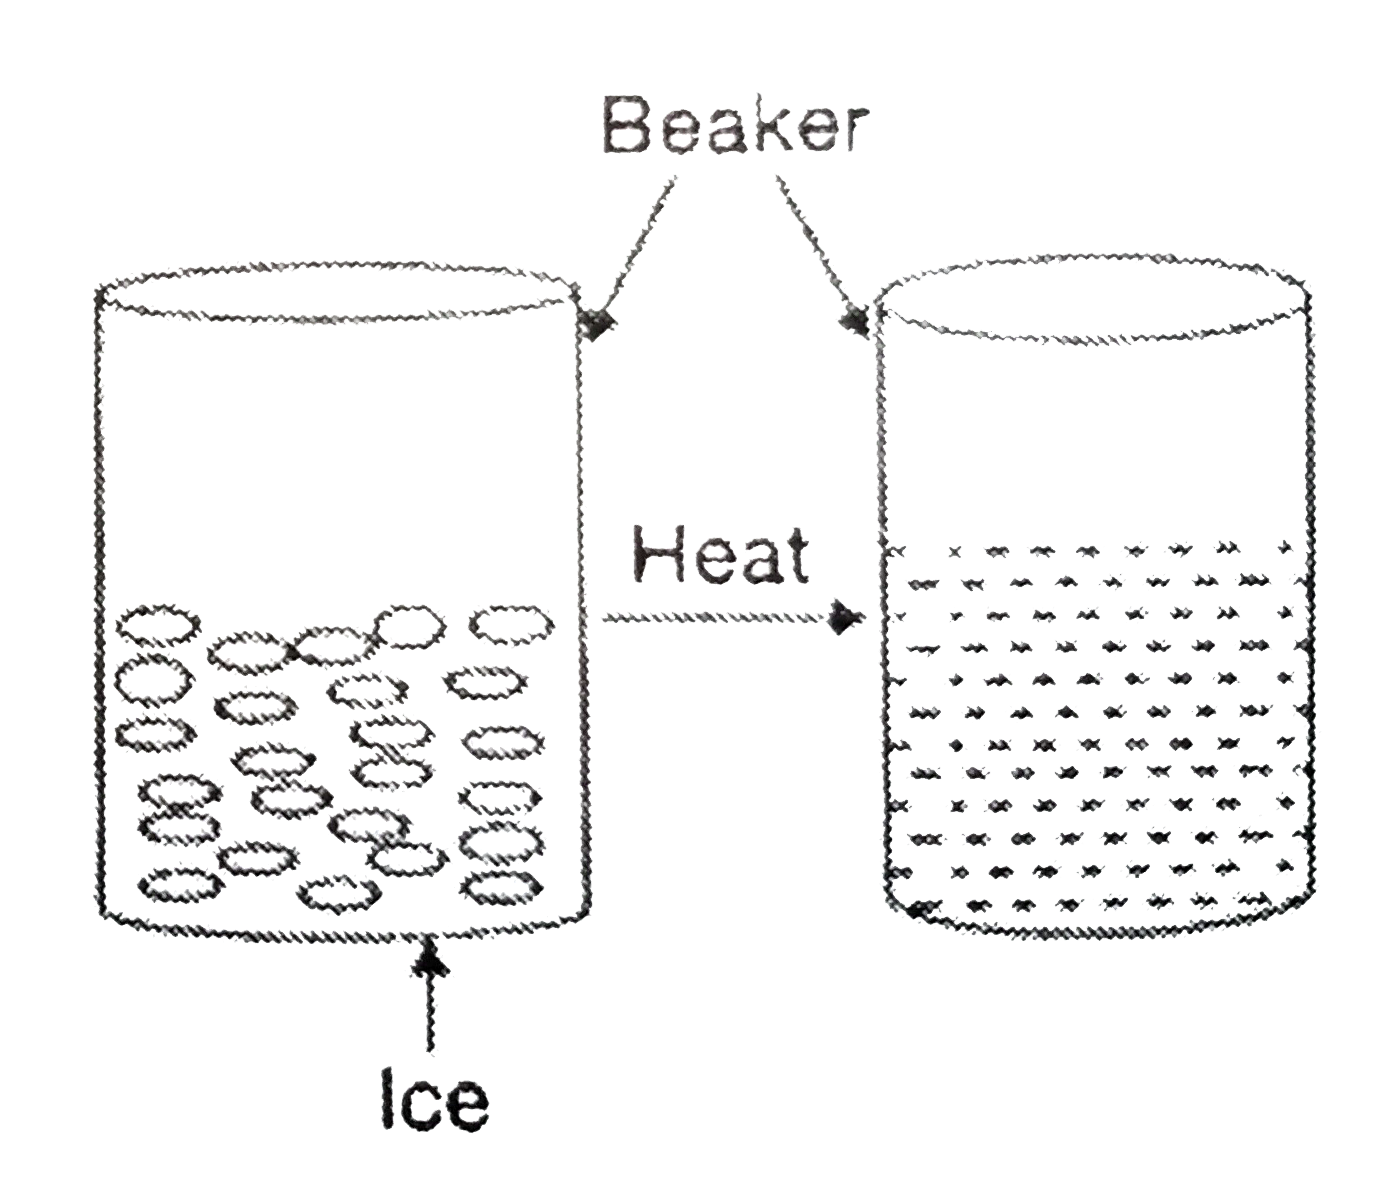
(a) Does the composition remain the same
(b) Name the type of change involved .
(c ) Write any two characteristics of the above change.
View SolutionStudy the diagram given below and answer the following questions.
(a) Does the composition remain the same?
(b) Name the type of change involved.
(c ) Write any two characteristics of the above change.
View Solution(a) Study the flow chart given below and complete the equation that follows by identifying 1, 2, 3 and 4.
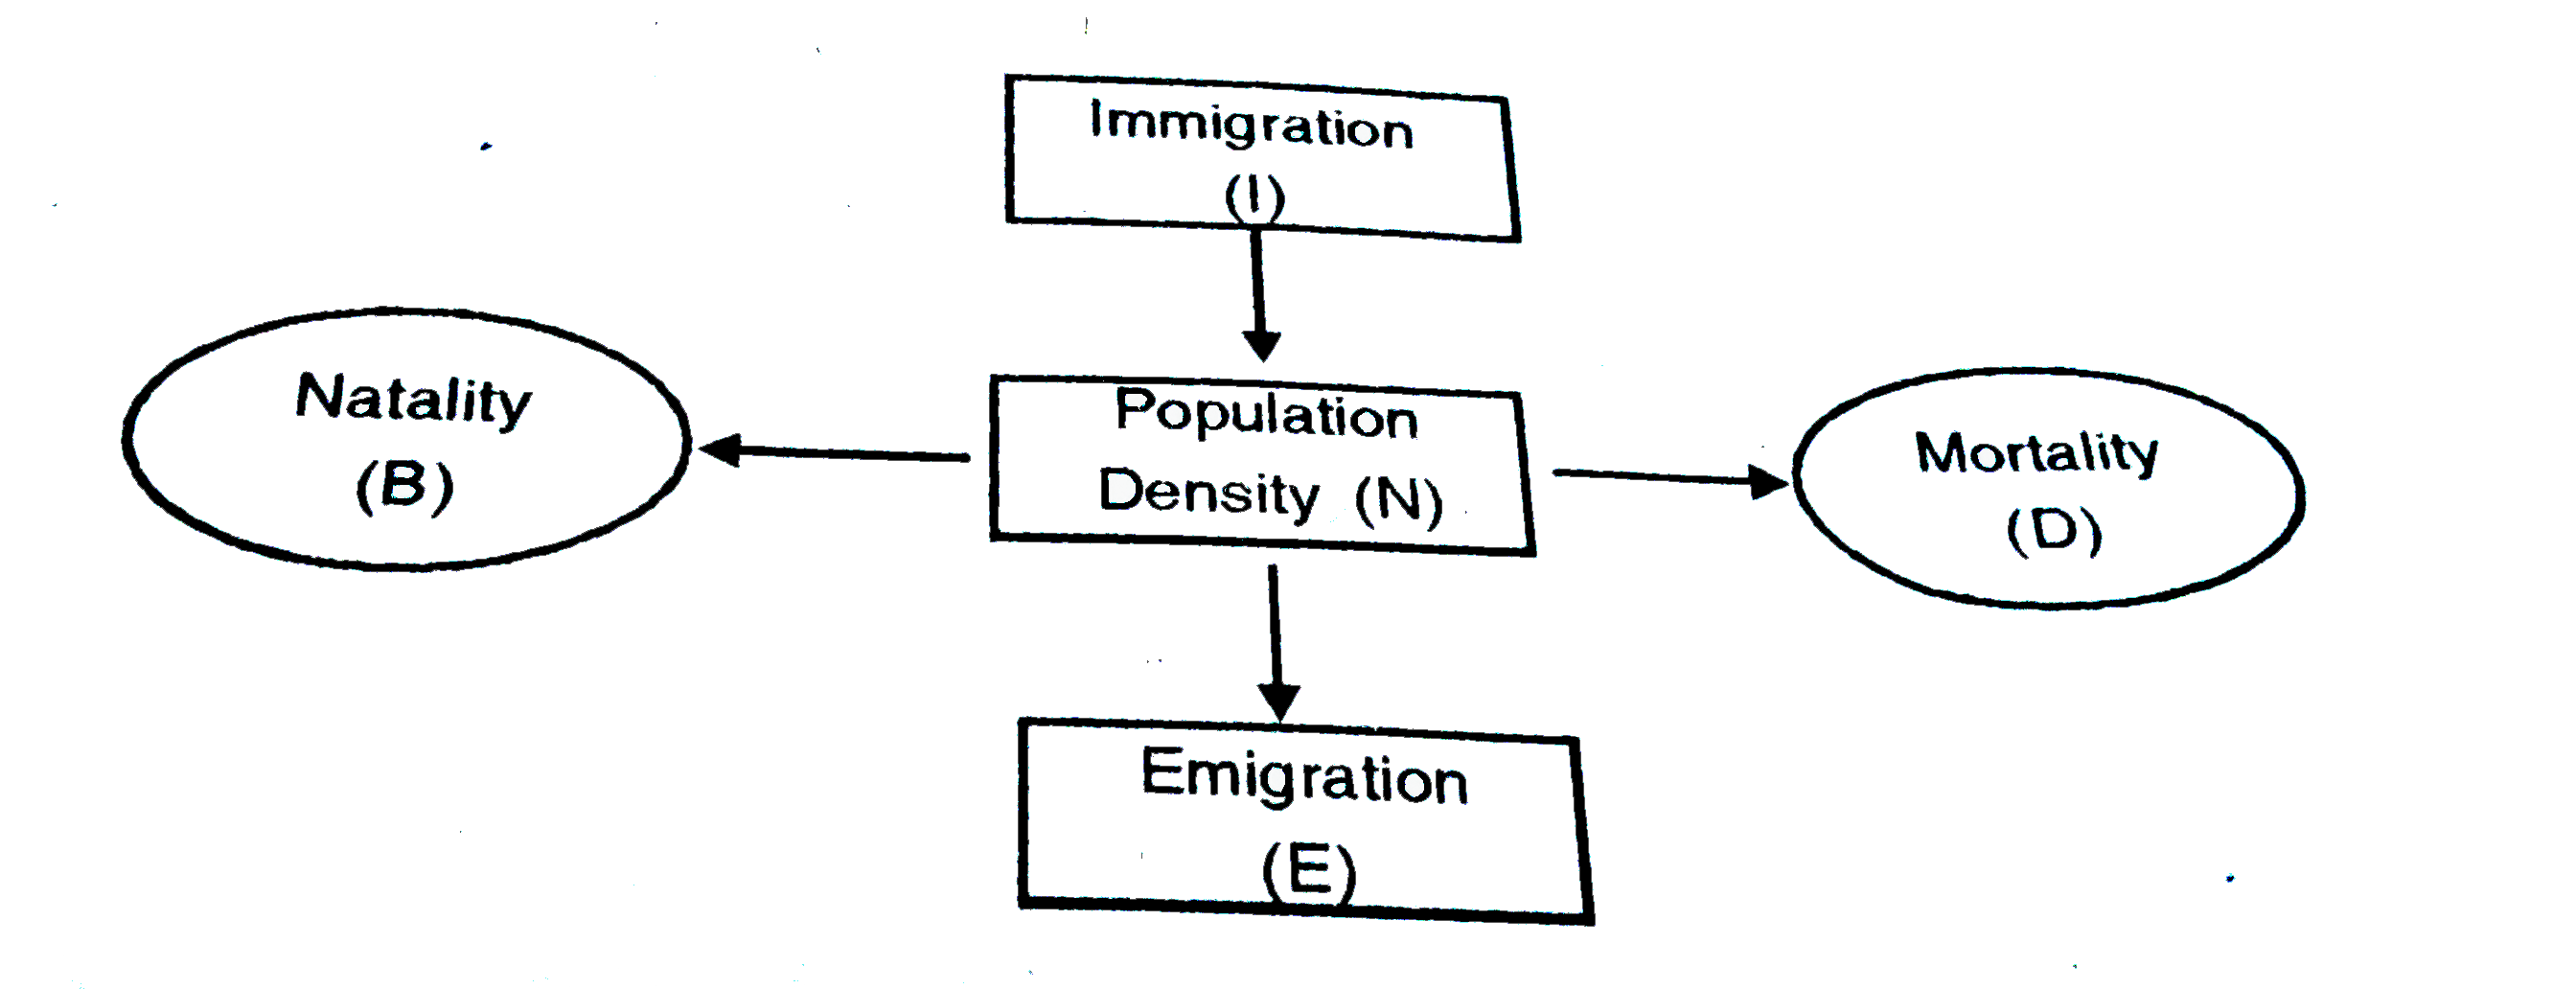
(b) Mention the different ways by which the population density of different species can be measured.
View SolutionObserver the given figure and answer the following questions
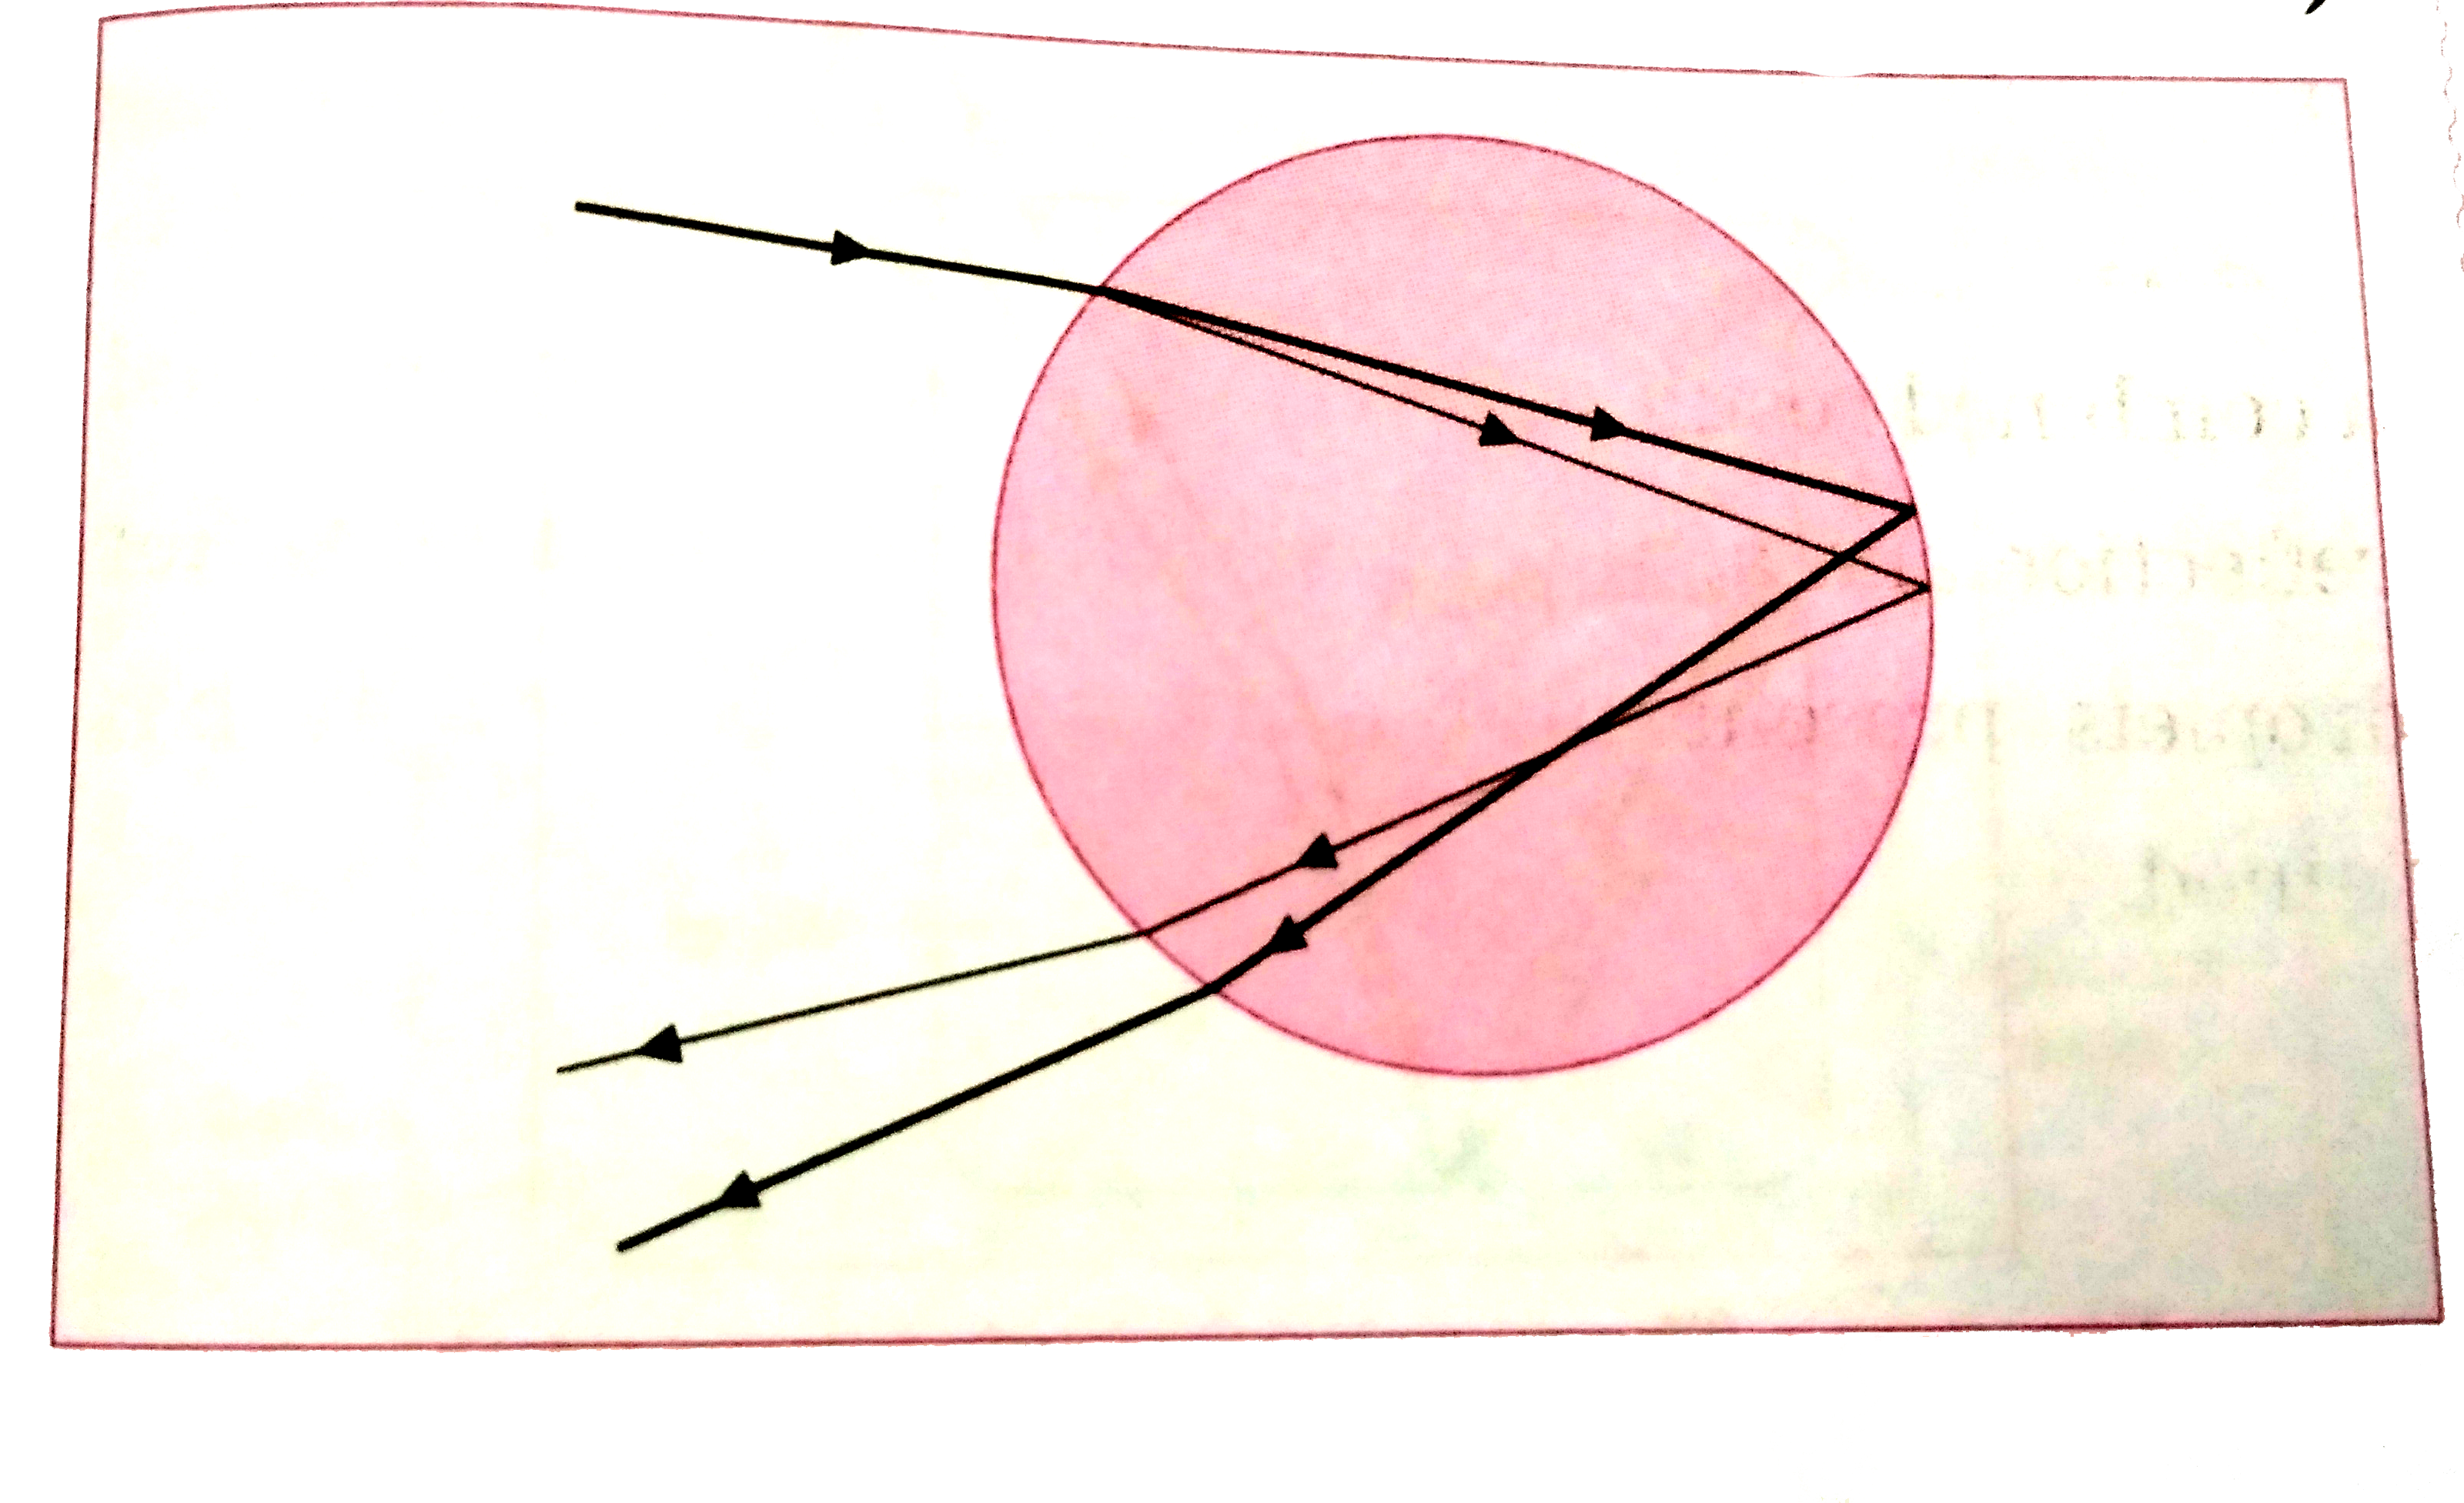
(a) Identify and write the natural process shown in the figure.
b. List the phenomena which are observed in this process.
c. Redraw the diagram and show the above phenomena in it.
View Solution
