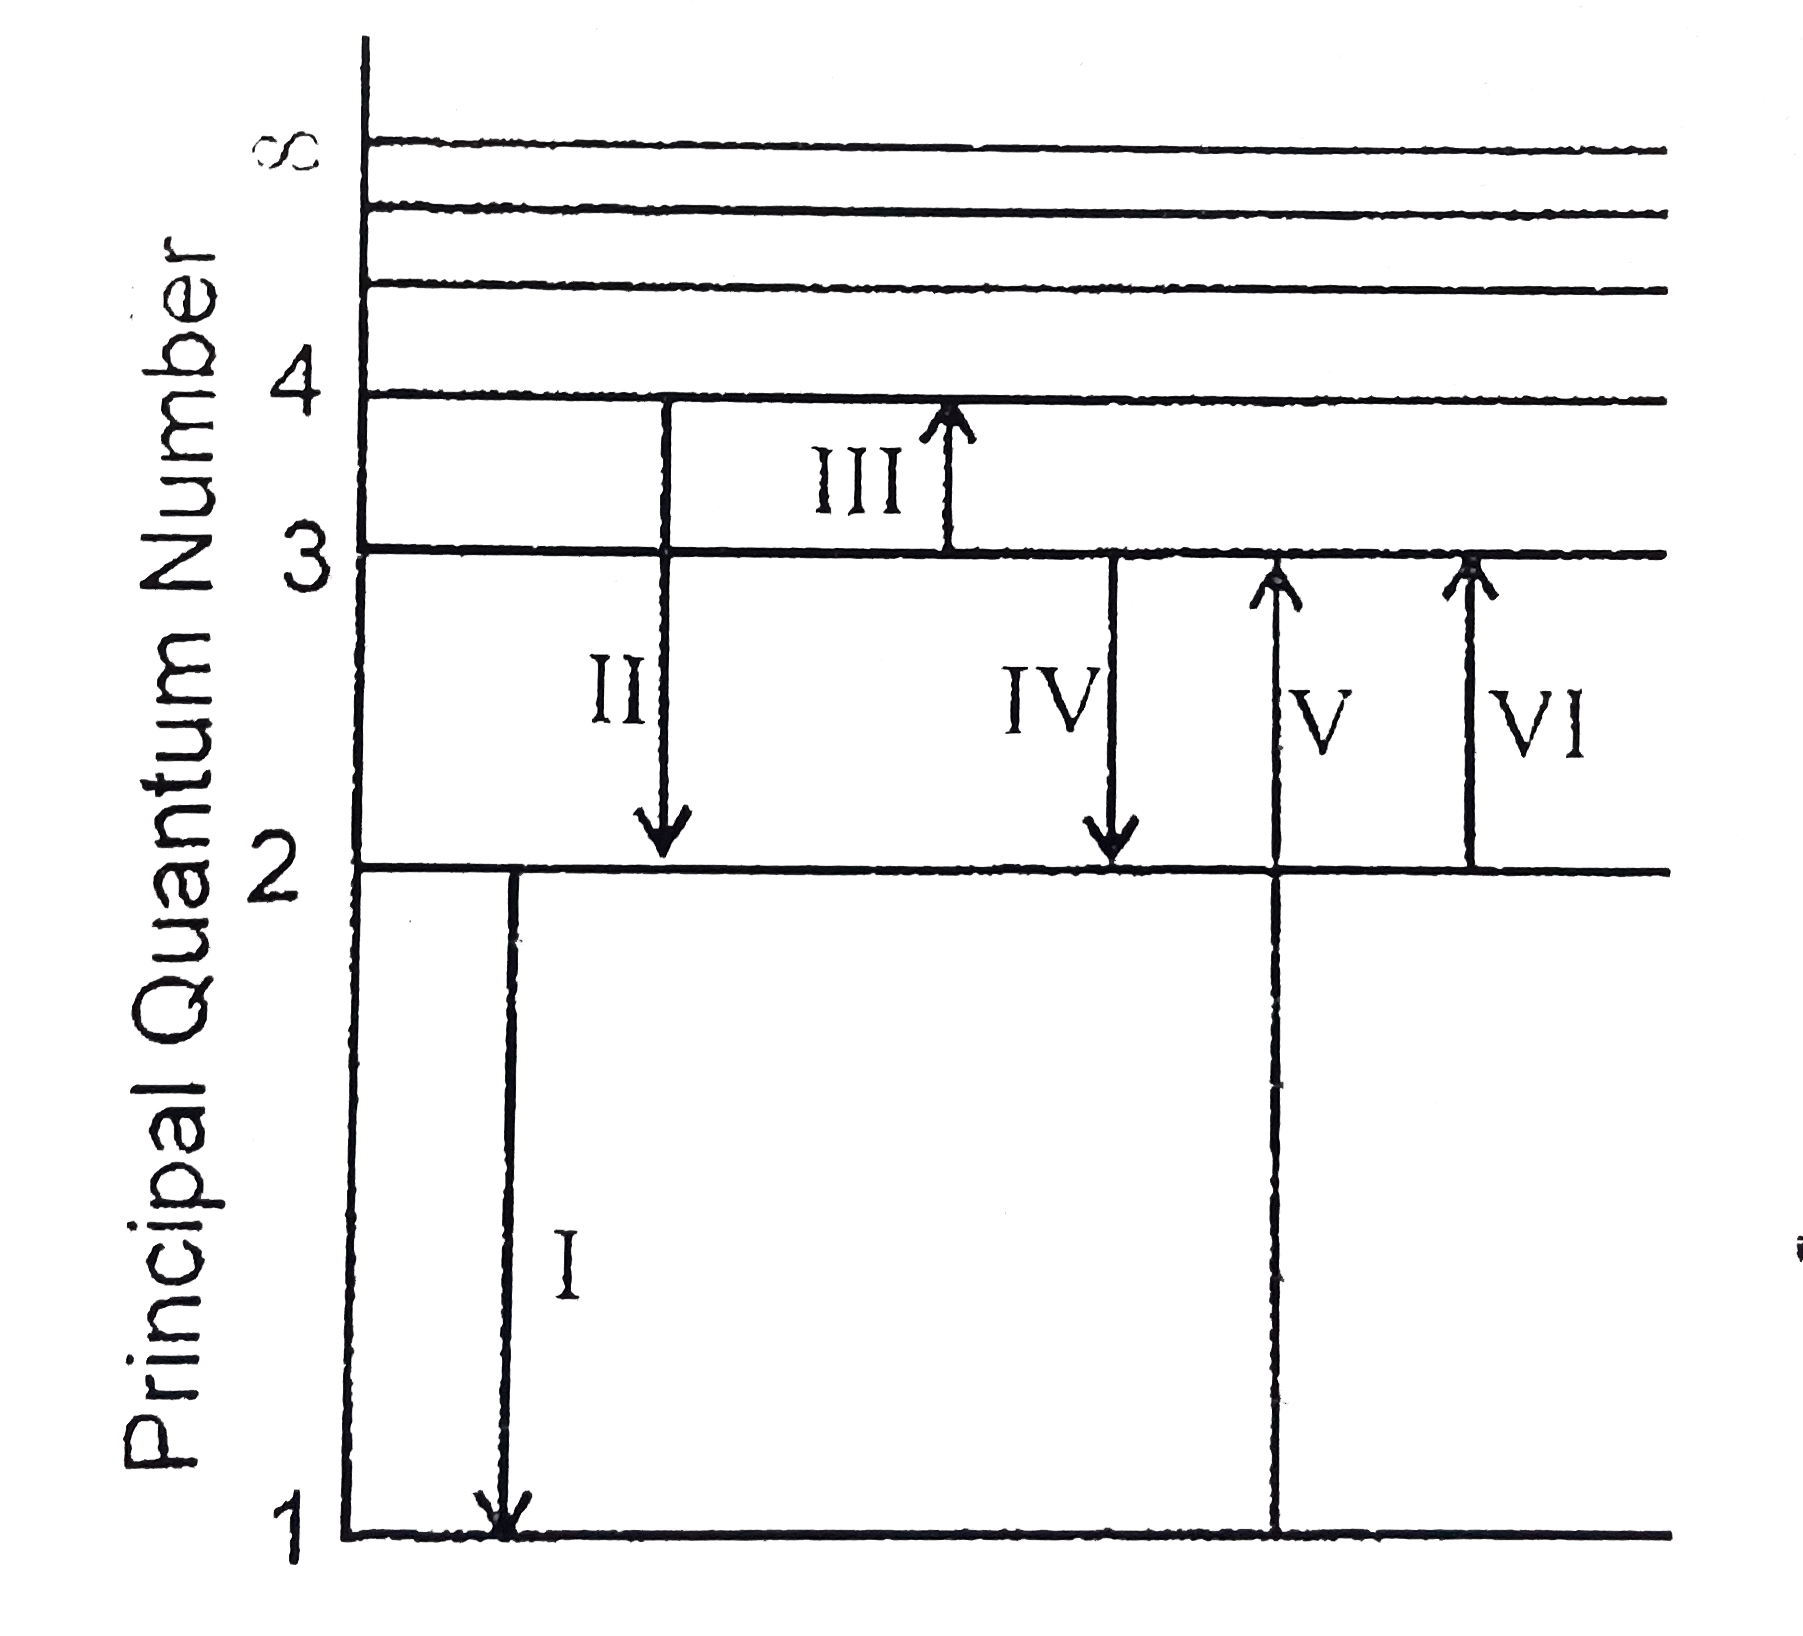
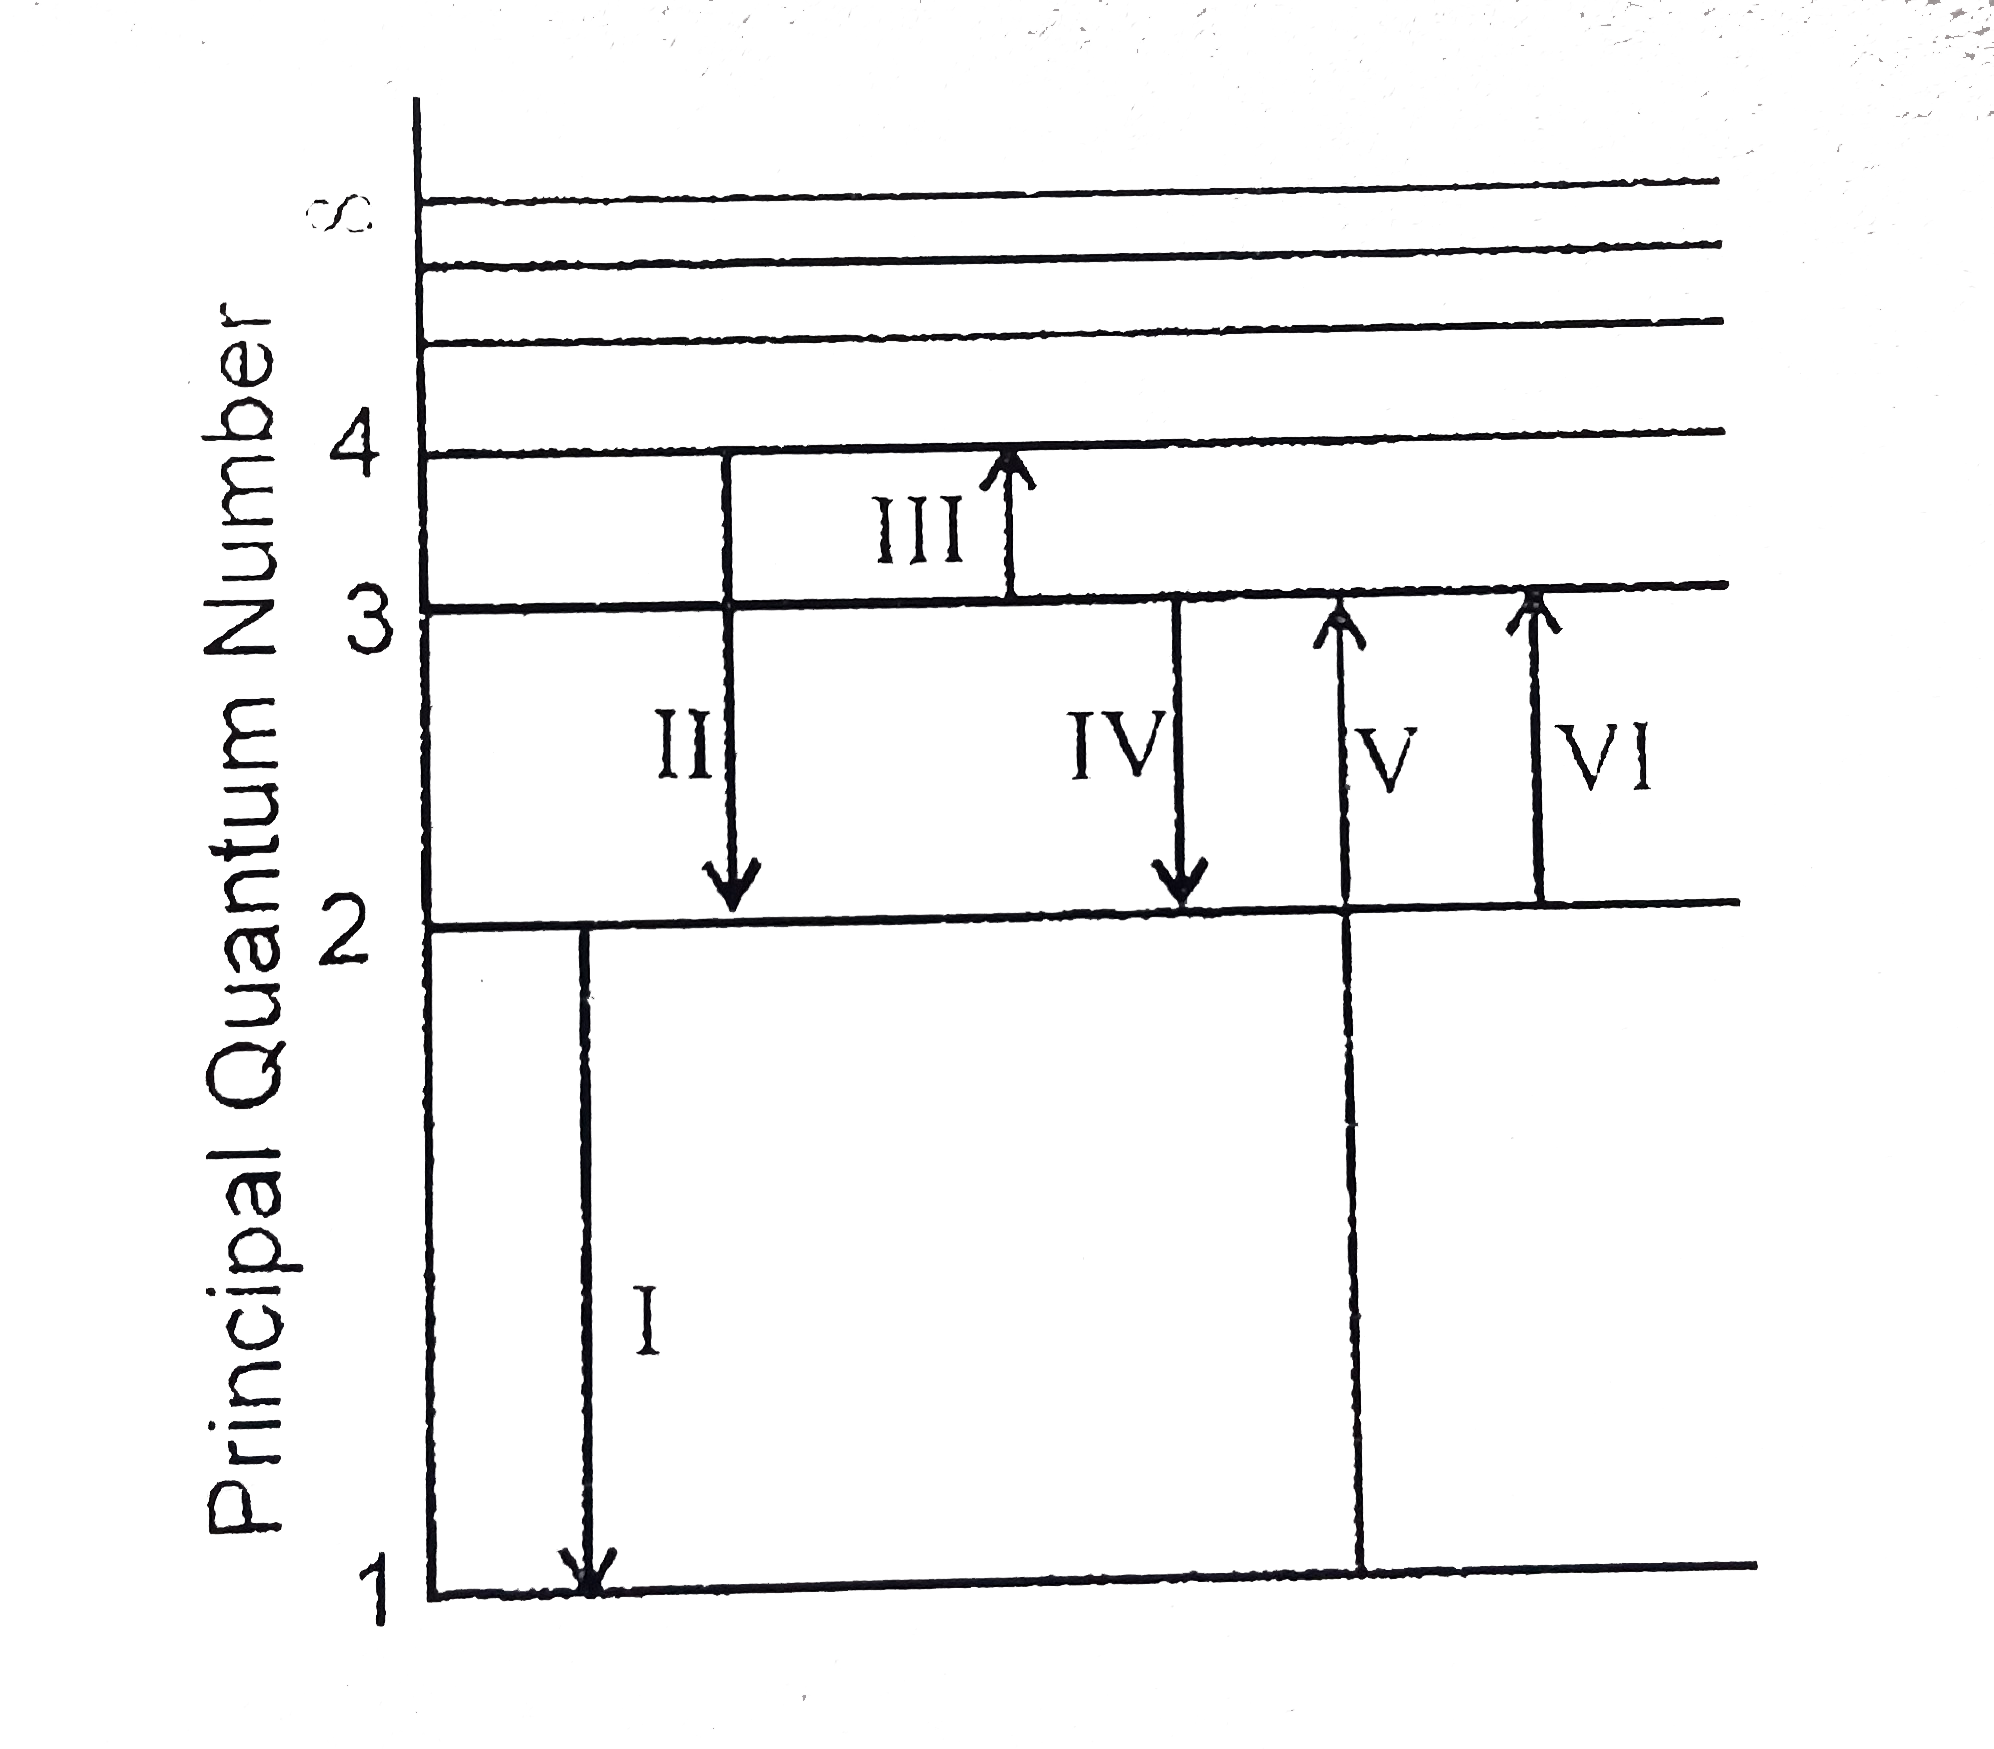
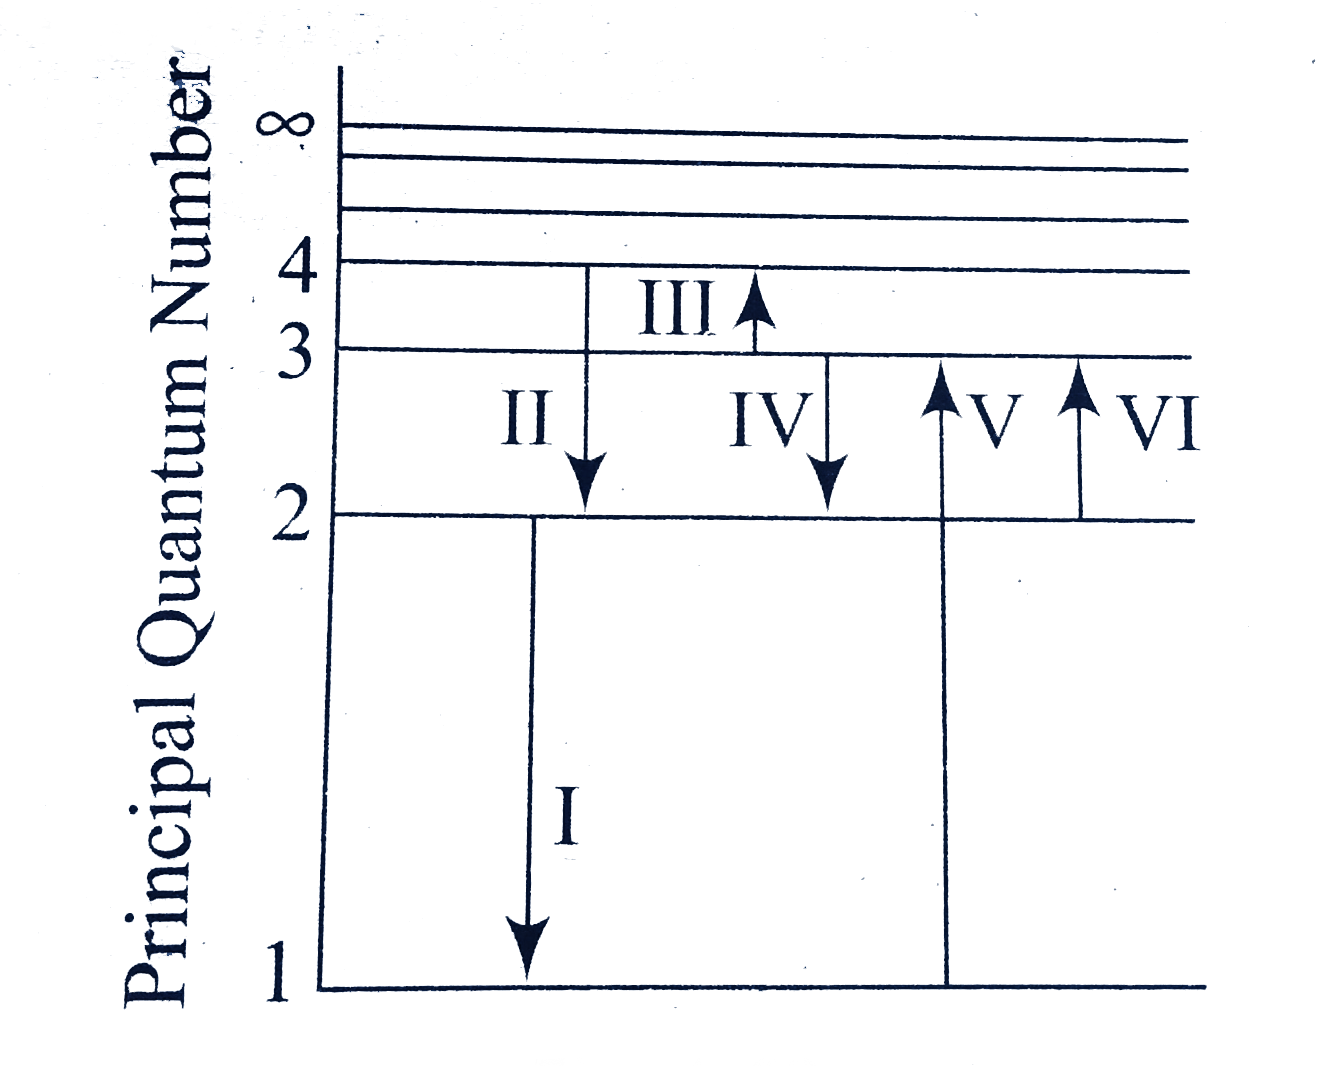
The figure shows an energy level diagram for the hydrogen atom. Several transition are marked as I, II, III, …………. The diagram is only indicative and not to scale.

The transition in which a Balmer series photon absorbed is VI
The wavelength of the radiation involved in transition II is 486 nm
IV transition will occur when a hydrogen atom is irradiated with radiation of wavelength 103nm
IV transition will emit the longest wavelength line in the visible portion of the hydrogen spectrum
The correct Answer is:A, B, D
For Balmer series, n1=2(lower)n2=3,4(higher)……
∴ In transition (VI), photon of Balmer series is absorbed.
In transition II
E2=−3.4eV,E4=−0.85eV
△E=2.55eV
△E=hcλ⇒λ=hc△E
λ=486nm
Wavelength of radiation =103nm=1030A∘
∴△124001030≈12.0eV
So difference of energy should be 12.0eV (approx.)
Hence n1=1 and (n2=3
(−13.6)eV(−1.51)eV
∴ Transition is V.
For longest wavelength, energy difference should be minimum.
So, in visible portion of hydrogen atom, minimum energy emitted is in transition IV.
Topper's Solved these Questions
- TEST PAPERSBOOK - FIITJEECHAPTER - TEST PAPERSEXERCISE - PHYSICS
747 Videos
- SIMPLE HARMONIC MOTIONBOOK - FIITJEECHAPTER - SIMPLE HARMONIC MOTIONEXERCISE - Assignment Problems (Objective) (Level-II)
20 Videos
- WORK, ENERGY AND POWER BOOK - FIITJEECHAPTER - WORK, ENERGY AND POWER EXERCISE - COMPREHENSIONS ( Comprehension-II)
5 Videos
Similar Questions
The figure shows an energy level diagram for the hydrogen atom. Several transitions are marked as I, II, III,_____. The diagram is only indicative and not be scale.

Which transition will occur when a hydrogen atom is irradiated with radiation of wavelength 103nm.
View SolutionThe figure shows an energy level diagram for the hydrogen atom. Several transitions are marked as I, II, III,_____. The diagram is only indicative and not be scale.

Which transition will occur when a hydrogen atom is irradiated with radiation of wavelength 103nm.
View Solution
Knowledge Check
The figure shows an energy level diagram for the hydrogen atom. Several trasitions are marked as I,II,III, …… The diagram is only indicative and not to scale. Then,
(##MTG_WB_JEE_CHE_MTP_01_E01_040_Q01.png" width="80%">AThe transition in which a Balmer series photon absorbed is VI.Bthe wavelength of te radiation involved in transition II is 486 nm.Ctransition IV will occur when a hydrogen atom is irradiated with radiation of wavelength 103 nm.Dtransition IV will emit the longest wavelength line in the visible portion of the hydrogen spectrum.The figure shows an energy level diagram for the hydrogen atom. Several transitions are marked as I, II, III,_____. The diagram is only indicative and not be scale.

Which transition will occur when a hydrogen atom is irradiated with radiation of wavelength 103nm.AIBIICIVDVThe figure shows an energy level diagram for the hydrogen atom. Several transitions are marked as I, II, III,_____. The diagram is only indicative and not be scale.

In which transitions is a Balmer photn absorbed?AIIBIIICIVDVI
The figure shows an energy level diagram for the hydrogen atom. Several transitions are marked as I, II, III,_____. The diagram is only indicative and not be scale.

In which transitions is a Balmer photn absorbed?
View SolutionThe figure shows an energy level diagram for the hydrogen atom. Several transitions are marked as I,II,III ,______, the diagram is only indicative and not to scale.
_E01_150_Q01.png) .
.
Which transition involves the longest wavelength line in the visible portion of the hydrogen spectrum
View SolutionPertain to the following statement and figure

The figure above shown level diagram of the hydrogen atom. Serveral transition are market as I, II, III, … The diagram is only indicative and not to scale.
The wavelength of the radiation involved in transition II is:
View SolutionThe figure shows an energy level diagram for the hydrogen atom. Several transitions are marked as I,II,III ,______, the diagram is only indicative and not to scale.
_E01_150_Q01.png) .
.
Which transition involves the longest wavelength line in the visible portion of the hydrogen spectrum
View SolutionPertain to the following statement and figure

The figure above shown level diagram of the hydrogen atom. Serveral transition are market as I, II, III, … The diagram is only indicative and not to scale.
The wavelength of the radiation involved in transition II is:
View Solution
