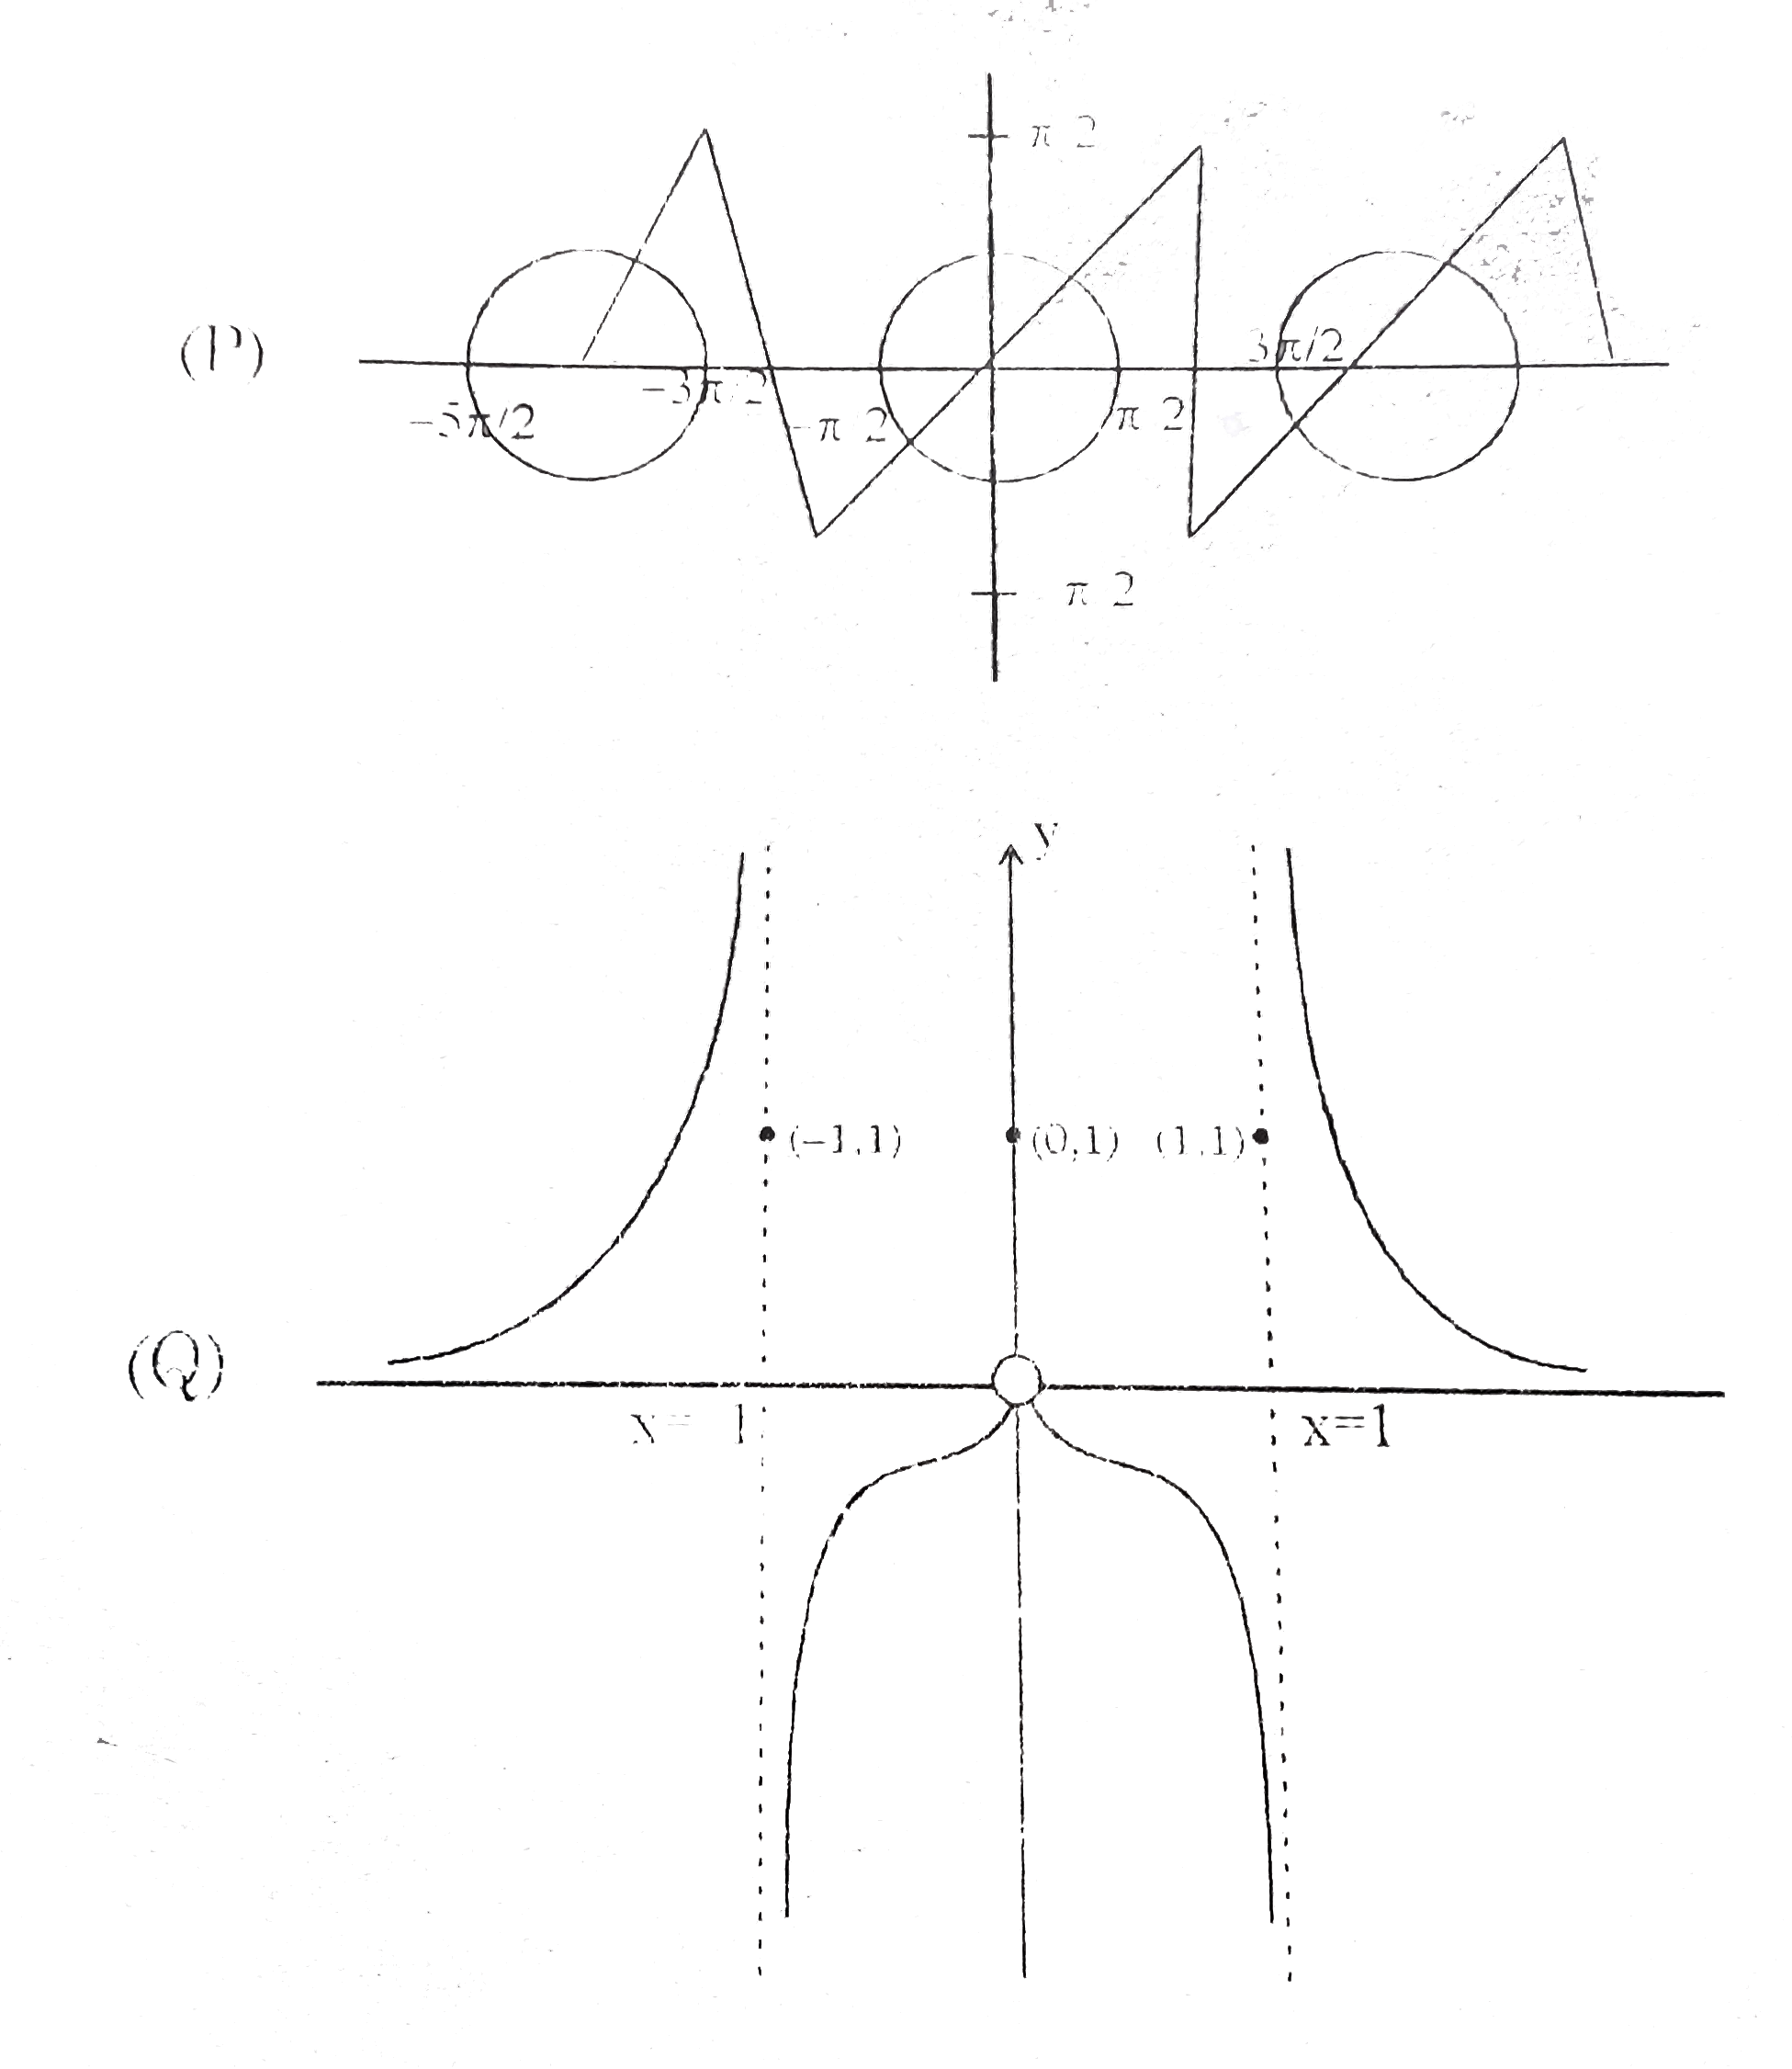
PQRS3241
PQRS4112
PQRS3412
PQRS4431
The correct Answer is:C

(R ) limx→0(1+x1n(1+b2))1/x=2bsin2θ,b>0
⇒1+b2=2bsin2θ⇒b2−2bsinθ+1=0
D≥0⇒sin4θ=1⇒sinθ=±1
⇒θ=±π2,3π2,5π2
therefore Sum of all possible value of θ=4π
∴k=4
(S) for a limit of the function to exist α+β=1
since function gain form of 1∞we≥t
α=−3,β=4
∴(4β+3α)=7⇒Q
Topper's Solved these Questions
- TEST PAPERSBOOK - ALLENCHAPTER - TEST PAPERSEXERCISE - MATHEMATICS
51 Videos
- TEST PAPERSBOOK - ALLENCHAPTER - TEST PAPERSEXERCISE - CHEMISTRY
1 Videos
- TEST PAPERSBOOK - ALLENCHAPTER - TEST PAPERSEXERCISE - part-2 Mathematic
18 Videos
- TEST PAPERBOOK - ALLENCHAPTER - TEST PAPEREXERCISE - CHEMISTRY SECTION-II
8 Videos
- VECTOR ALGEBRABOOK - ALLENCHAPTER - VECTOR ALGEBRAEXERCISE - All Questions
1 Videos
Similar Questions
If a be sum of the odd numbered terms and b the sum of even numbered terms of the expansion (1+x)n,n ε N then (1−x2)n is equal to
View SolutionLet Sn=4n∑k=1(−1)k(k+1)2k2. Then Sn can take values
View SolutionConsider a hyperbola H : x2−y2 =k and a parabola P:y=x2 then identify the correct statements(S)
View SolutionThe molar mass of a substance , each molecule of which contains 9 C atoms , 13 H-atoms and 3.32×10⁻²³ g of other component is (NA=6.022×10²³)
View SolutionFind the value of a, for which point P(a3,2) is the midpoint of the line segment joining the points Q(−5,4)andR(−1,0).
View SolutionIdentify the cell organelle 'A' :-
ltimg src="https://d10lpgp6xz60nq.cloudfront.net/physics_images/ALN_BIO_C10_E08_018_Q01.png" width="80%"gt
View SolutionHow many lines of symmetry does the above figure have ?
View SolutionWhich of the following are correct chain isomers of butane ? (i)
View SolutionDetermine the point of symmetry of a regular hexagon.
View SolutionDtermine the images of the following figure about the given line :
View SolutionMatch the following Column A to Column B

View SolutionMatch the following Column A to Column B

View SolutionMatch the following Column A to Column B

View SolutionFind the area of the figure given below.

View SolutionThe area of the shaded part in the figure given below is ______.

View SolutionThe inequation represented by the graph given below is :
View Solution

