A ball is projected vertically up from the ground surface with an initial velocity of u=20m/s. O is a fixed point on the line of motion of the ball at a height of H=15m from the ground. Plot a graph showing variation of distance (s) of the ball from the fixed point O, with time (t). [Take g=10m/s2]. Plot the graph for the entire time of flight of the ball.
![A ball is projected vertically up from the ground surface with an initial velocity of u = 20 m//s. O is a fixed point on the line of motion of the ball at a height of H = 15 m from the ground. Plot a graph showing variation of distance (s) of the ball from the fixed point O, with time (t). [Take g = 10 m//s2]. Plot the graph for the entire time of flight of the ball.](https://d10lpgp6xz60nq.cloudfront.net/physics_images/IJA_PHY_V01_C02_E01_067_Q01.png)
Text Solution
The correct Answer is:(##IJAPHYV01C02E01067_A01##)
|
Topper's Solved these Questions
- KINEMATICSBOOK - ARIHANTCHAPTER - KINEMATICSEXERCISE - Level 3
33 Videos
- KINEMATICSBOOK - ARIHANTCHAPTER - KINEMATICSEXERCISE - Level 3
33 Videos
- HEAT TRANSFERBOOK - ARIHANTCHAPTER - HEAT TRANSFEREXERCISE - Heat Transfer
45 Videos
- KINETIC THEORY OF GASESBOOK - ARIHANTCHAPTER - KINETIC THEORY OF GASESEXERCISE - Level 3
4 Videos
Similar Questions
Knowledge Check
A ball is projected vertically up with speed 20 m/s. Take g=10m/s2
AIt covers a distance of 5 m in 2nd second of its motionBThe displacement in 2nd and 3rd second are equalCThe distance covered in 2nd and 3rd second are equalDThe average speed for first 4 seconds is zeroA ball is thrown from the ground with a velocity of 20√3 m/s making an angle of 60∘ with the horizontal. The ball will be at a height of 40 m from the ground after a time t equal to (g=10ms−2)
A√2 secB√3 secC2 secD3 secA stone is projected vertically up from a point on the ground, with a speed of 20m/s. Plot the variation of followings with time during the entire course of flight –
AVelocityBSpeedCHeight above the groundDdistance travelled
A ball is projected vertically upward with a velocity 112m/s The time taken by it to return to the point of projection is (g=10m/s2) :
View SolutionA ball is projected vertically up wards with a velocity of 100 m/s. Find the speed of the ball at half the maximum height. (g=10m/s2)
View SolutionA ball is projected vertically up wards with a velocity of 100 m/s. Find the speed of the ball at half the maximum height. (g=10m/s2)
View SolutionA ball is thrown vertically upwards from the top of a tower with a velocity of 10m/s. If the ball falls on the ground after 5 seconds, the height of the tower will be? (use g=10m/s2)
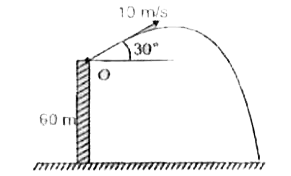
View SolutionA ball is projected from a point O as shown in figure it will strike the ground after (g = 10 m/s2 )

View Solution
