The figure shows y (transverse displacement) vs x (position) graph for a sinusoidal wave travelling along a stretched string. P is power transmitted through a cross section of the string at the instant shown. Plot the graph of P versus x.

The correct Answer is:(##IJAPHYV01C13E01048_A01##)
Step by step video, text & image solution for The figure shows y (transverse displacement) vs x (position) graph for a sinusoidal wave travelling along a stretched string. P is power transmitted through a cross section of the string at the instant shown. Plot the graph of P versus x. by Physics experts to help you in doubts & scoring excellent marks in Class 11 exams.
Updated on:21/07/2023Topper's Solved these Questions
Similar Questions
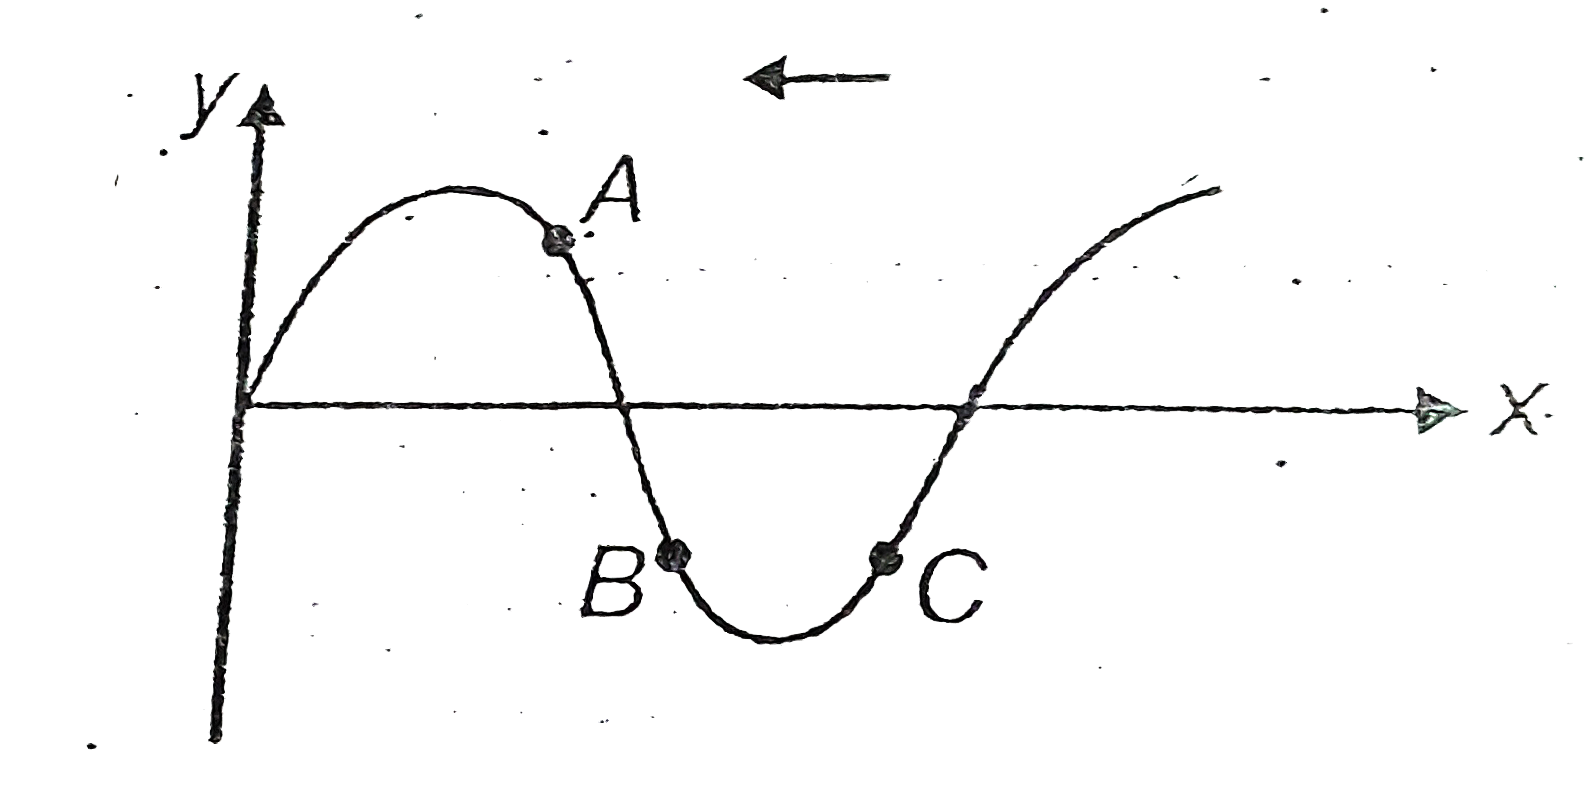
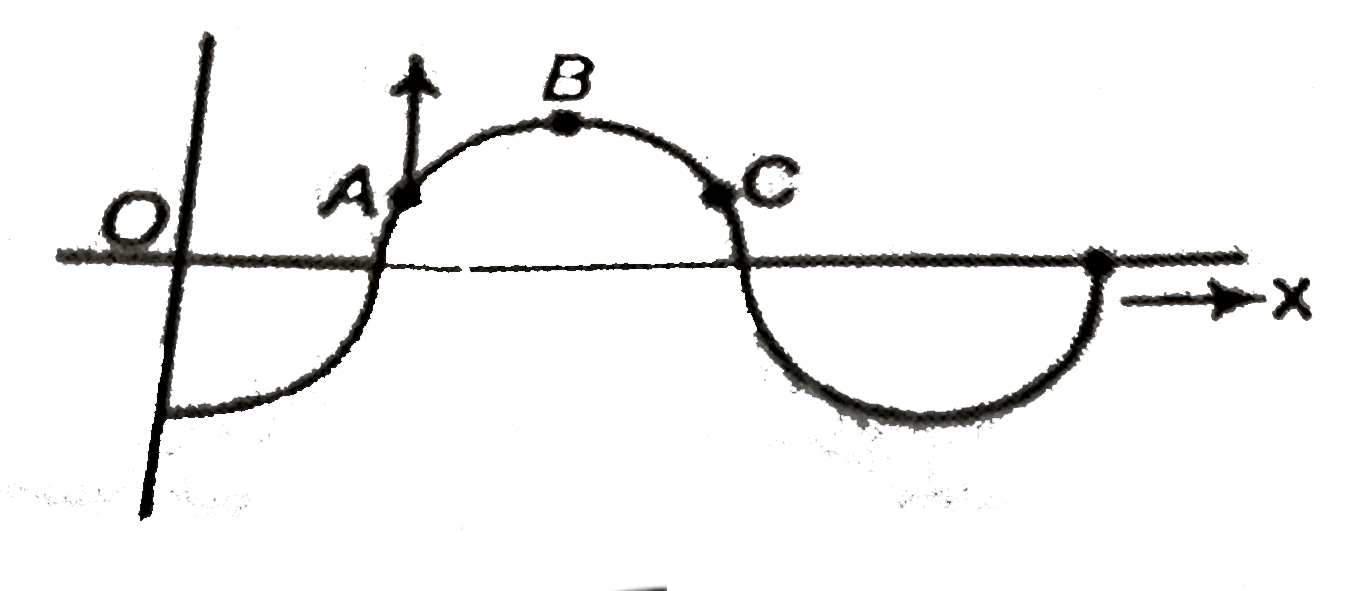
The figure shows a transverse wave travelling in a string in negative x-axis direction. Three points A, B and C are indicated on the string at the instant shown
The correct statement(s) is/are.
View SolutionThe figure shows the y–x graph at an instant for a small amplitude transverse wave travelling on a stretched string. Three elements (1, 2 and 3) on the string have equal original lengths (=Δx). At the given instant-
(i) which element (among 1, 2 and 3) has largest kinetic energy?
(ii) which element has largest energy (i.e., sum of its kinetic and elastic potential energy)
(iii) Prove that energy per unit length ΔEΔx of the string is constant everywhere equal to T(∂y∂x)2 where T is tension the string.

View Solution
Knowledge Check
A transverse wave travelling on a stretched string is is represented by the equation
y=2(2x−6.2t)2+20. Then ,Avelocity of the wave is 3.1m/sBamplitude of the wave is 0.1mCfrequency of the wave is 20HzDwavelength of the wave is 1mA harmonic wave is travelling along +ve x-axis, on a stretched string. If wavelength of the wave gets doubled, then
Afrequency of wave may changeBwave speed may changeCboth frequency and speed of wave may changeDonly frequency will change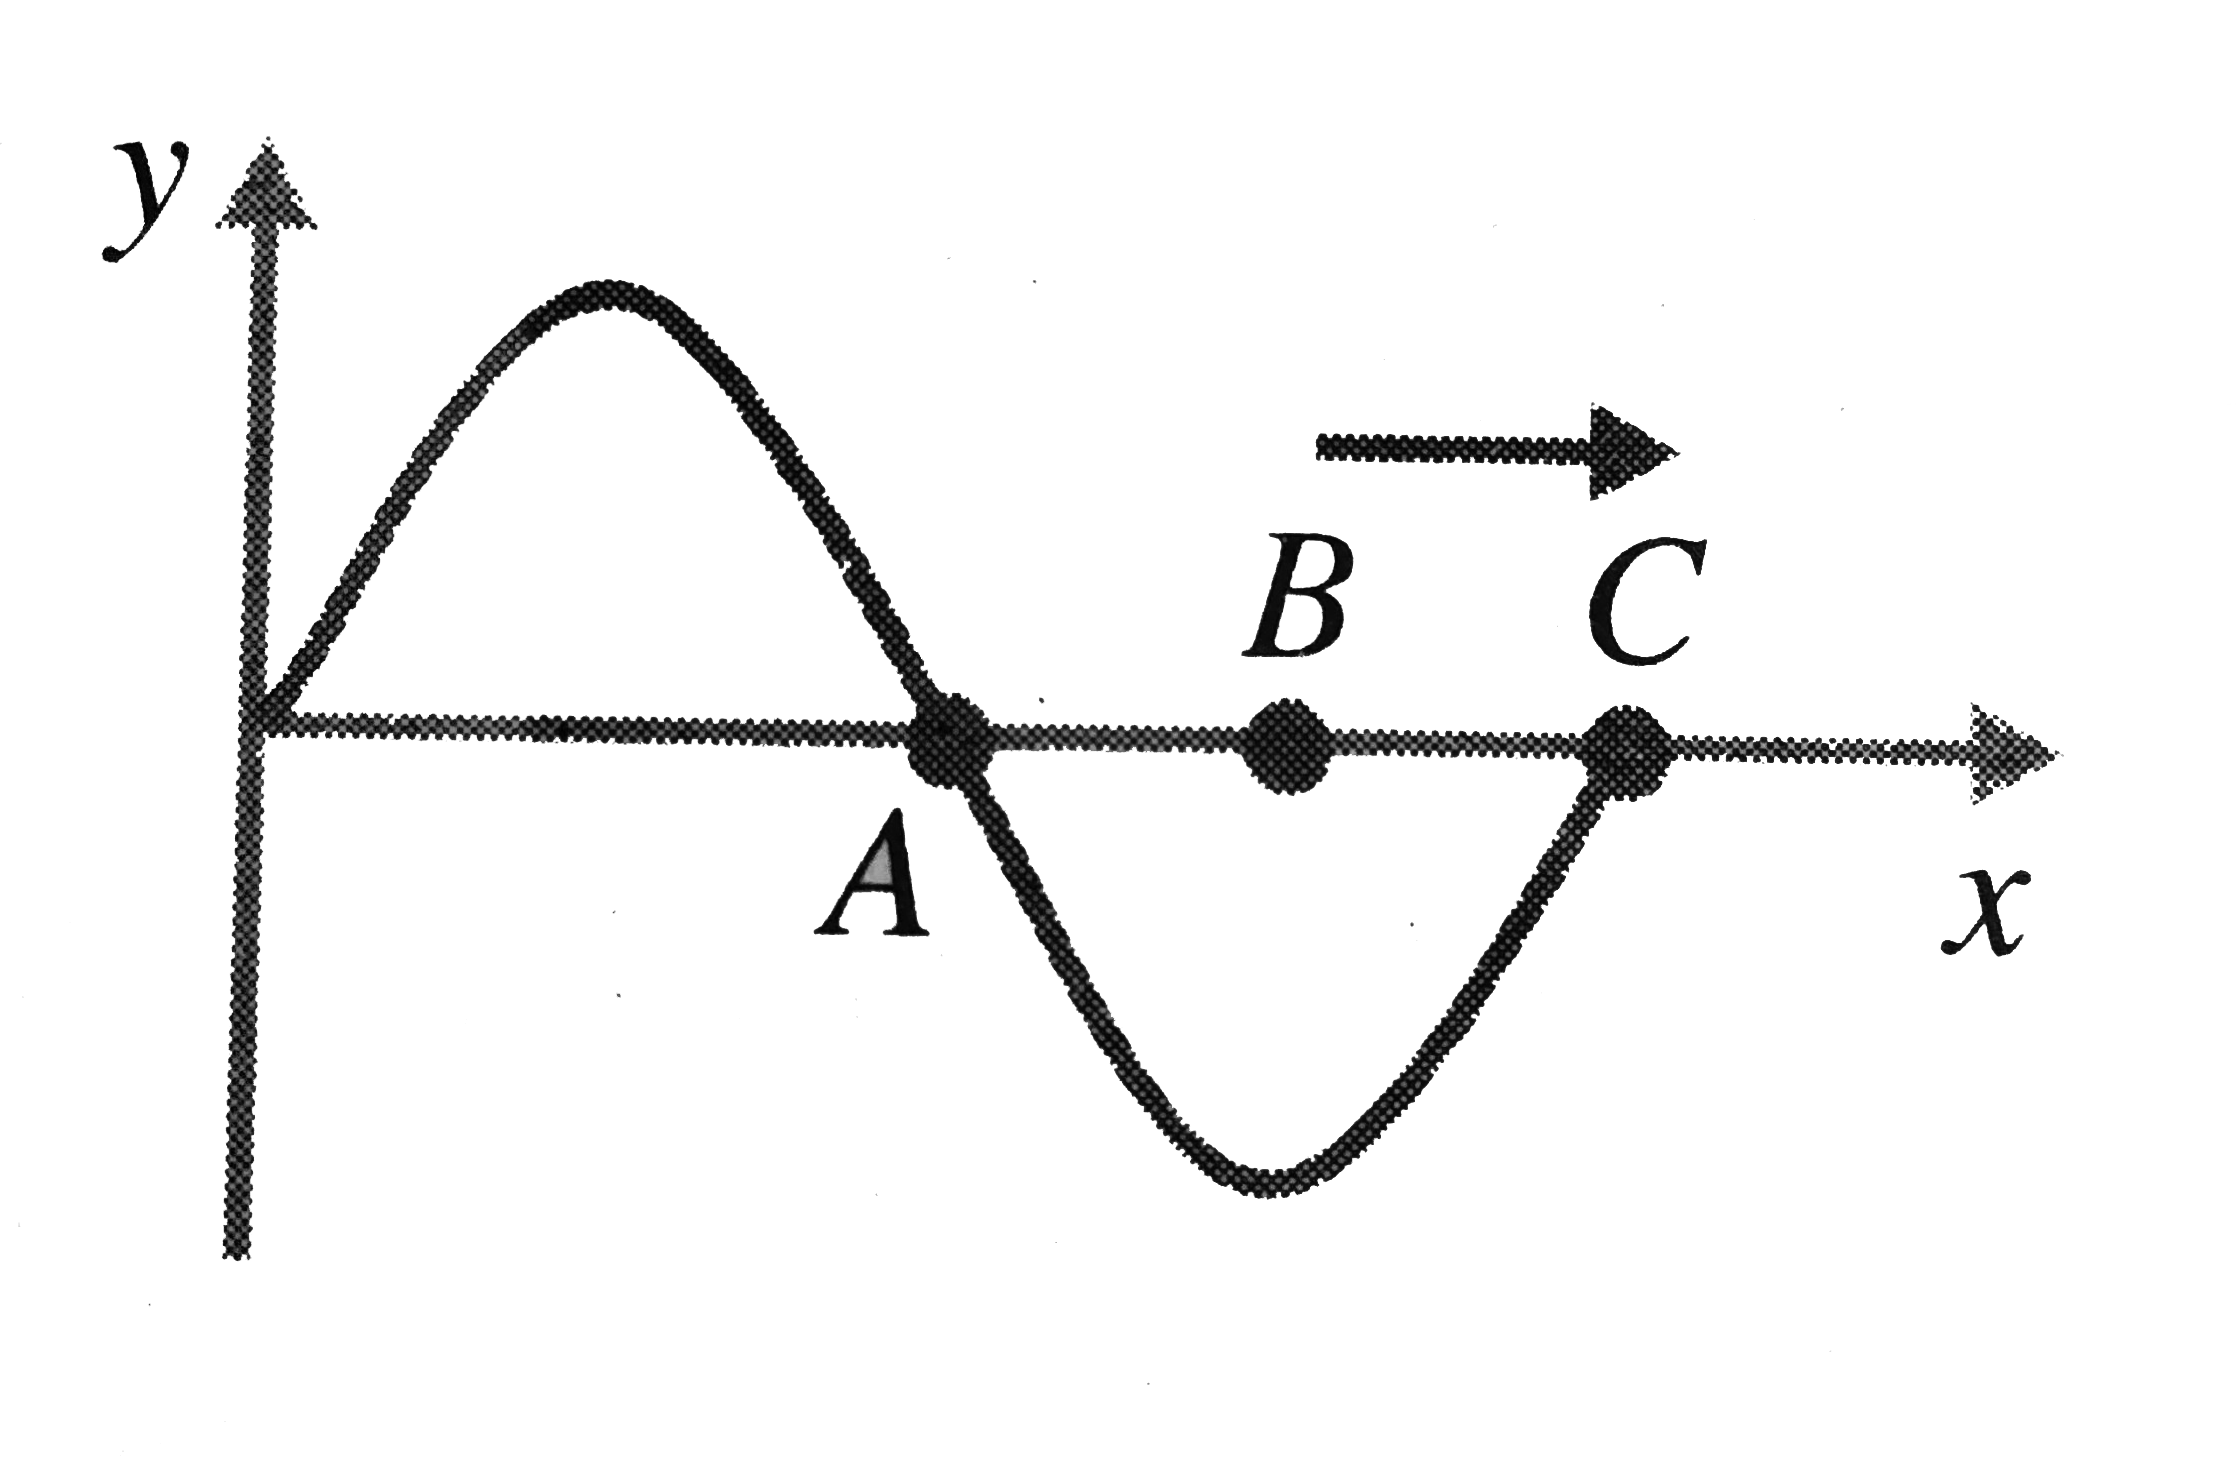
The figure shows an instantaneous displacement position graph of a sound wave travelling along the positive x-axis Identify the points of
i.Maximum pressure,
ii. Minimum pressure and
iii. Atmospheric pressure (or normal pressure.)A(i) A, (ii) C, (iii)BB(i) A, (ii) B, (iii)CC(i) B, (ii) A, (iii)CD(i) B, (ii) C, (iii)A
The equation of a wave travelling on a stretched string along the x-axis is y=ae−(bx+ct). The direction of propagation of wave is
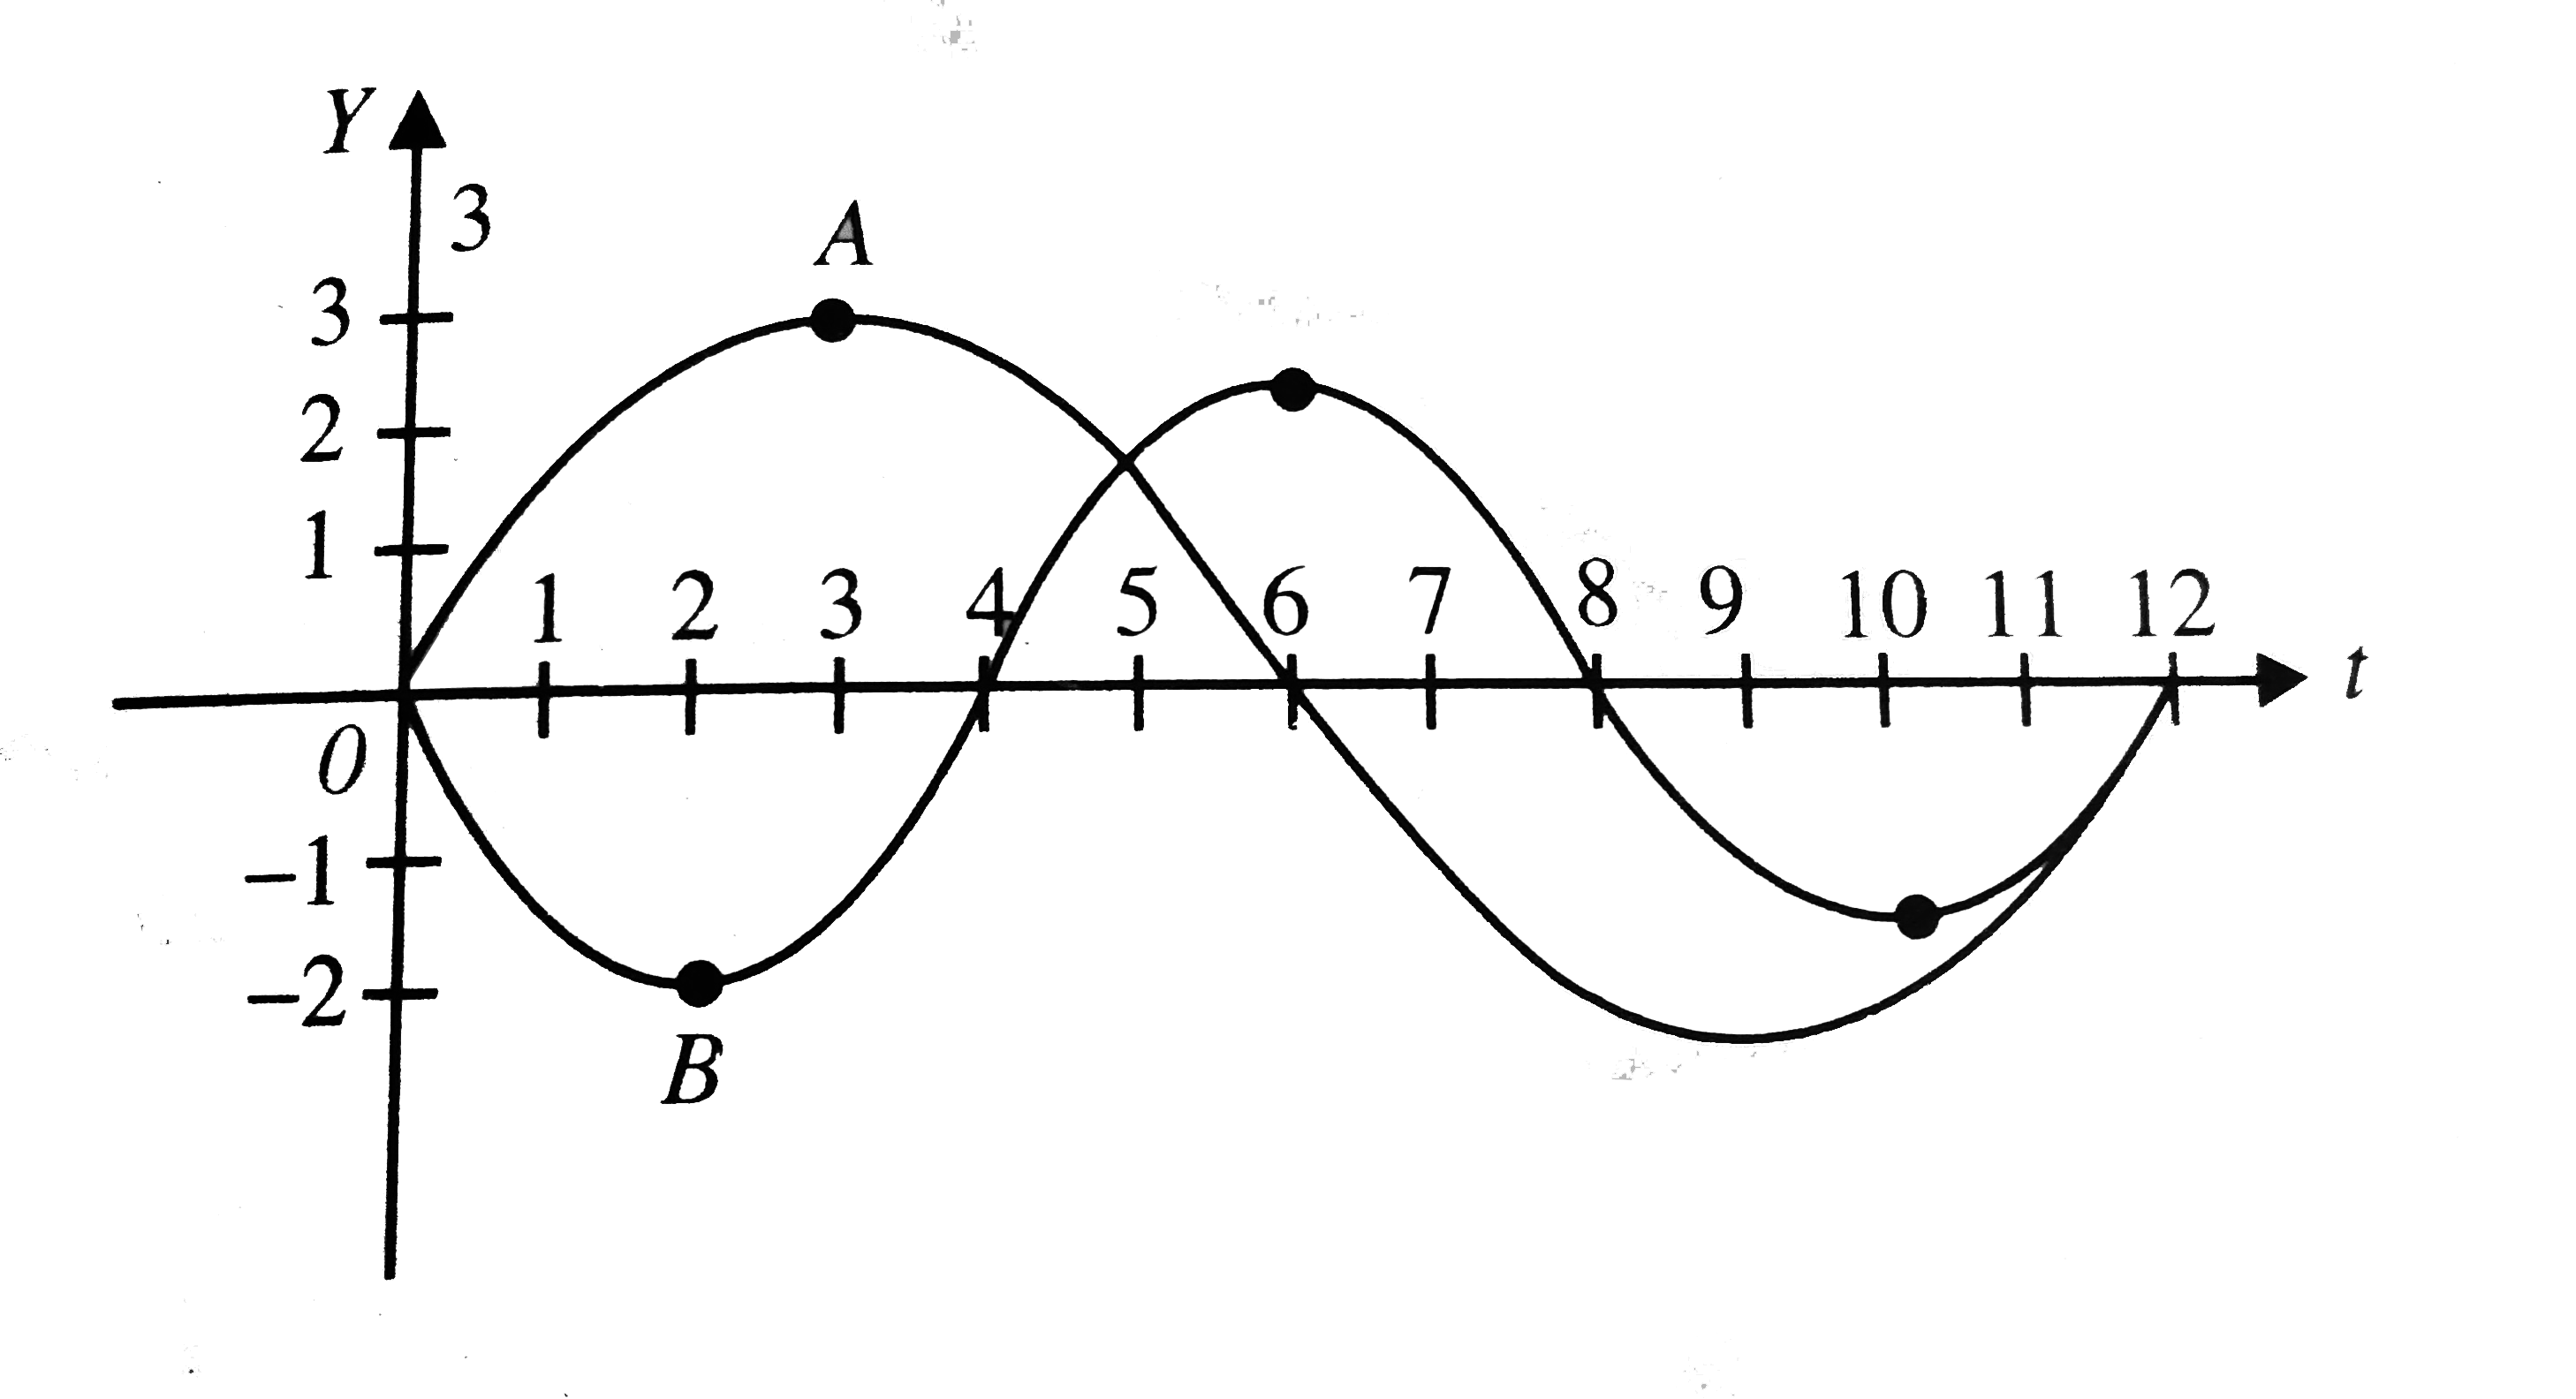
View SolutionThe displacement vs time graph for two waves A and B which travel along the same string arre shown in the figure. Their intensity ratio IA∣IB is
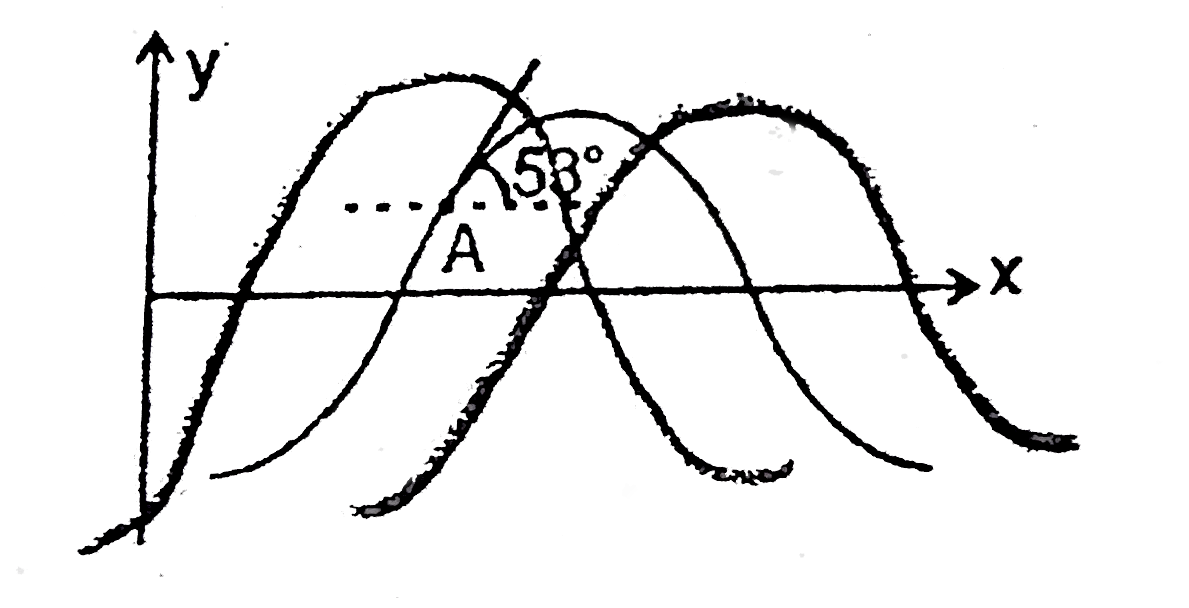
View Solutiony−x curve at an instant for a wave travelling along x−axis on a string is shown. Slope at the point A on the curve, as shown, is tan53∘.
View SolutionAt any instant a wave travelling along the string shown in figure. Here, point A is moving upward. Which of the following statement is true?
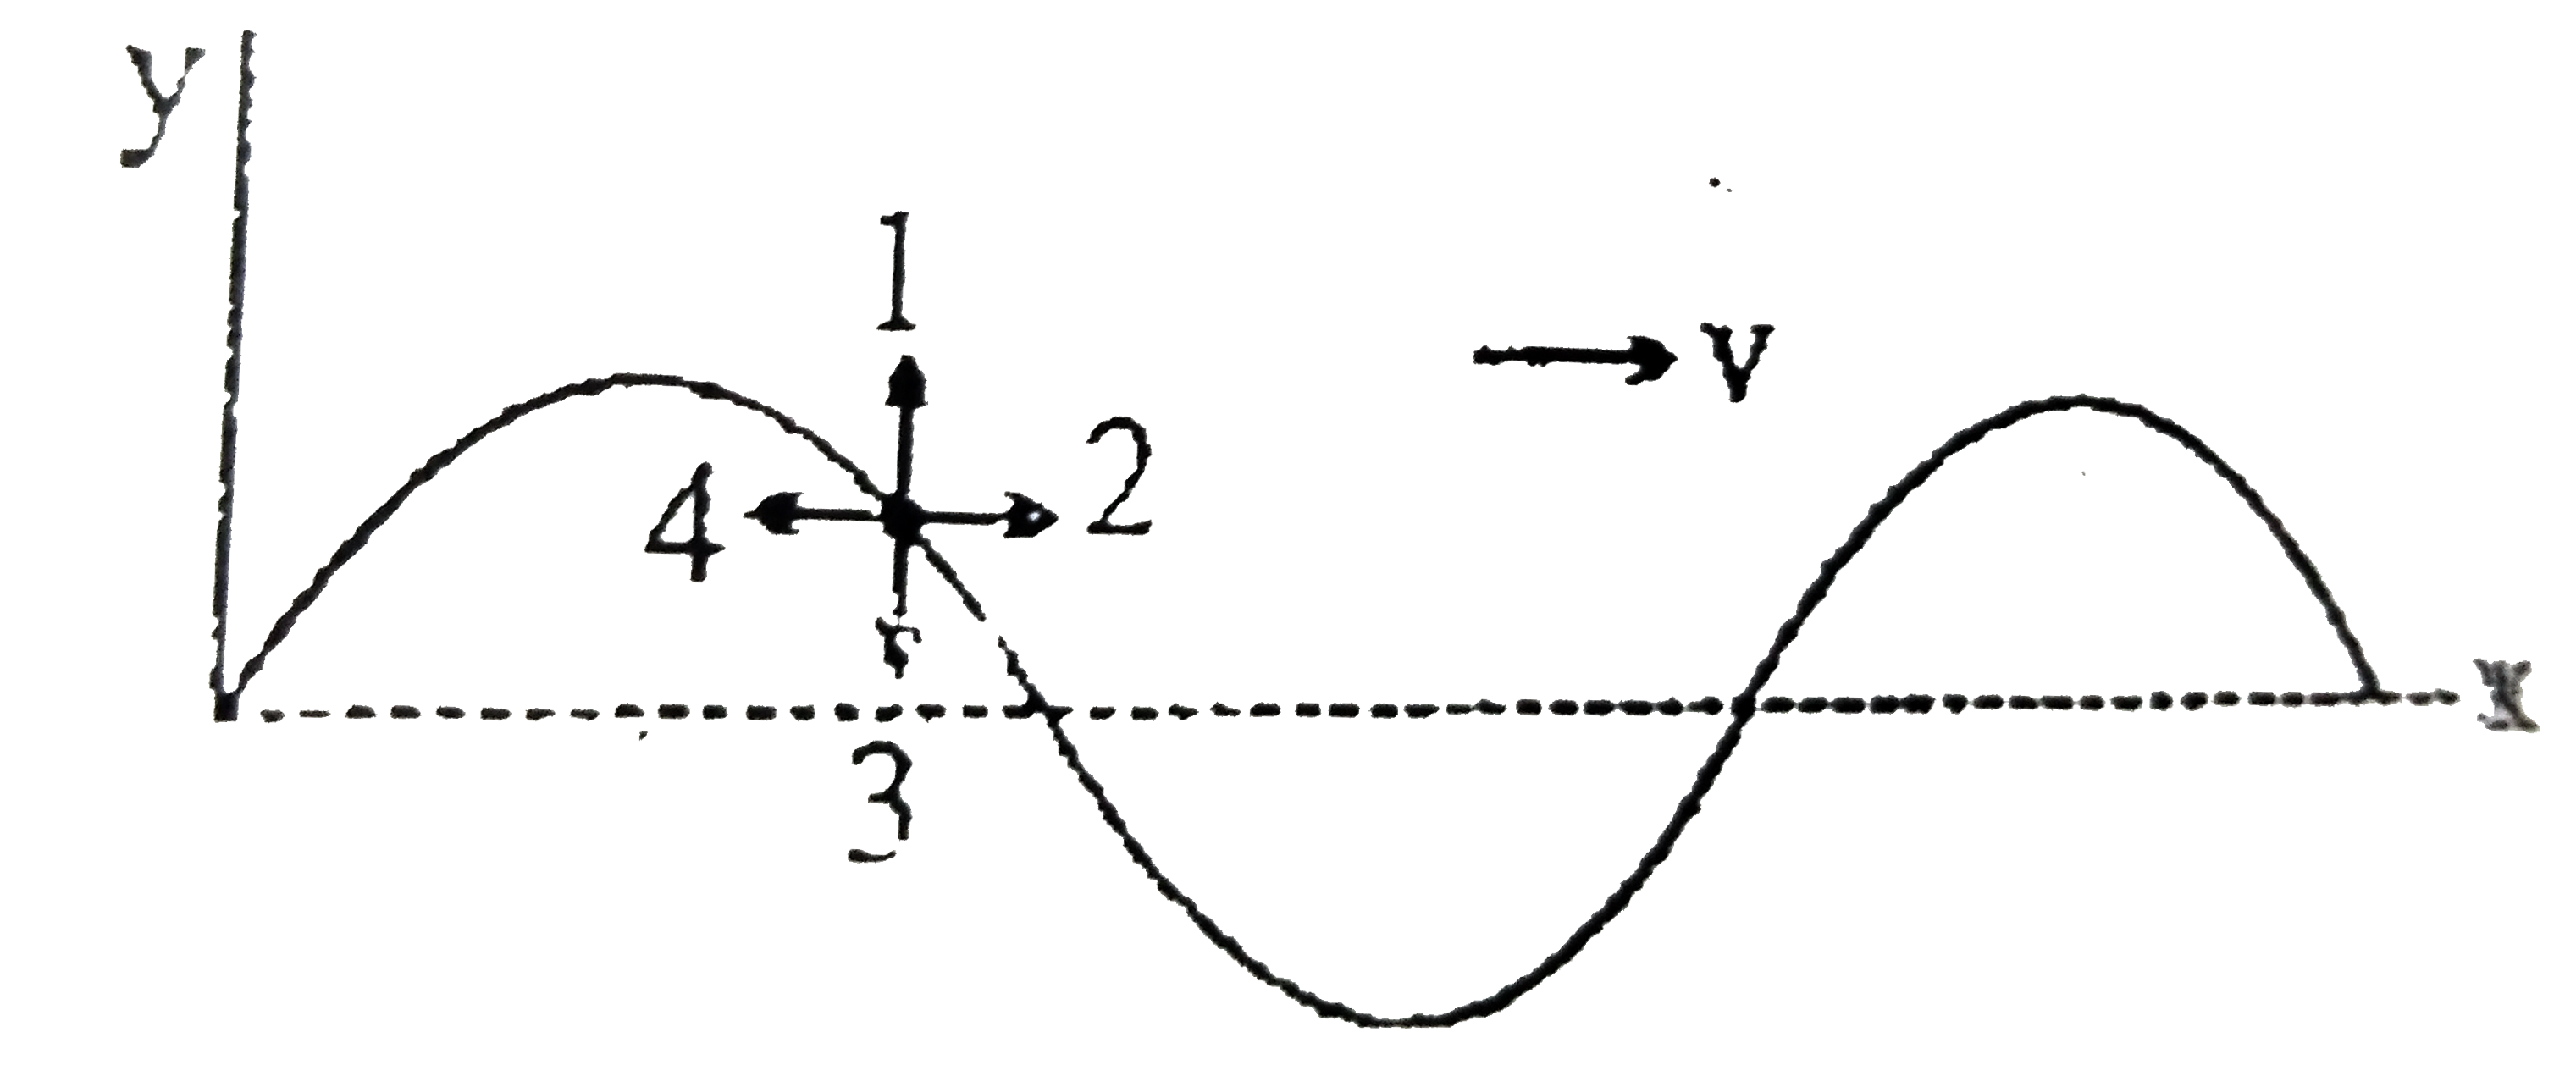
View SolutionA sinusoidal transverse progressive wave travelling on stretched string along x axis Choose appropriate number for direction of velocity and acceleration respectively force particle P shown in the diagram.
View Solution
