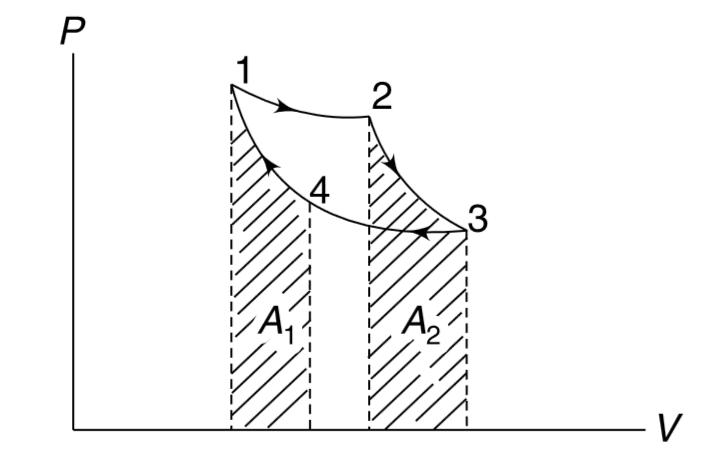
The figure shows a Carnot cycle for an ideal gas on a P-V diagram. Which of the areas A1 or A2 is larger?
Text Solution
The correct Answer is:A1=A2
|
Topper's Solved these Questions
- FIRST LAW OF THERMODYNAMICSBOOK - ARIHANTCHAPTER - FIRST LAW OF THERMODYNAMICSEXERCISE - Level 2
34 Videos
- FIRST LAW OF THERMODYNAMICSBOOK - ARIHANTCHAPTER - FIRST LAW OF THERMODYNAMICSEXERCISE - Level 3
6 Videos
- ELASTICITYBOOK - ARIHANTCHAPTER - ELASTICITYEXERCISE - Level 3
1 Videos
- FLUIDSBOOK - ARIHANTCHAPTER - FLUIDSEXERCISE - All Questions
70 Videos
Similar Questions
Knowledge Check
Figure. Shows the P−V diagram for a Carnot cycle. In this diagram
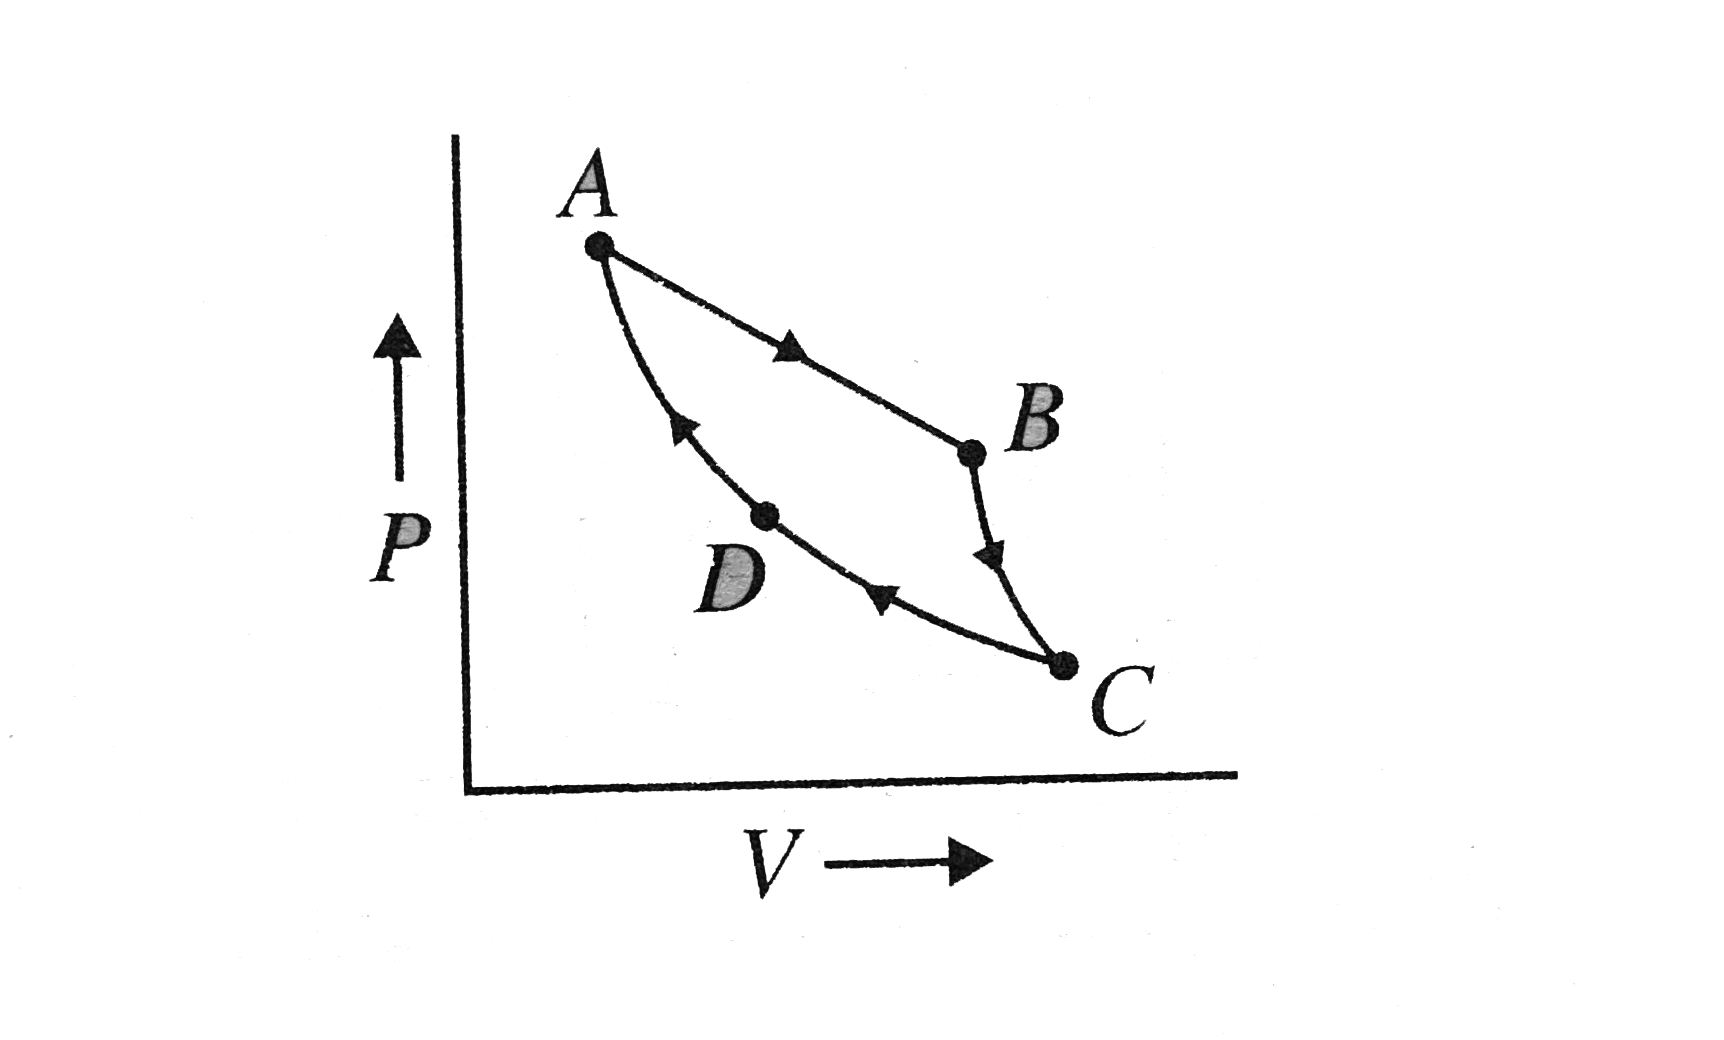 Acurve AB represents isothemal process and BC adiabatic processBcurve AB represents adiabatic process and BC isothermal processCcurve CD represents isothermal process and DA adaibatic processDcurve CD represent adiabatic process and DA isothermal process
The given figure shows the P−Vdiagram for a Camot cycle. In this diagram,
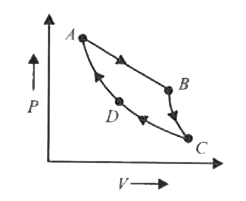 Acurve AB represents isothermal process and BC adiabatic processBcurve AB represents adiabatic process and BC isothermal processCcurve CD represents isothermal process and DA adiabatic processDcurve CD represents adiabatic process and DA isothermal process.
The figure shows P - V diagram of a thermodynamic cycle
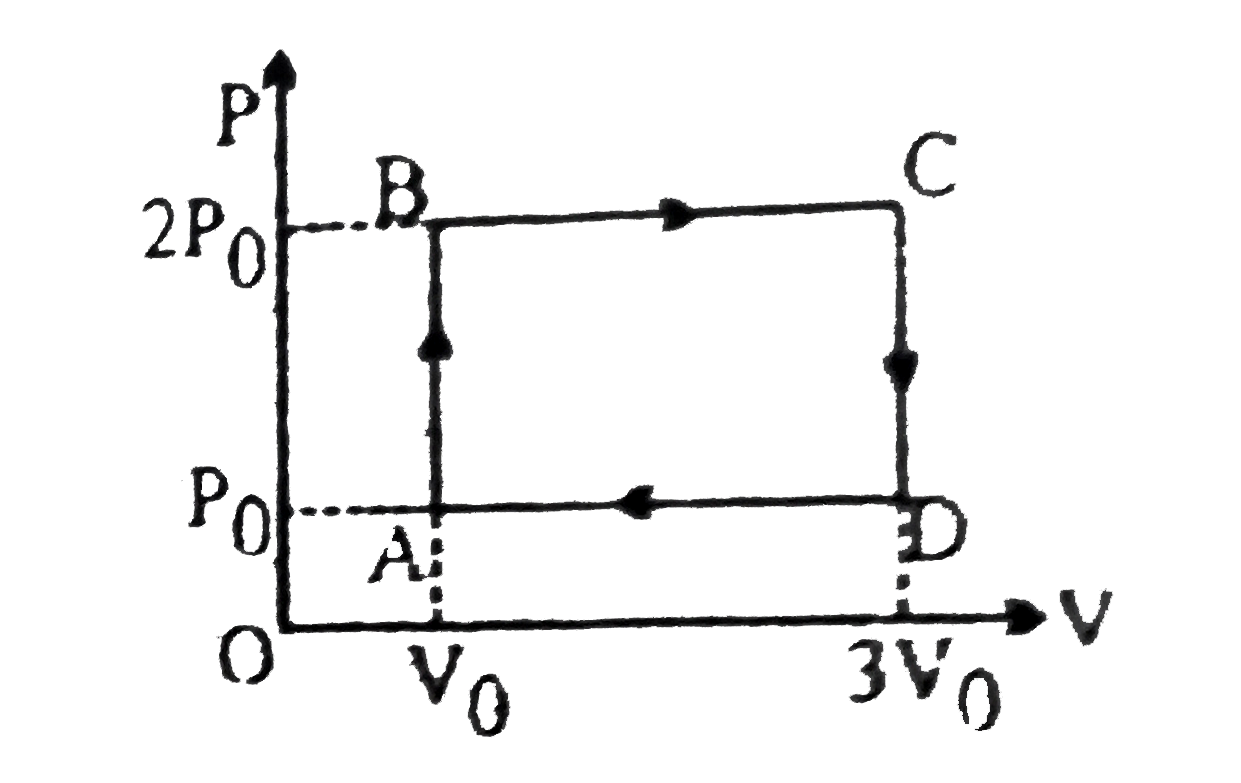
The work done in the cycle isA2P0V0B3P0V0CP0V0D6P0V0
Three batteries are connected as shown in figure. Reading of ideal ammeters A1,A2 & A3 are :

View SolutionThe figure shows P - V diagram of a thermodynamic cycle
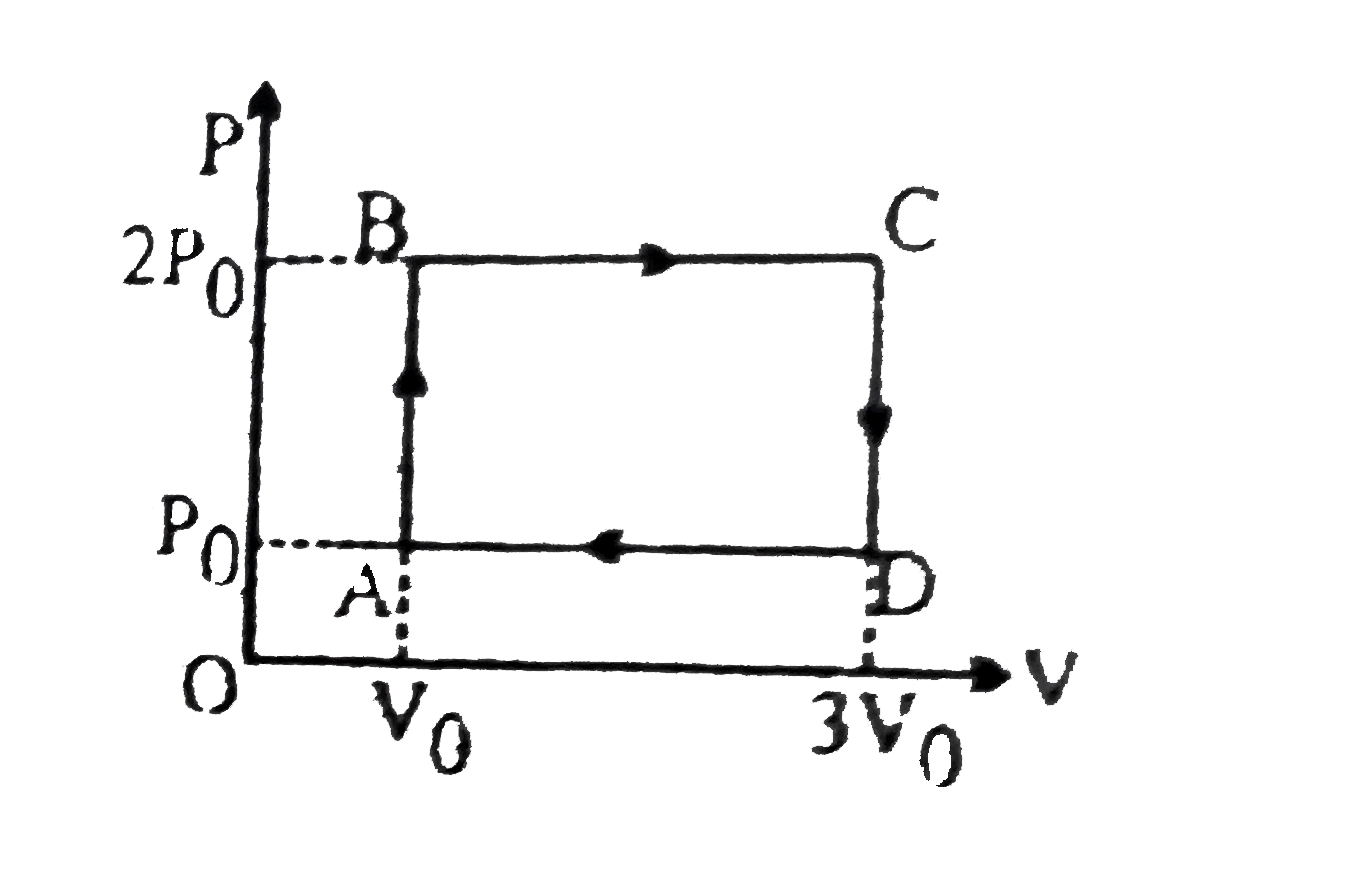
Identify the diagram which correctly represents the heat inflow and outflow of the system
View SolutionThe figure shows P - V diagram of a thermodynamic cycle
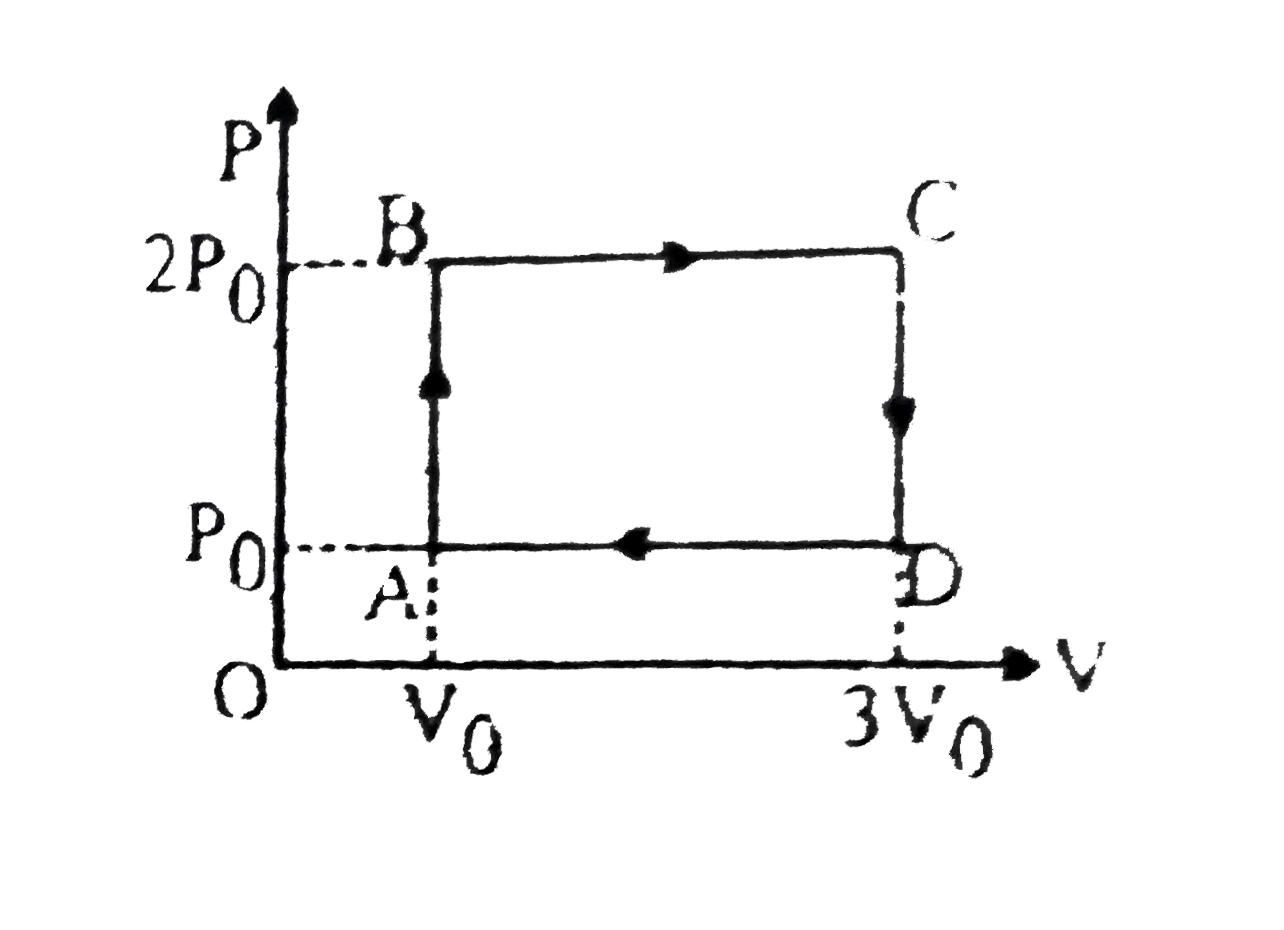
Choose the correct V - T diagram for the given cyclic process.
View SolutionThe figure shows P - V diagram of a thermodynamic cycle
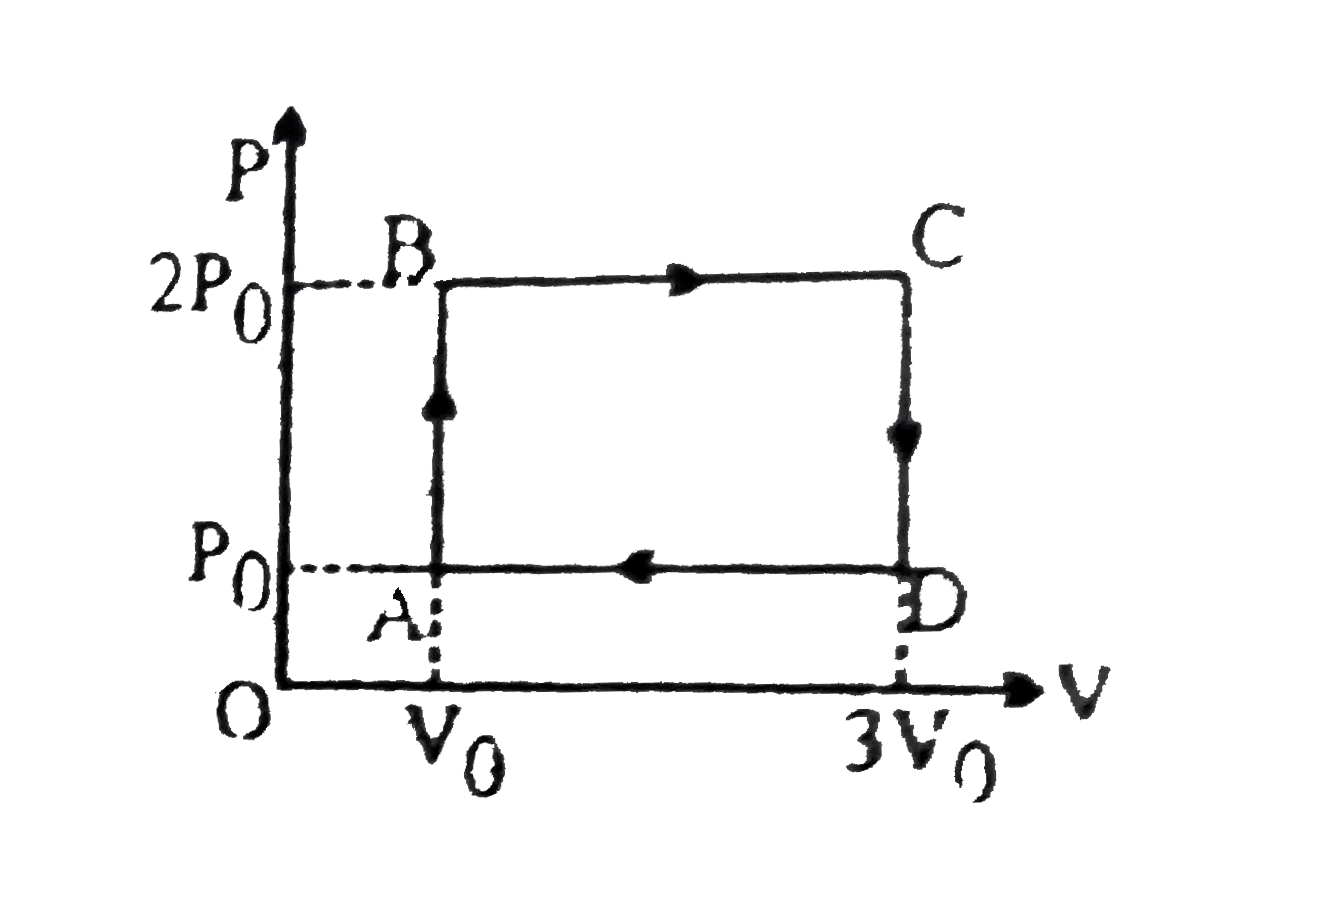
Choose the correct V - T diagram for the given cyclic process.
View SolutionAn ideal gas is taken around the cycle ABCA as shown in P-V diagram. The net work done by the gas during the cycle is equal to :
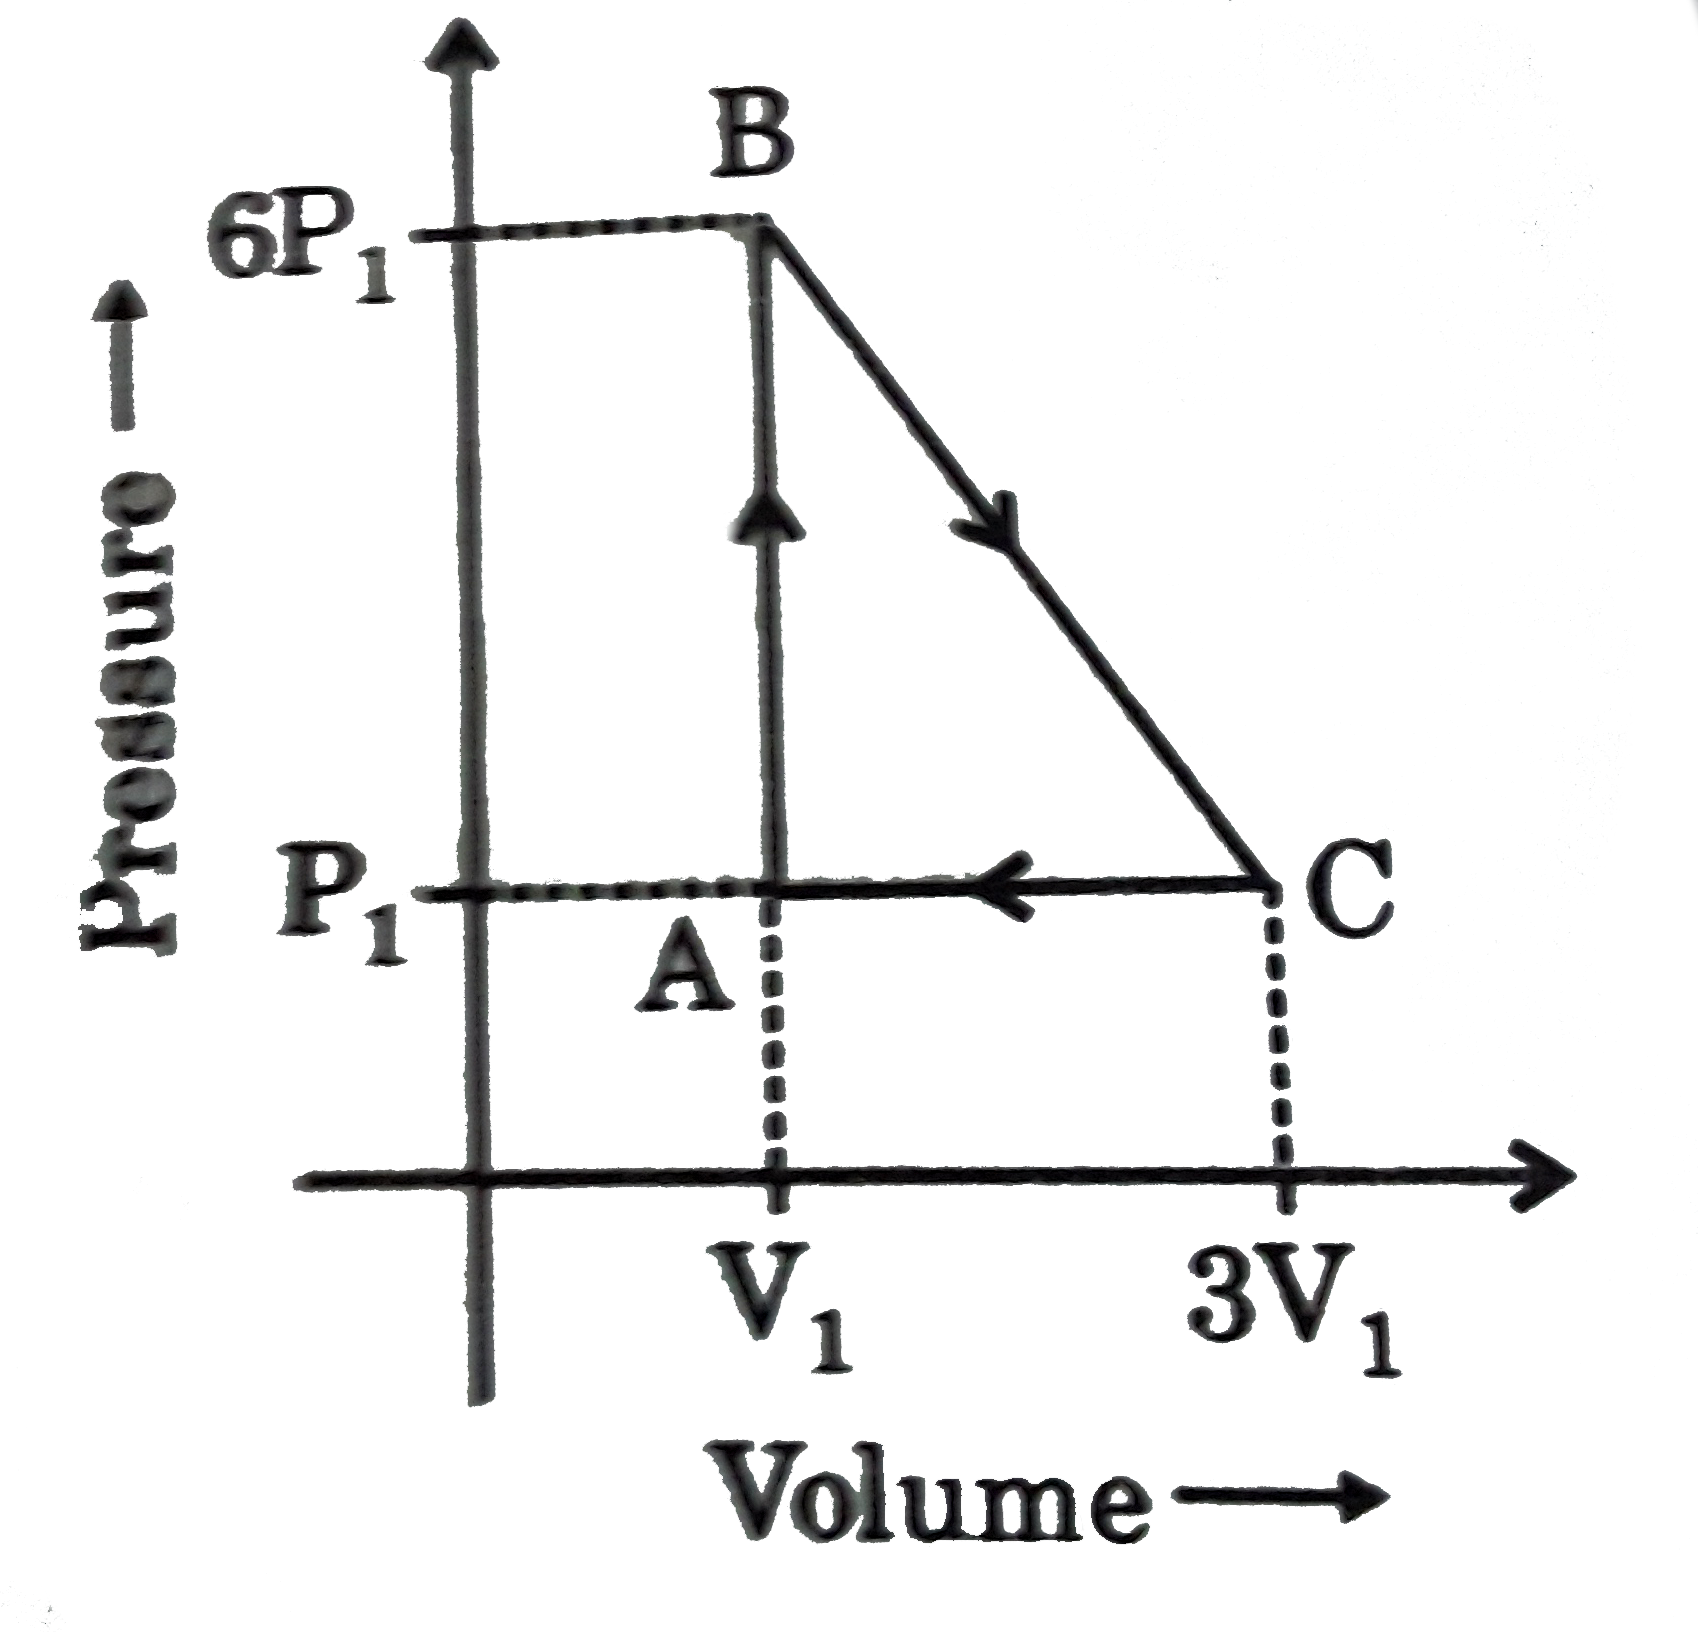
View Solution
