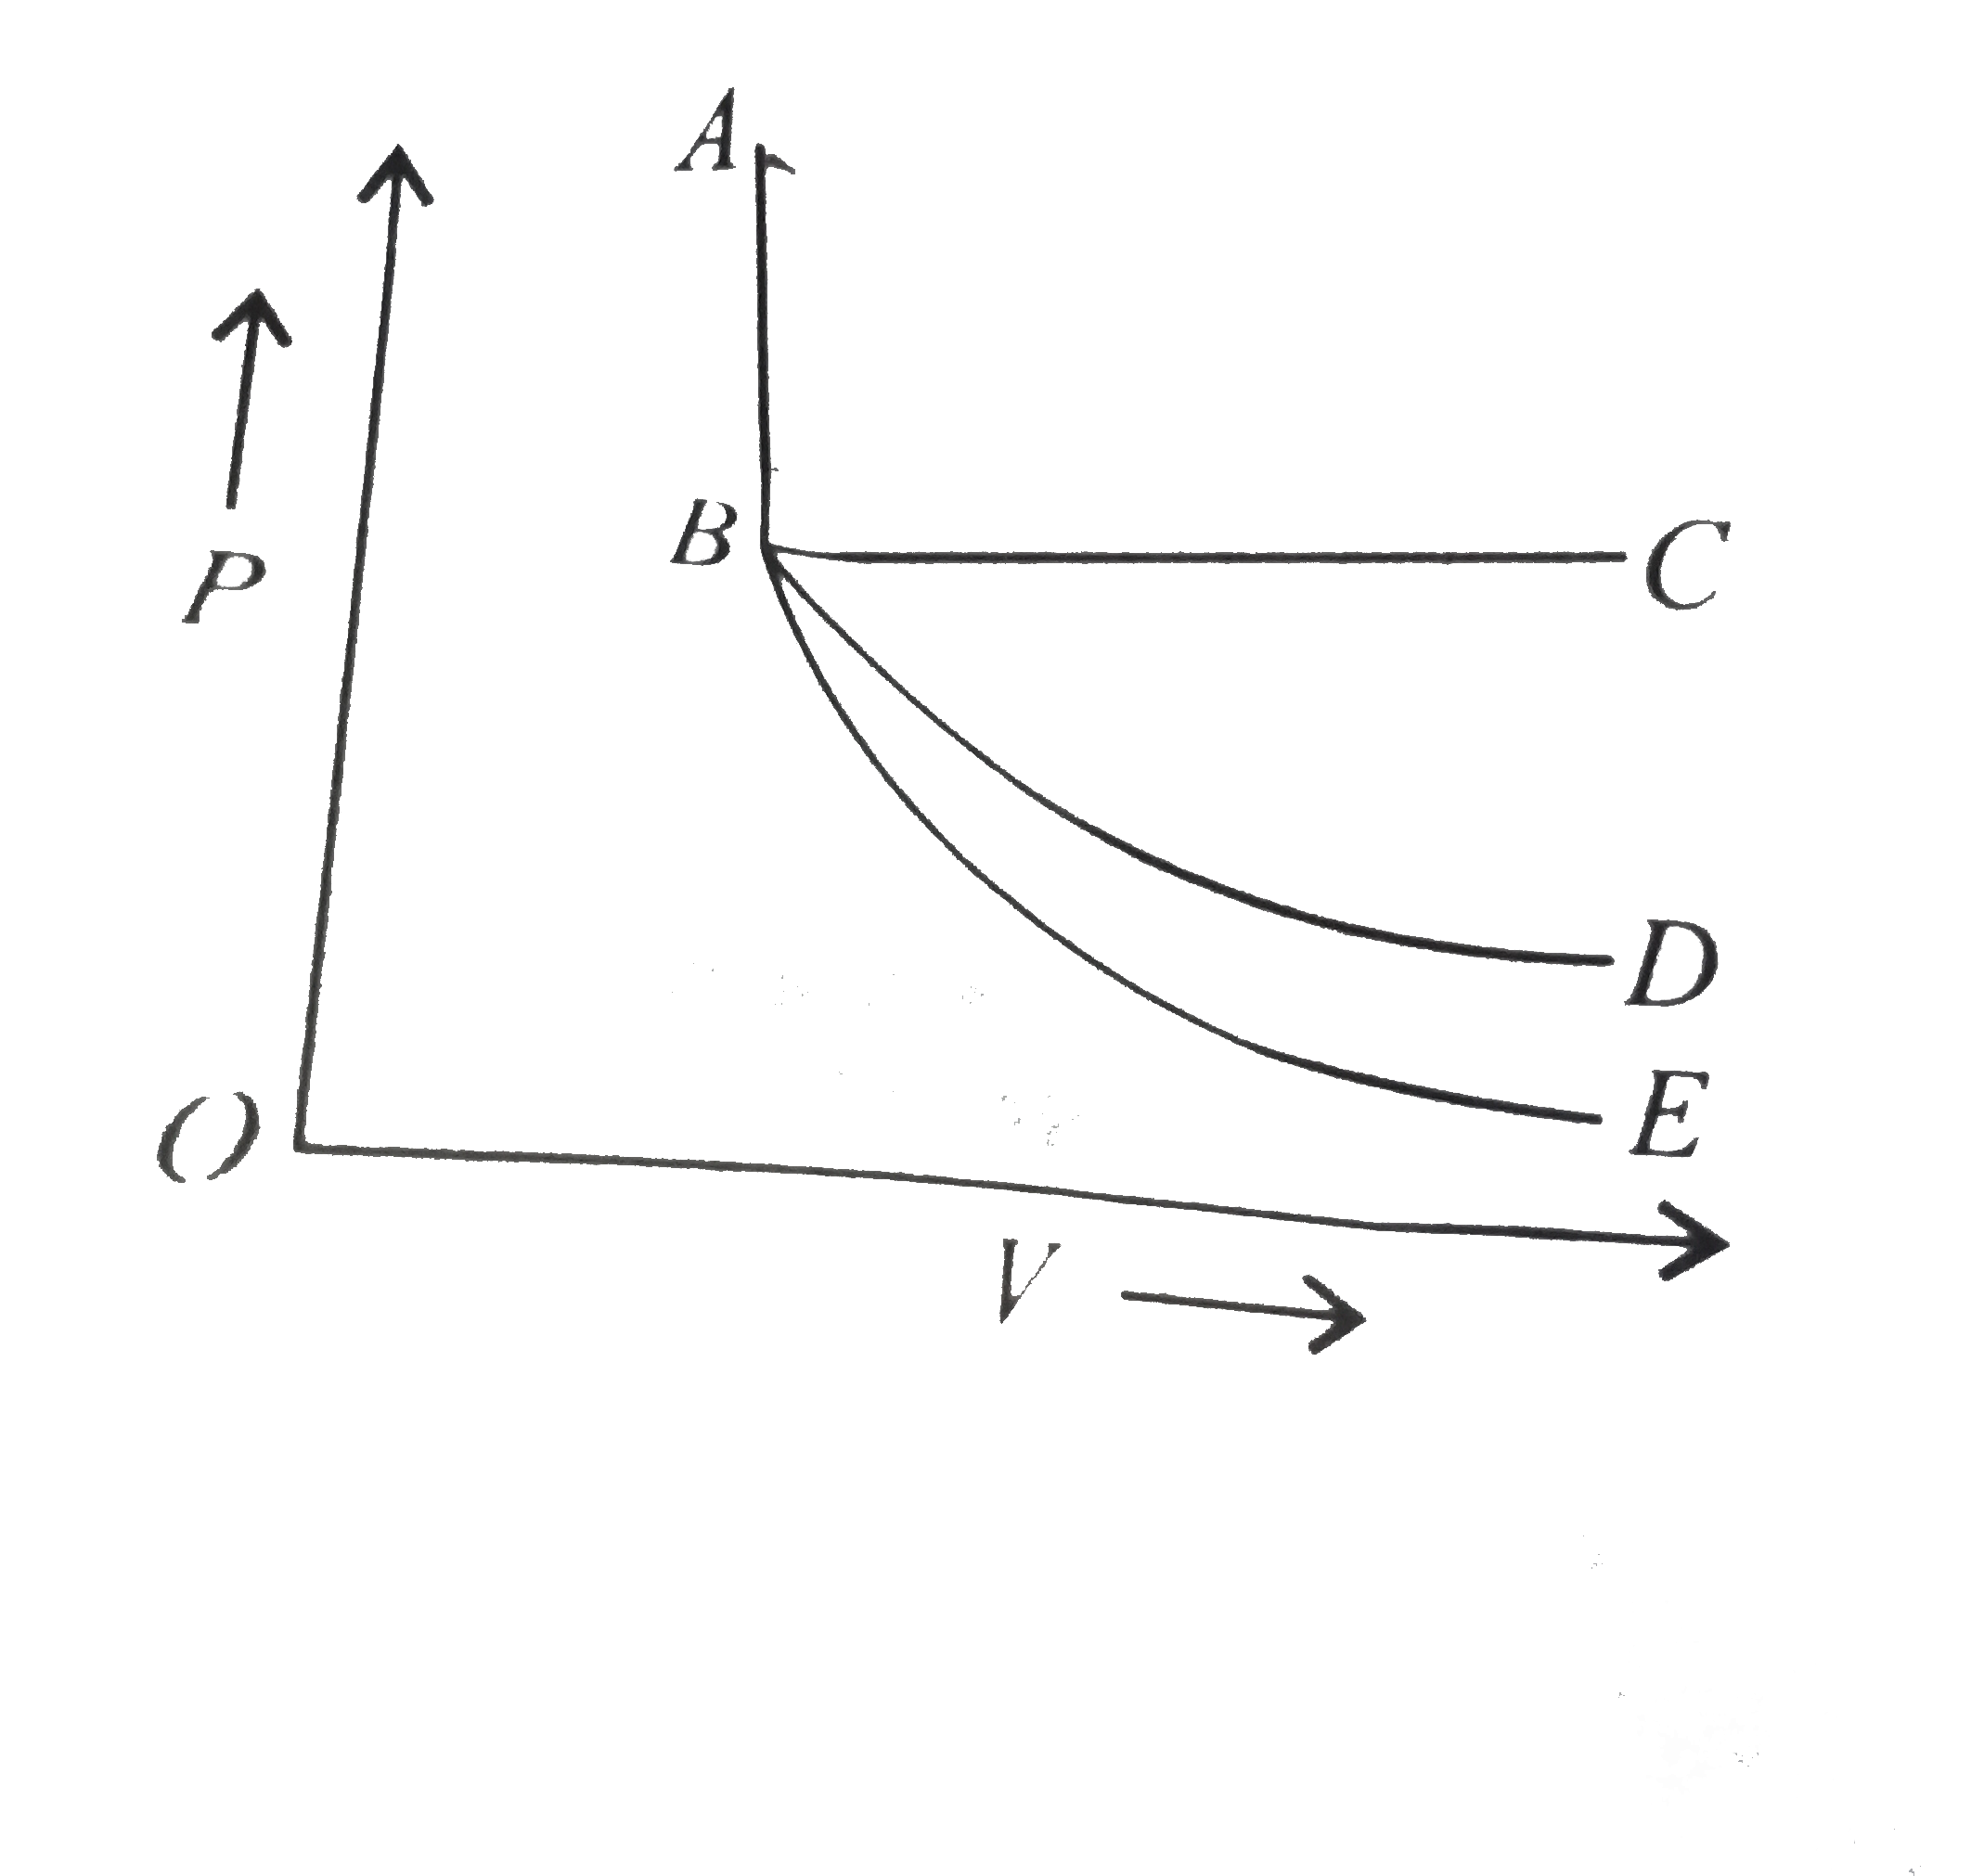
Figure. Shows the P−V diagram for a Carnot cycle. In this diagram
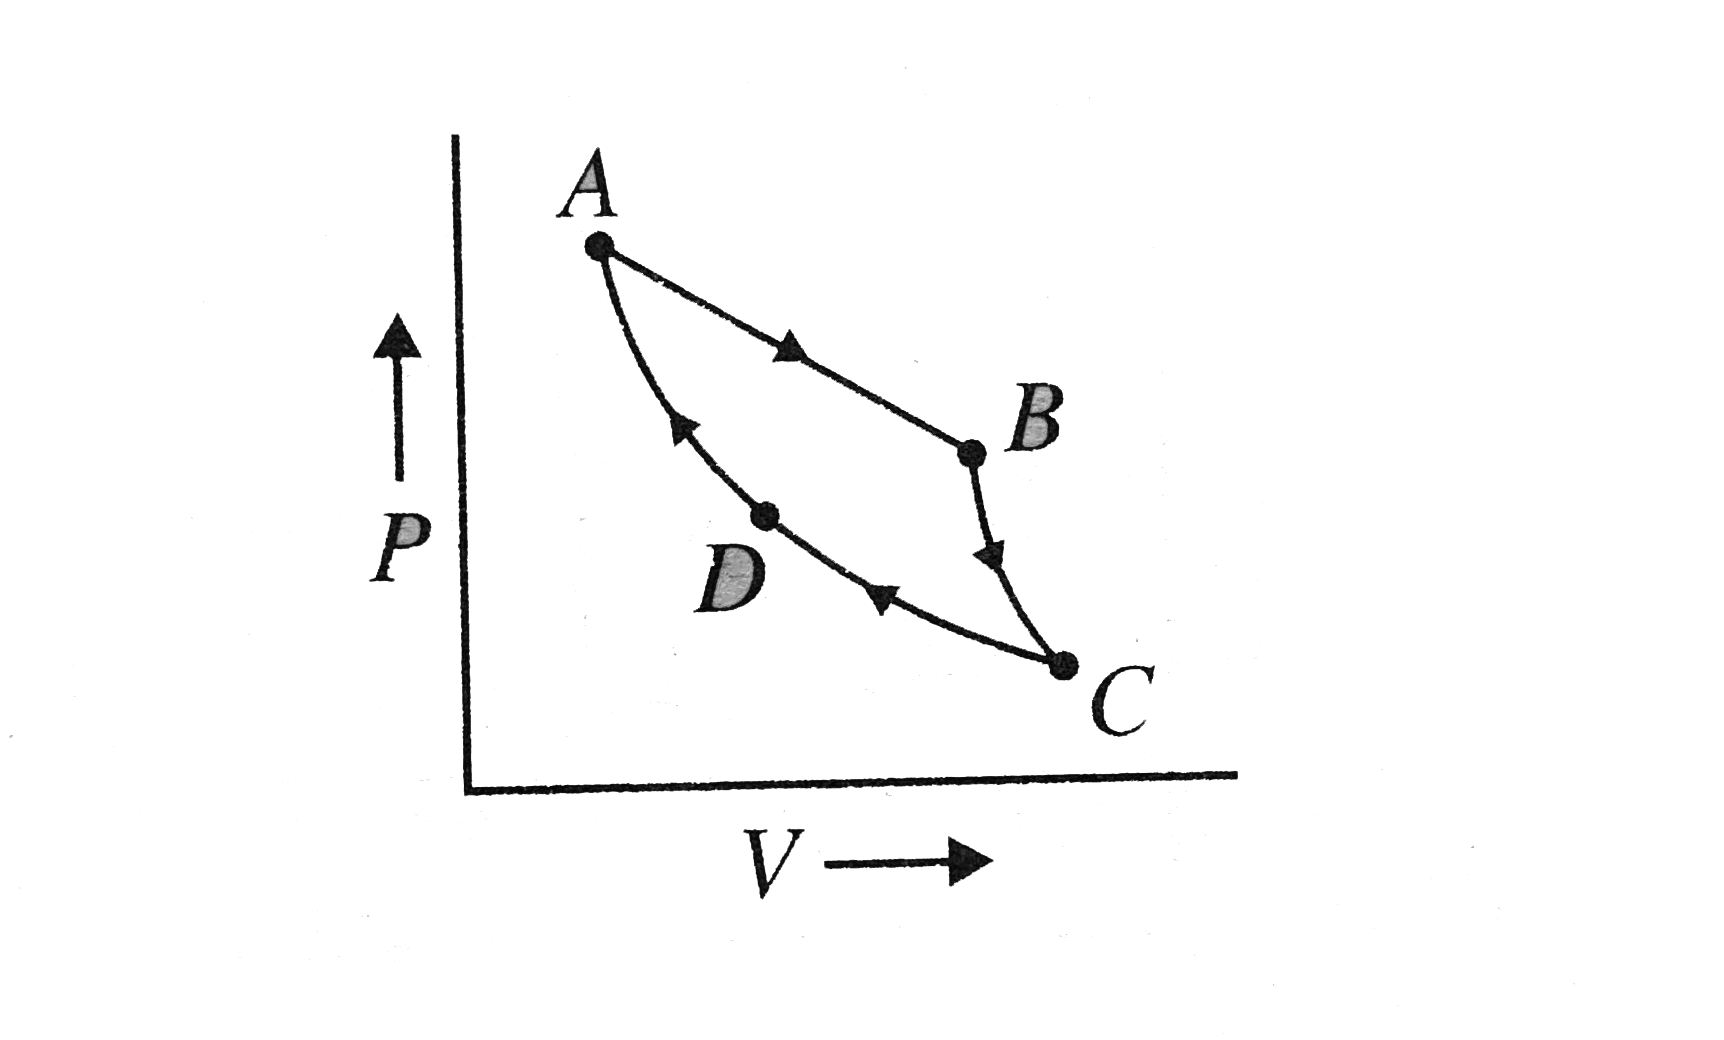
curve AB represents isothemal process and BC adiabatic process
curve AB represents adiabatic process and BC isothermal process
curve CD represents isothermal process and DA adaibatic process
curve CD represent adiabatic process and DA isothermal process
The correct Answer is:A, C
For an adiabatic process, PVγ= constant . Differentiating w.r.t. V, we get
dPdVVγ+PγVγ−1=0
or dPdV=−γPV
For isothermal process, PV= constant.
Hence,
dPdV=−PV
Now, dP/dV is the slope of the (P−V) graph. Thus, the slope of the (P−V) graph for an adiabatic process is γ times that for an isothermal process. Hence, curves BC and DA both represent adaibatic process and curves AB and CD both represent isothermal process. Thus, the correct choices are (a) and (c).
Topper's Solved these Questions
- BOOK - CENGAGE PHYSICS ENGLISHCHAPTER - KINETIC THEORY OF GASES AND FIRST LAW OF THERMODYNAMICSEXERCISE - Assertion-Reasoning6videos
KINETIC THEORY OF GASES AND FIRST LAW OF THERMODYNAMICS
- BOOK - CENGAGE PHYSICS ENGLISHCHAPTER - KINETIC THEORY OF GASES AND FIRST LAW OF THERMODYNAMICSEXERCISE - Comprehension56videos
KINETIC THEORY OF GASES AND FIRST LAW OF THERMODYNAMICS
- BOOK - CENGAGE PHYSICS ENGLISHCHAPTER - KINETIC THEORY OF GASES AND FIRST LAW OF THERMODYNAMICSEXERCISE - Single Correct140videos
KINETIC THEORY OF GASES AND FIRST LAW OF THERMODYNAMICS
- BOOK - CENGAGE PHYSICS ENGLISHCHAPTER - KINETIC THEORY OF GASESEXERCISE - Compression2videos
KINETIC THEORY OF GASES
- BOOK - CENGAGE PHYSICS ENGLISHCHAPTER - LINEAR AND ANGULAR SIMPLE HARMONIC MOTIONEXERCISE - Single correct anwer type14videos
LINEAR AND ANGULAR SIMPLE HARMONIC MOTION
Similar Questions
A carnot cycle consists of
View SolutionA carnot cycle consists of
View SolutionA carnot cycle consists of
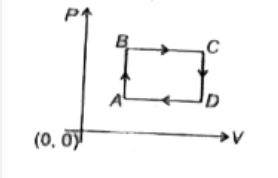
View SolutionThe figure shows P-V diagram of a thermodynamic cycle. Which corresponding curve is correct ?
 View Solution
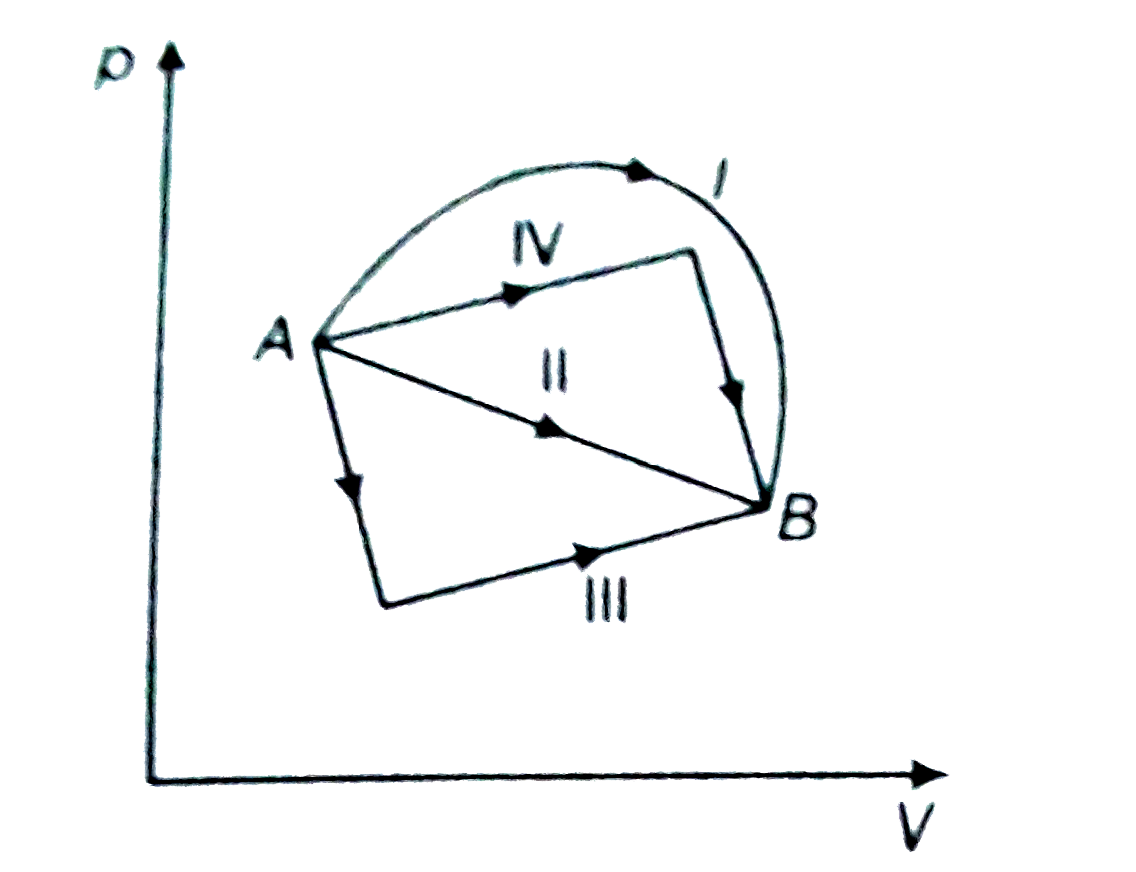
Figure shows the p−V diagram of an ideal gas undergoing a change of state from A to B. Four different parts I, II, III and IV as shown in the figure may lead to the same change of state. ltBrgt
 View Solution
A thermodynamic cycle xyzx is shown on a V-T diagram.
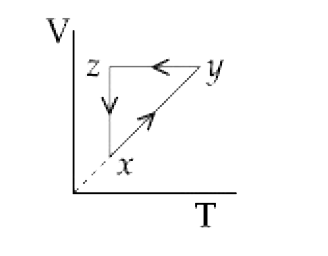
The P-V diagram that best describe this cycle is: (Diagrams are schematic and not to scale).View SolutionIn P−V diagram shown below,
 View Solution
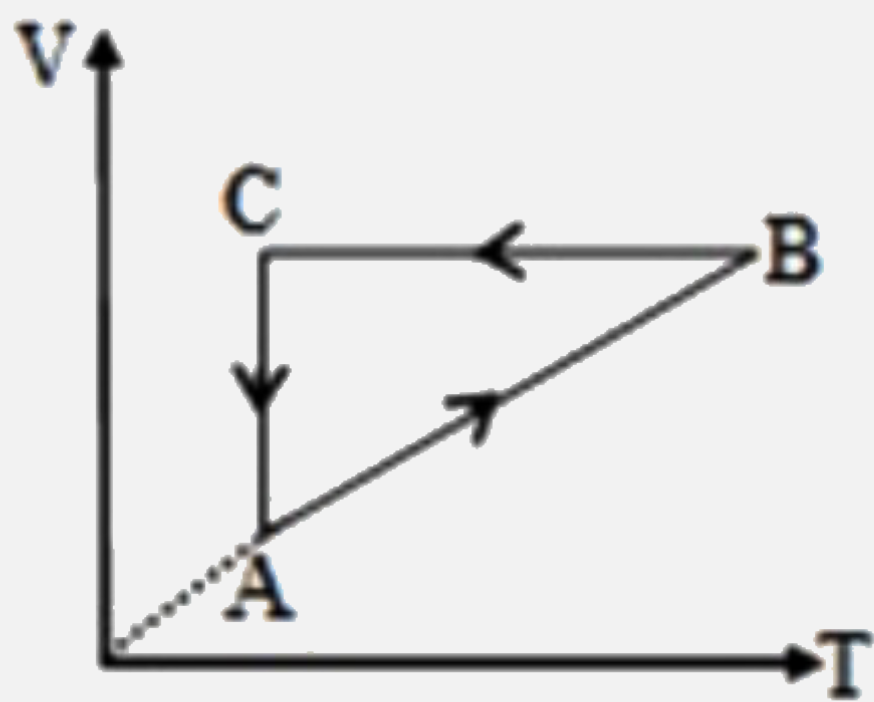
A cyclic process ABCA is shown in the V - T diagram . Process on the P – V diagram is
 View Solution
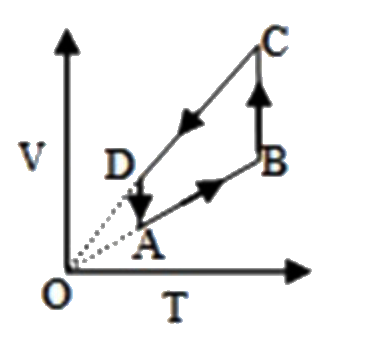
A cyclic process is shown on the V - T diagram . The same process on a P - T diagram is shown by
 View Solution
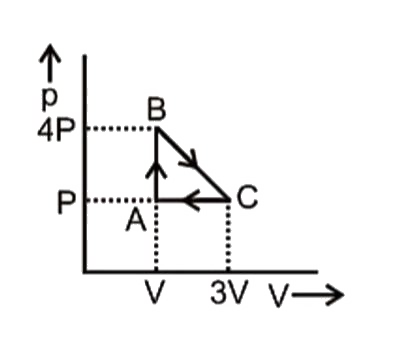
An ideal gas is taken around the cycle ABCA as shown in the P-V diagram. The total work done by the gas during the cycle is
 View Solution

