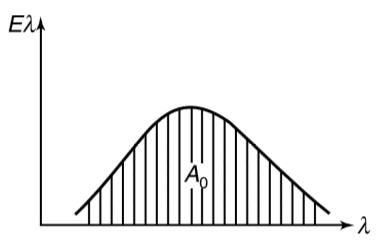
An iron ball is heated to 727∘C and it appears bright red. The plot of energy density distribution versus wavelength is as shown. The graph encloses an area A0 under it. Now the ball is heated further and it appears bright yellow. Find the area (A) of the energy density graph now.

If the given that wavelengths for red and yellow light are 8000 Å and 6000 Å respectively.
The correct Answer is:A=(43)4A0
Step by step video, text & image solution for An iron ball is heated to 727^(@)C and it appears bright red. The plot of energy density distribution versus wavelength is as shown. The graph encloses an area A_(0) under it. Now the ball is heated further and it appears bright yellow. Find the area (A) of the energy density graph now. If the given that wavelengths for red and yellow light are 8000 Å and 6000 Å respectively. by Physics experts to help you in doubts & scoring excellent marks in Class 11 exams.
Updated on:21/07/2023Topper's Solved these Questions
Similar Questions
Calculate the ratio of the energy of a photon of wavelength 3000 Å to that of a photon of wavelength 6000Å respectively
View SolutionIn young double slit experiment the nth red bright band coincides with (n+1)th blue bright band.If the wavelength of red and blue lights are 7500A∘ and 5000A∘ ,the value of n is
View Solution
Knowledge Check
The wavelength of the photons are 4500 Å and 6000 Å. The ratio of their energies is
A1:2B3:4C4:3D2:5The order of increasing wavelength for blue (b) green ( g) red (r ) and yellow ( y) light is
Ar,y,g,bBr,g,y,bCg,y,b,rDb,g,y,rIf yellow glass is heated enough and then taken in dark room, it will appear :–
ARedBYellowCBlueDGreen
Why is the colour of red and yellow soil red and yellow?
View SolutionWhich has a higher energy, a photon of violet light with wavelength 4000Ã… or a photon of red light with wavelength 7000Ã…? [h=6.62×10⁻³⁴Js]
View SolutionThe graph between the energy of photoelectrons E and the wavelength of incident light (λ) is
View SolutionA light has a wavelength 6000Å. The energy of this light is
View SolutionThe relationship between energy E, of the radiation with a wavelength 8000 Å and the energy of the radiation with a wavelength 16000 Å is
View Solution
