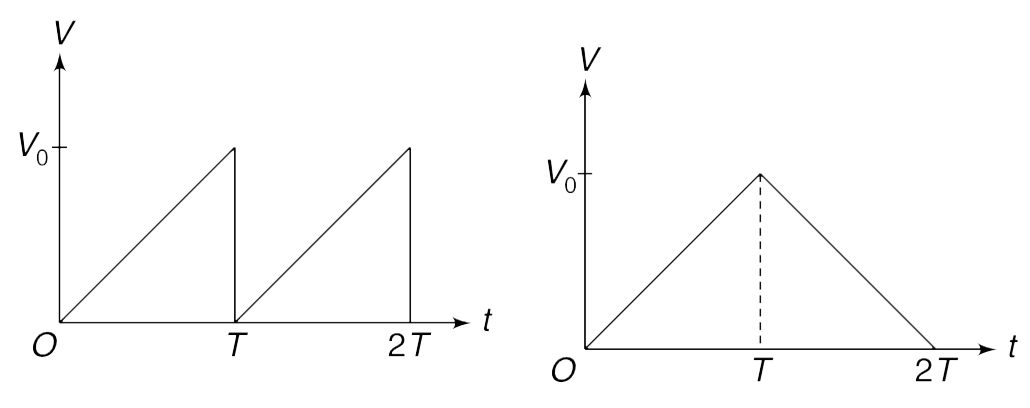
Which of the two waveforms shown in Figure has a higher average value?
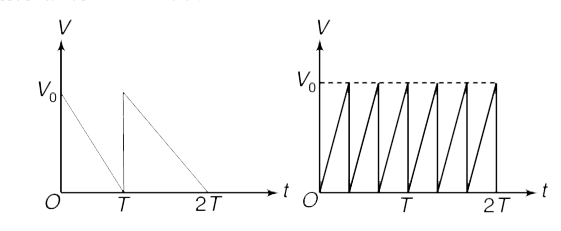
The correct Answer is:Both have same average
Step by step video, text & image solution for Which of the two waveforms shown in Figure has a higher average value? by Physics experts to help you in doubts & scoring excellent marks in Class 12 exams.
Updated on:21/07/2023Topper's Solved these Questions
Similar Questions
Knowledge Check
In the two circuits shown in figure
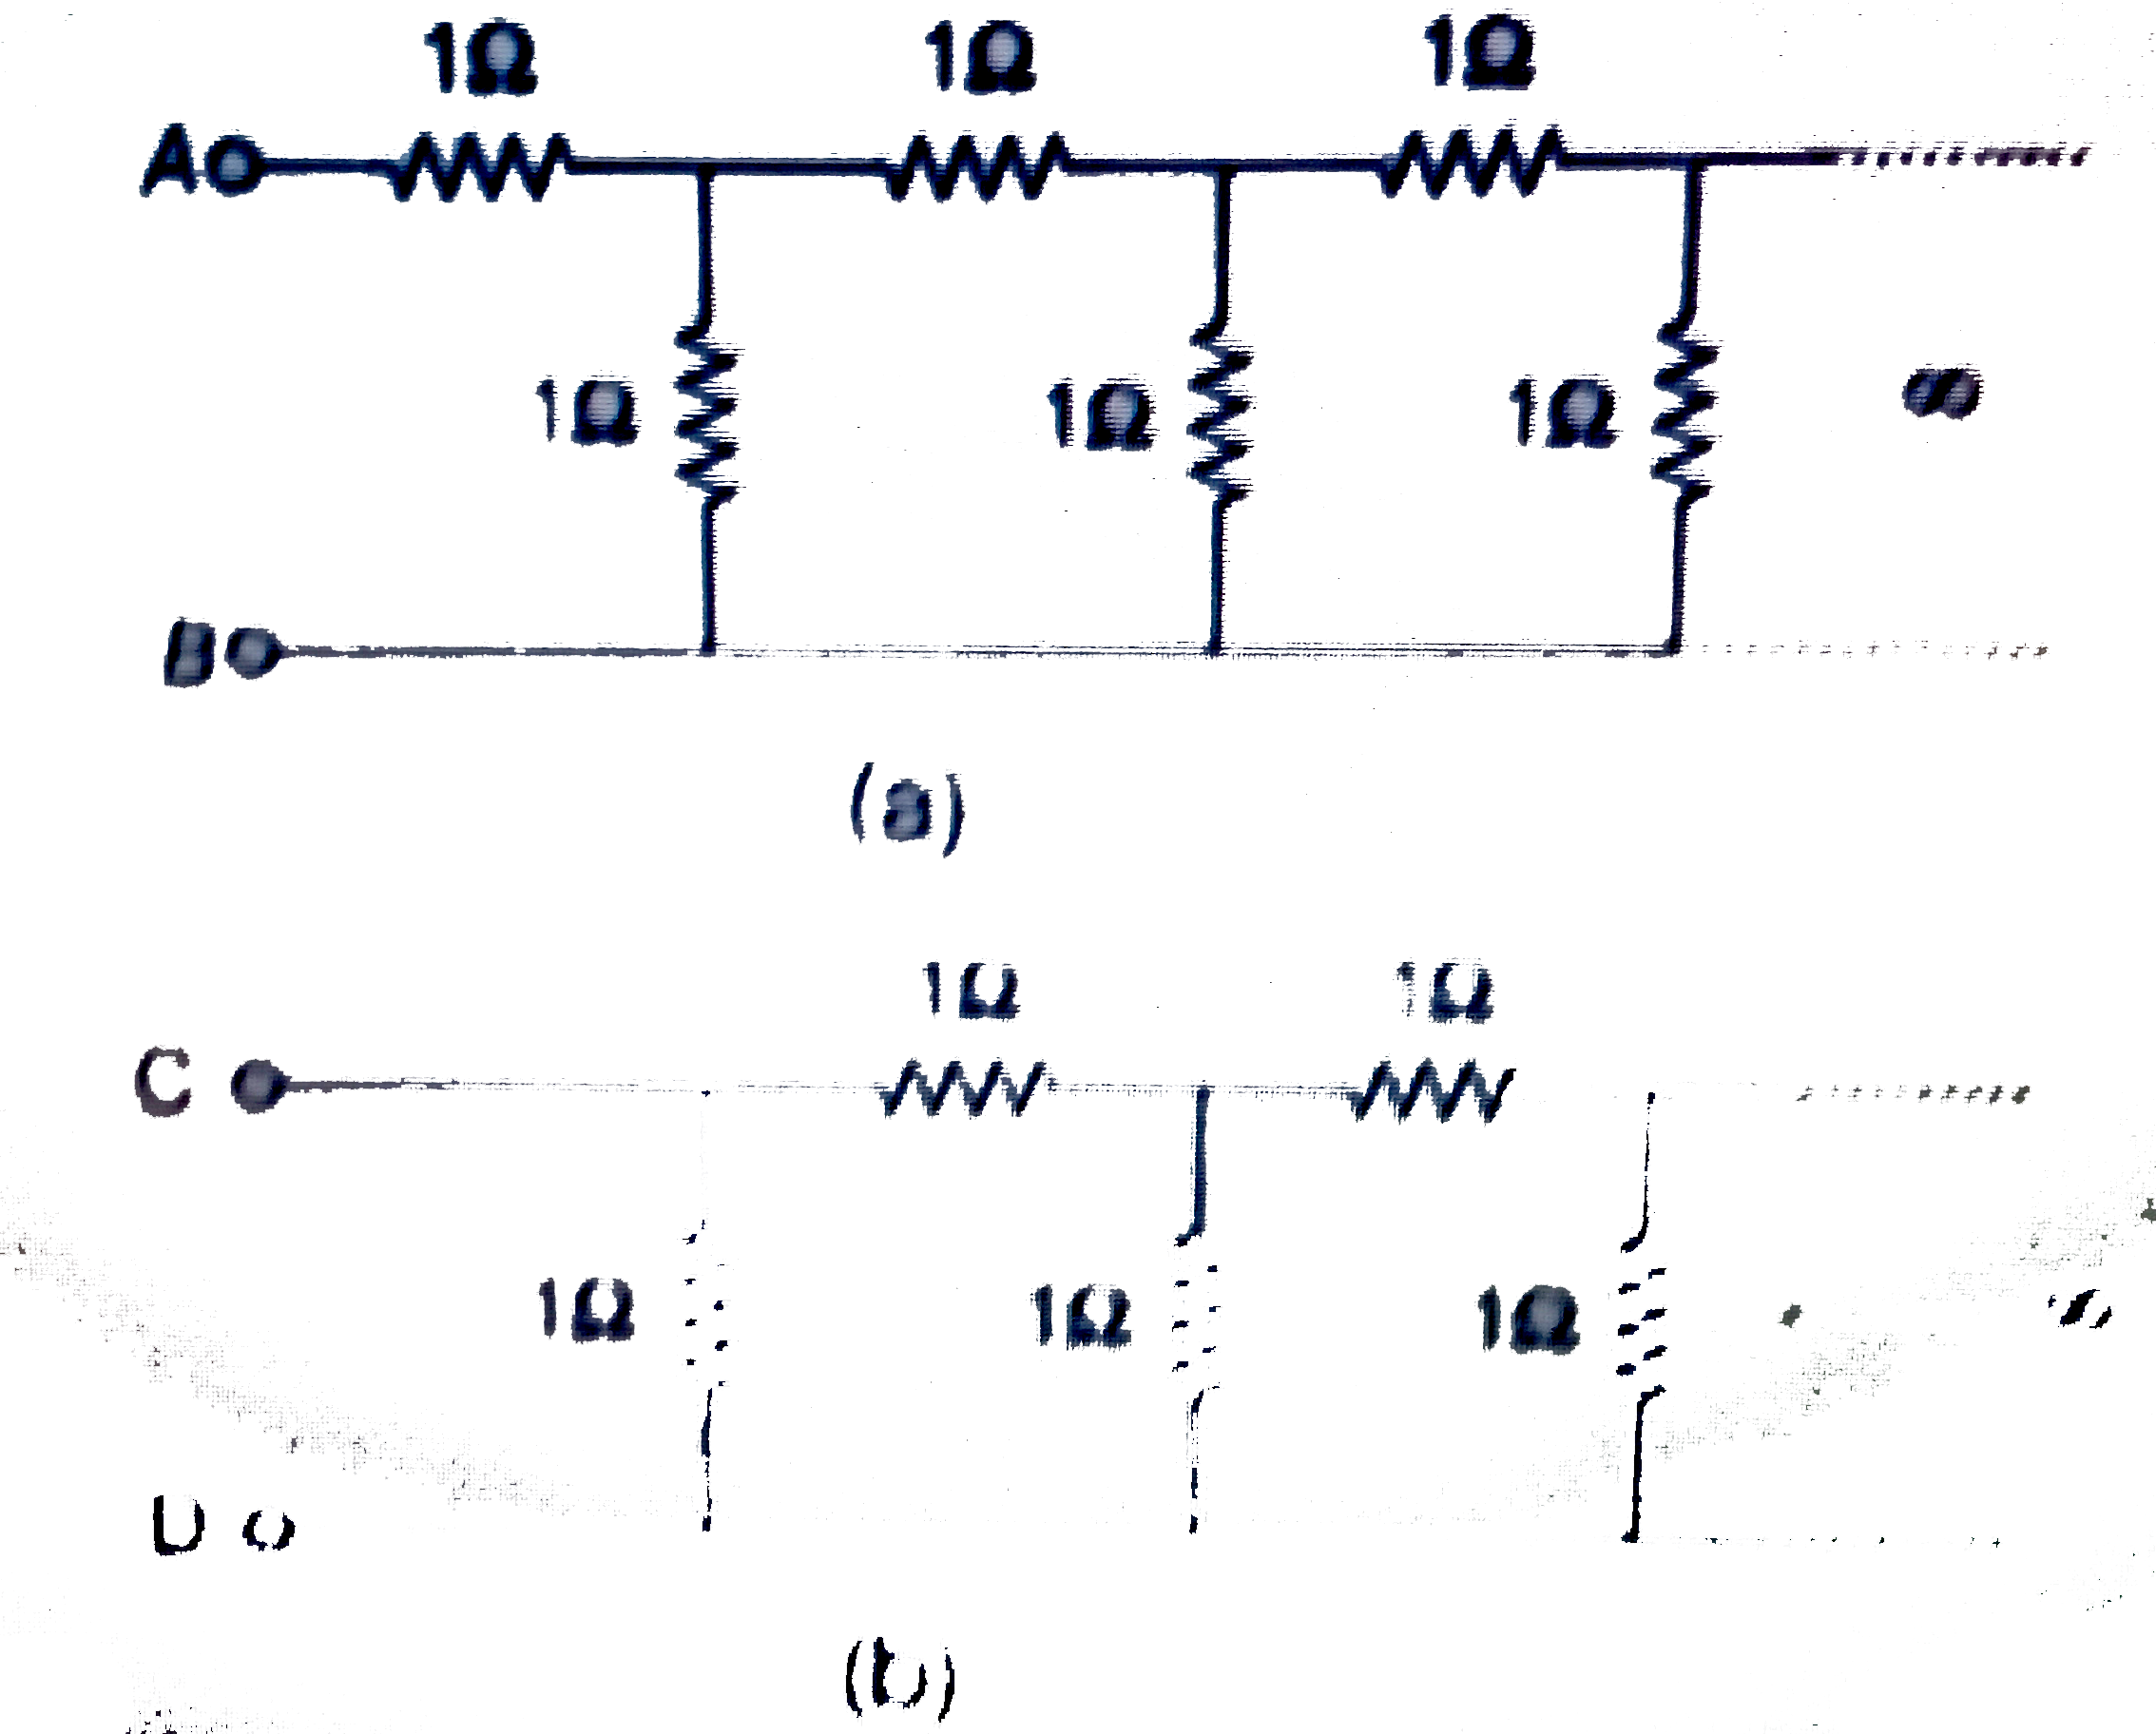 ARAB=RCD=(√3+2)ΩBRAB=(√3+1)ΩCRCD=(√5+1)ΩDRAB>RCD
Which sample A or B shown in figure has shorter mean-life ?
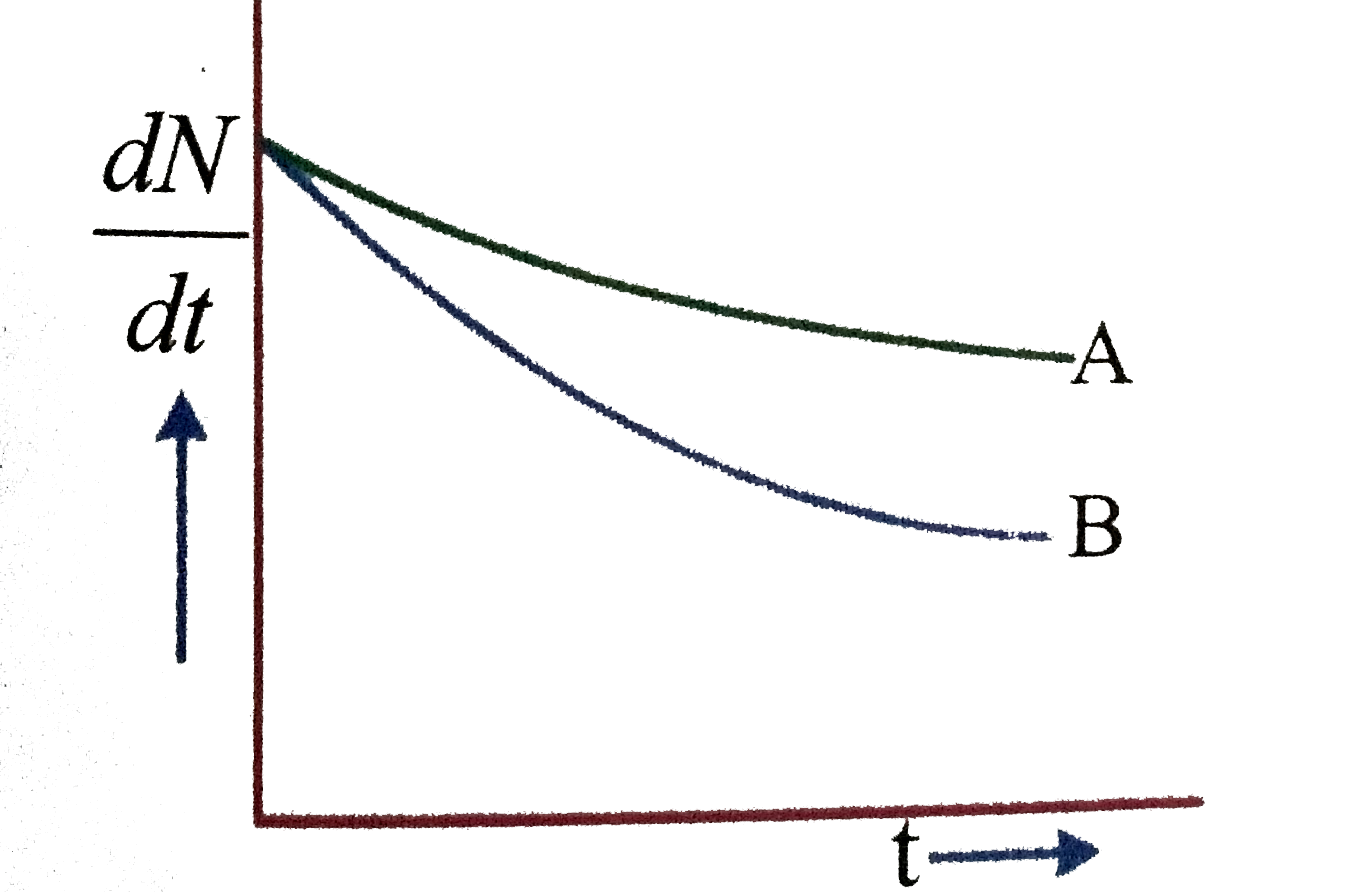 AτB<τABτB>τACτB=τADNothing can be concluded
Which of the following ideal gases has higher value of average kinetic energy per mole at the same temperature - N2,CO2,O2 ?
AN2BCO2CO2DAll have equal value of KE
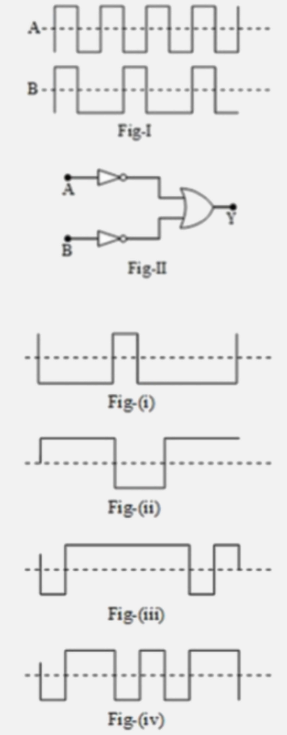
Input waveforms A and B as shown in Fig-l are applied to the combination of gates as shown in Fig-ll. Which of the waveforms shown in Fig.(i) to (iv) correctly represents the output waveform?
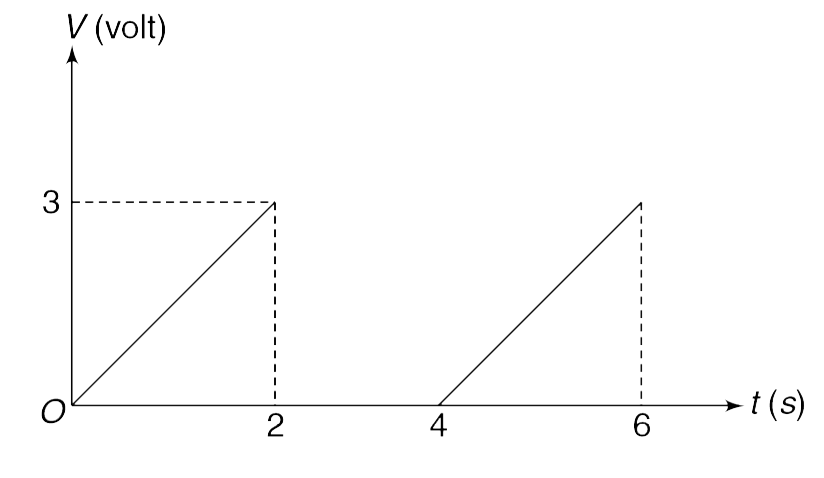
View SolutionA voltage waveform is as shown in the Figure calculate the ratio of rms value and average value of the voltage.
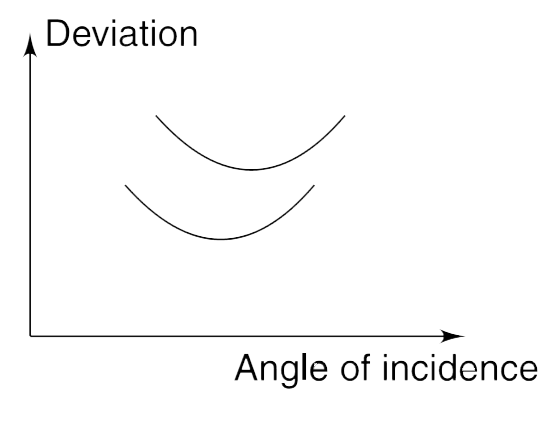
View SolutionThe plot of deviation versus angle of incidence for two prisms made of same material has been shown in the Figure. Which of the two graph corresponds to the prism of higher refracting angle (A)?
View SolutionWhich of the following has a higher value for Kh at 270c
View SolutionWhich of the following has/have zero average value in a plane electromagnetic wave?
View Solution

