A radioactive isotope X decays into a stable nucleus Y. Draw graphs showing the variation of rate of formation of Y versus time and the variation of population of Y versus time. Initial population of Y is zero.
The correct Answer is:Rate of
Step by step video, text & image solution for A radioactive isotope X decays into a stable nucleus Y. Draw graphs showing the variation of rate of formation of Y versus time and the variation of population of Y versus time. Initial population of Y is zero. by Physics experts to help you in doubts & scoring excellent marks in Class 12 exams.
Topper's Solved these Questions
Similar Questions
Knowledge Check
- Question 1 - Select One
A radioactiev nuleus X deays to a stable nuleus Y. Then, time graph of rate of formation of Y against time t will be:
A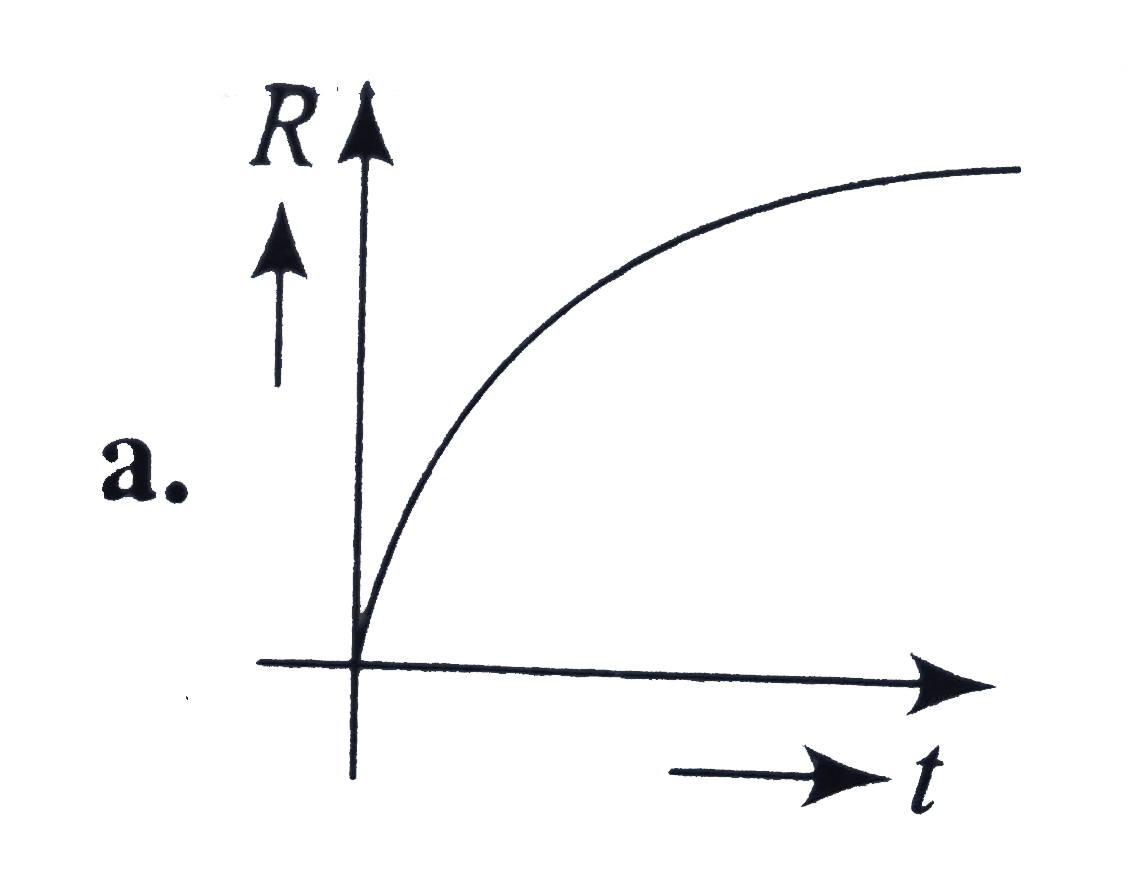 B
B C
C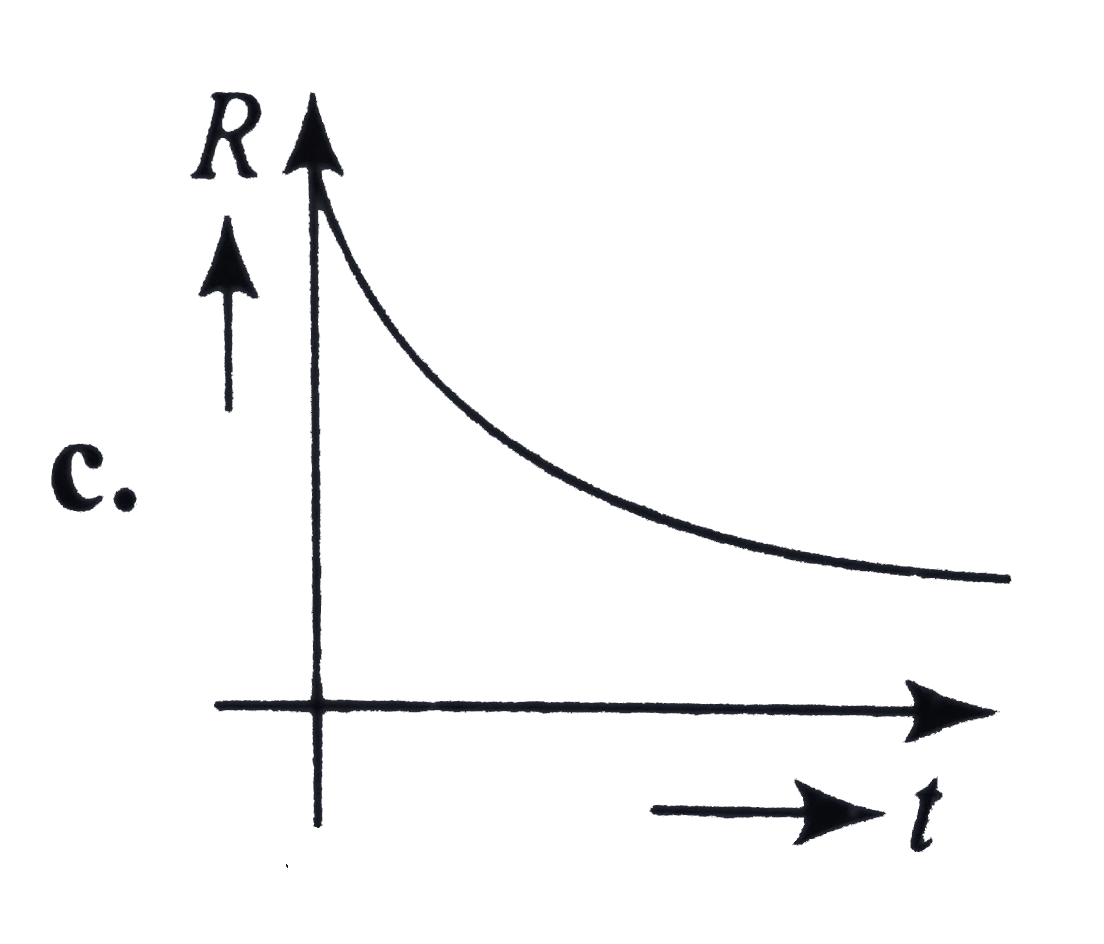 D
D
- Question 2 - Select One
A radioactive sample decays to form a stable nuclide. A graph showing variation of rate of disintegration (dNdt) of radioactive sample with time (t) is
A B
B C
C D
D
- Question 3 - Select One
The radioactive nucleus of an element X decays to a stable nucleus of element Y.A graph of the rate of romation of Y against time would look like:
A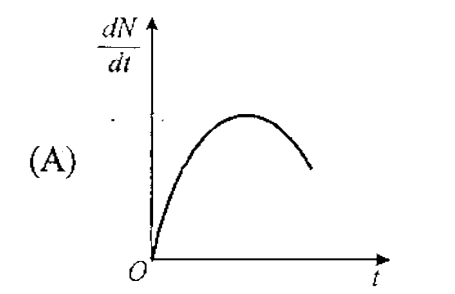 B
B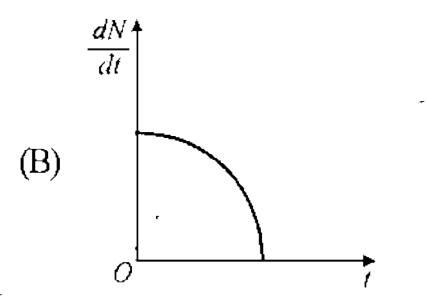 C
C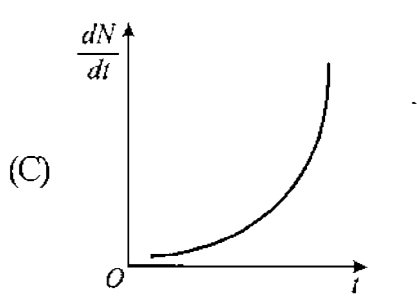 D
D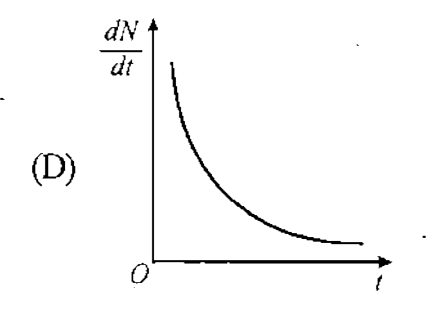
Draw a graph showing the variation of decay rate with number of active nuclei.
View SolutionDraw graph of x<−y
View SolutionDraw a graph showing the variation of decay rate (−dNdt) with number (N) of radioactive nuclei.
View SolutionDraw graph showing variation of voltage and current with time over one cycle of ac.for X
View SolutionA radioactive isotope X with half-life 1.5×10⁹ yr decays into a stable nucleus Y .A rock sample contains both elements X and Y in the ratio 1 : 15. They age of the rock is
View Solution
