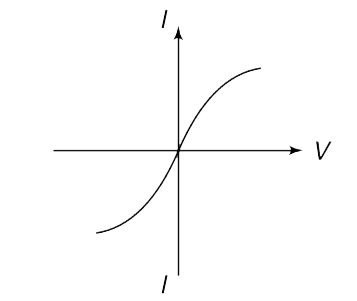
The current-voltage graph for a resistor is as shown in the figure. Is it right to say that resistance decreases as the current through it increases ?
Video Solution
Text Solution
The correct Answer is:No
|
Answer
Step by step video, text & image solution for The current-voltage graph for a resistor is as shown in the figure. Is it right to say that resistance decreases as the current through it increases ? by Physics experts to help you in doubts & scoring excellent marks in Class 12 exams.
Updated on:21/07/2023Topper's Solved these Questions
Similar Questions
Knowledge Check
The current-voltage graph of a device is shown in figure. The resistance is negative in region.
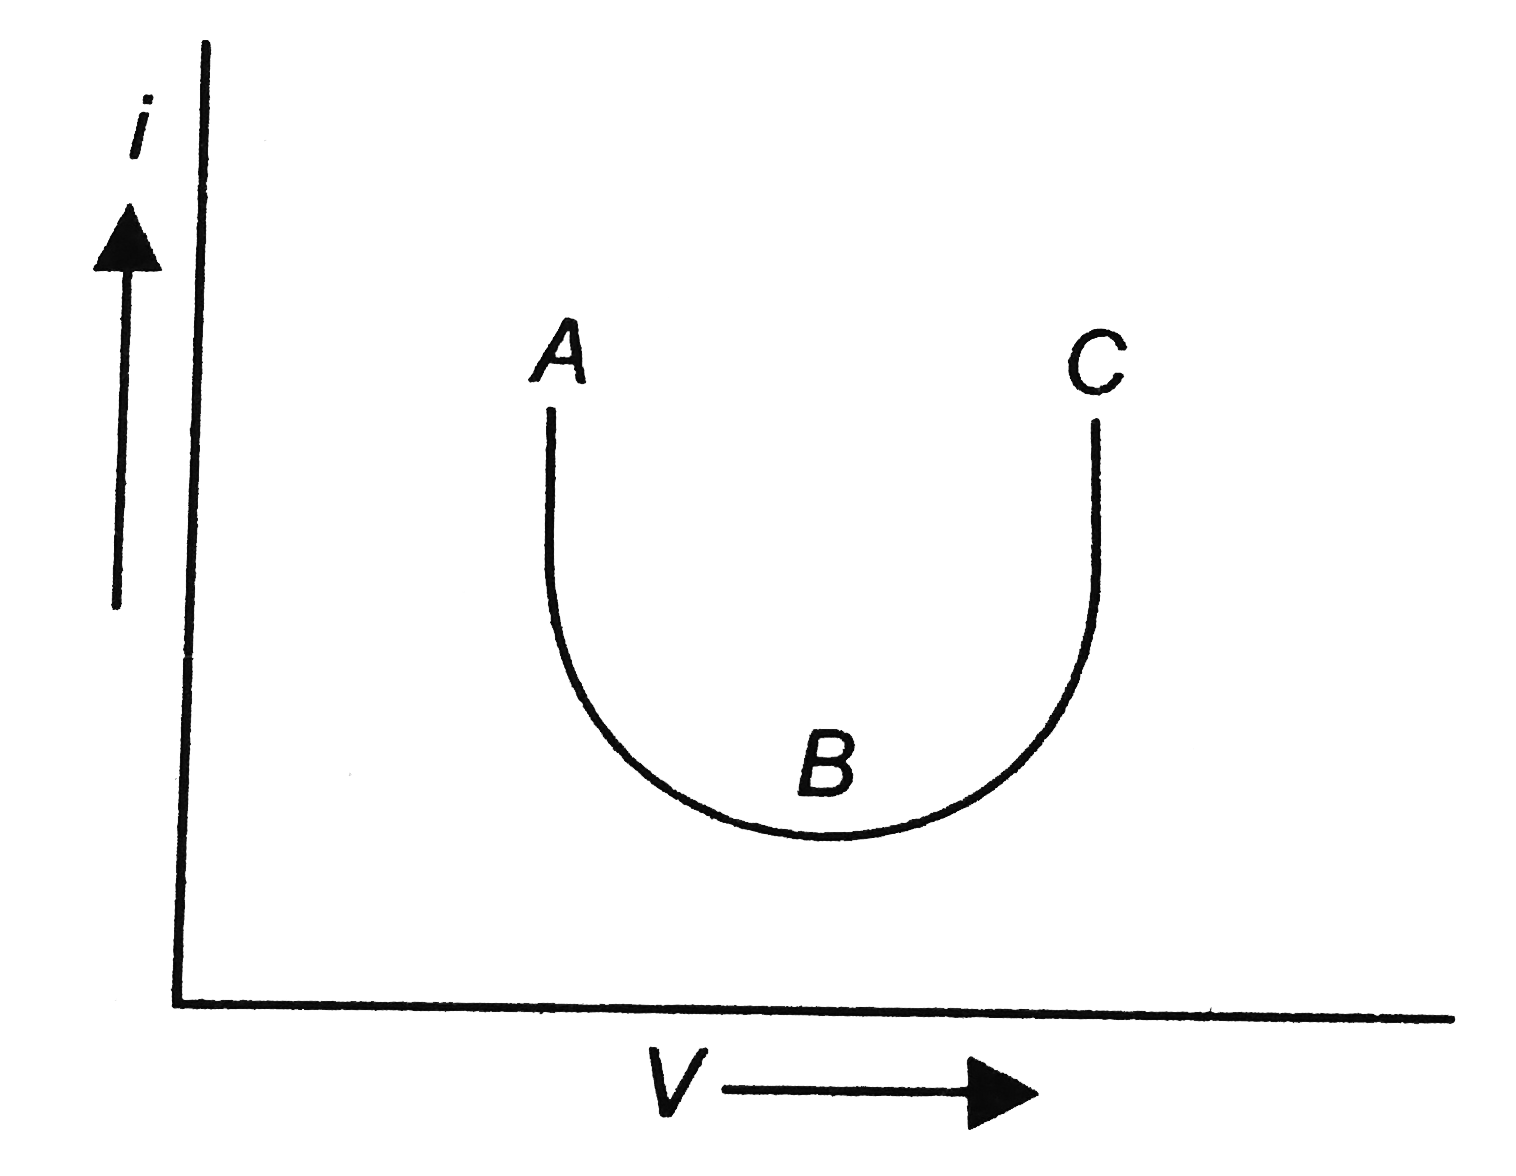 AABBBCCABCDNone of these
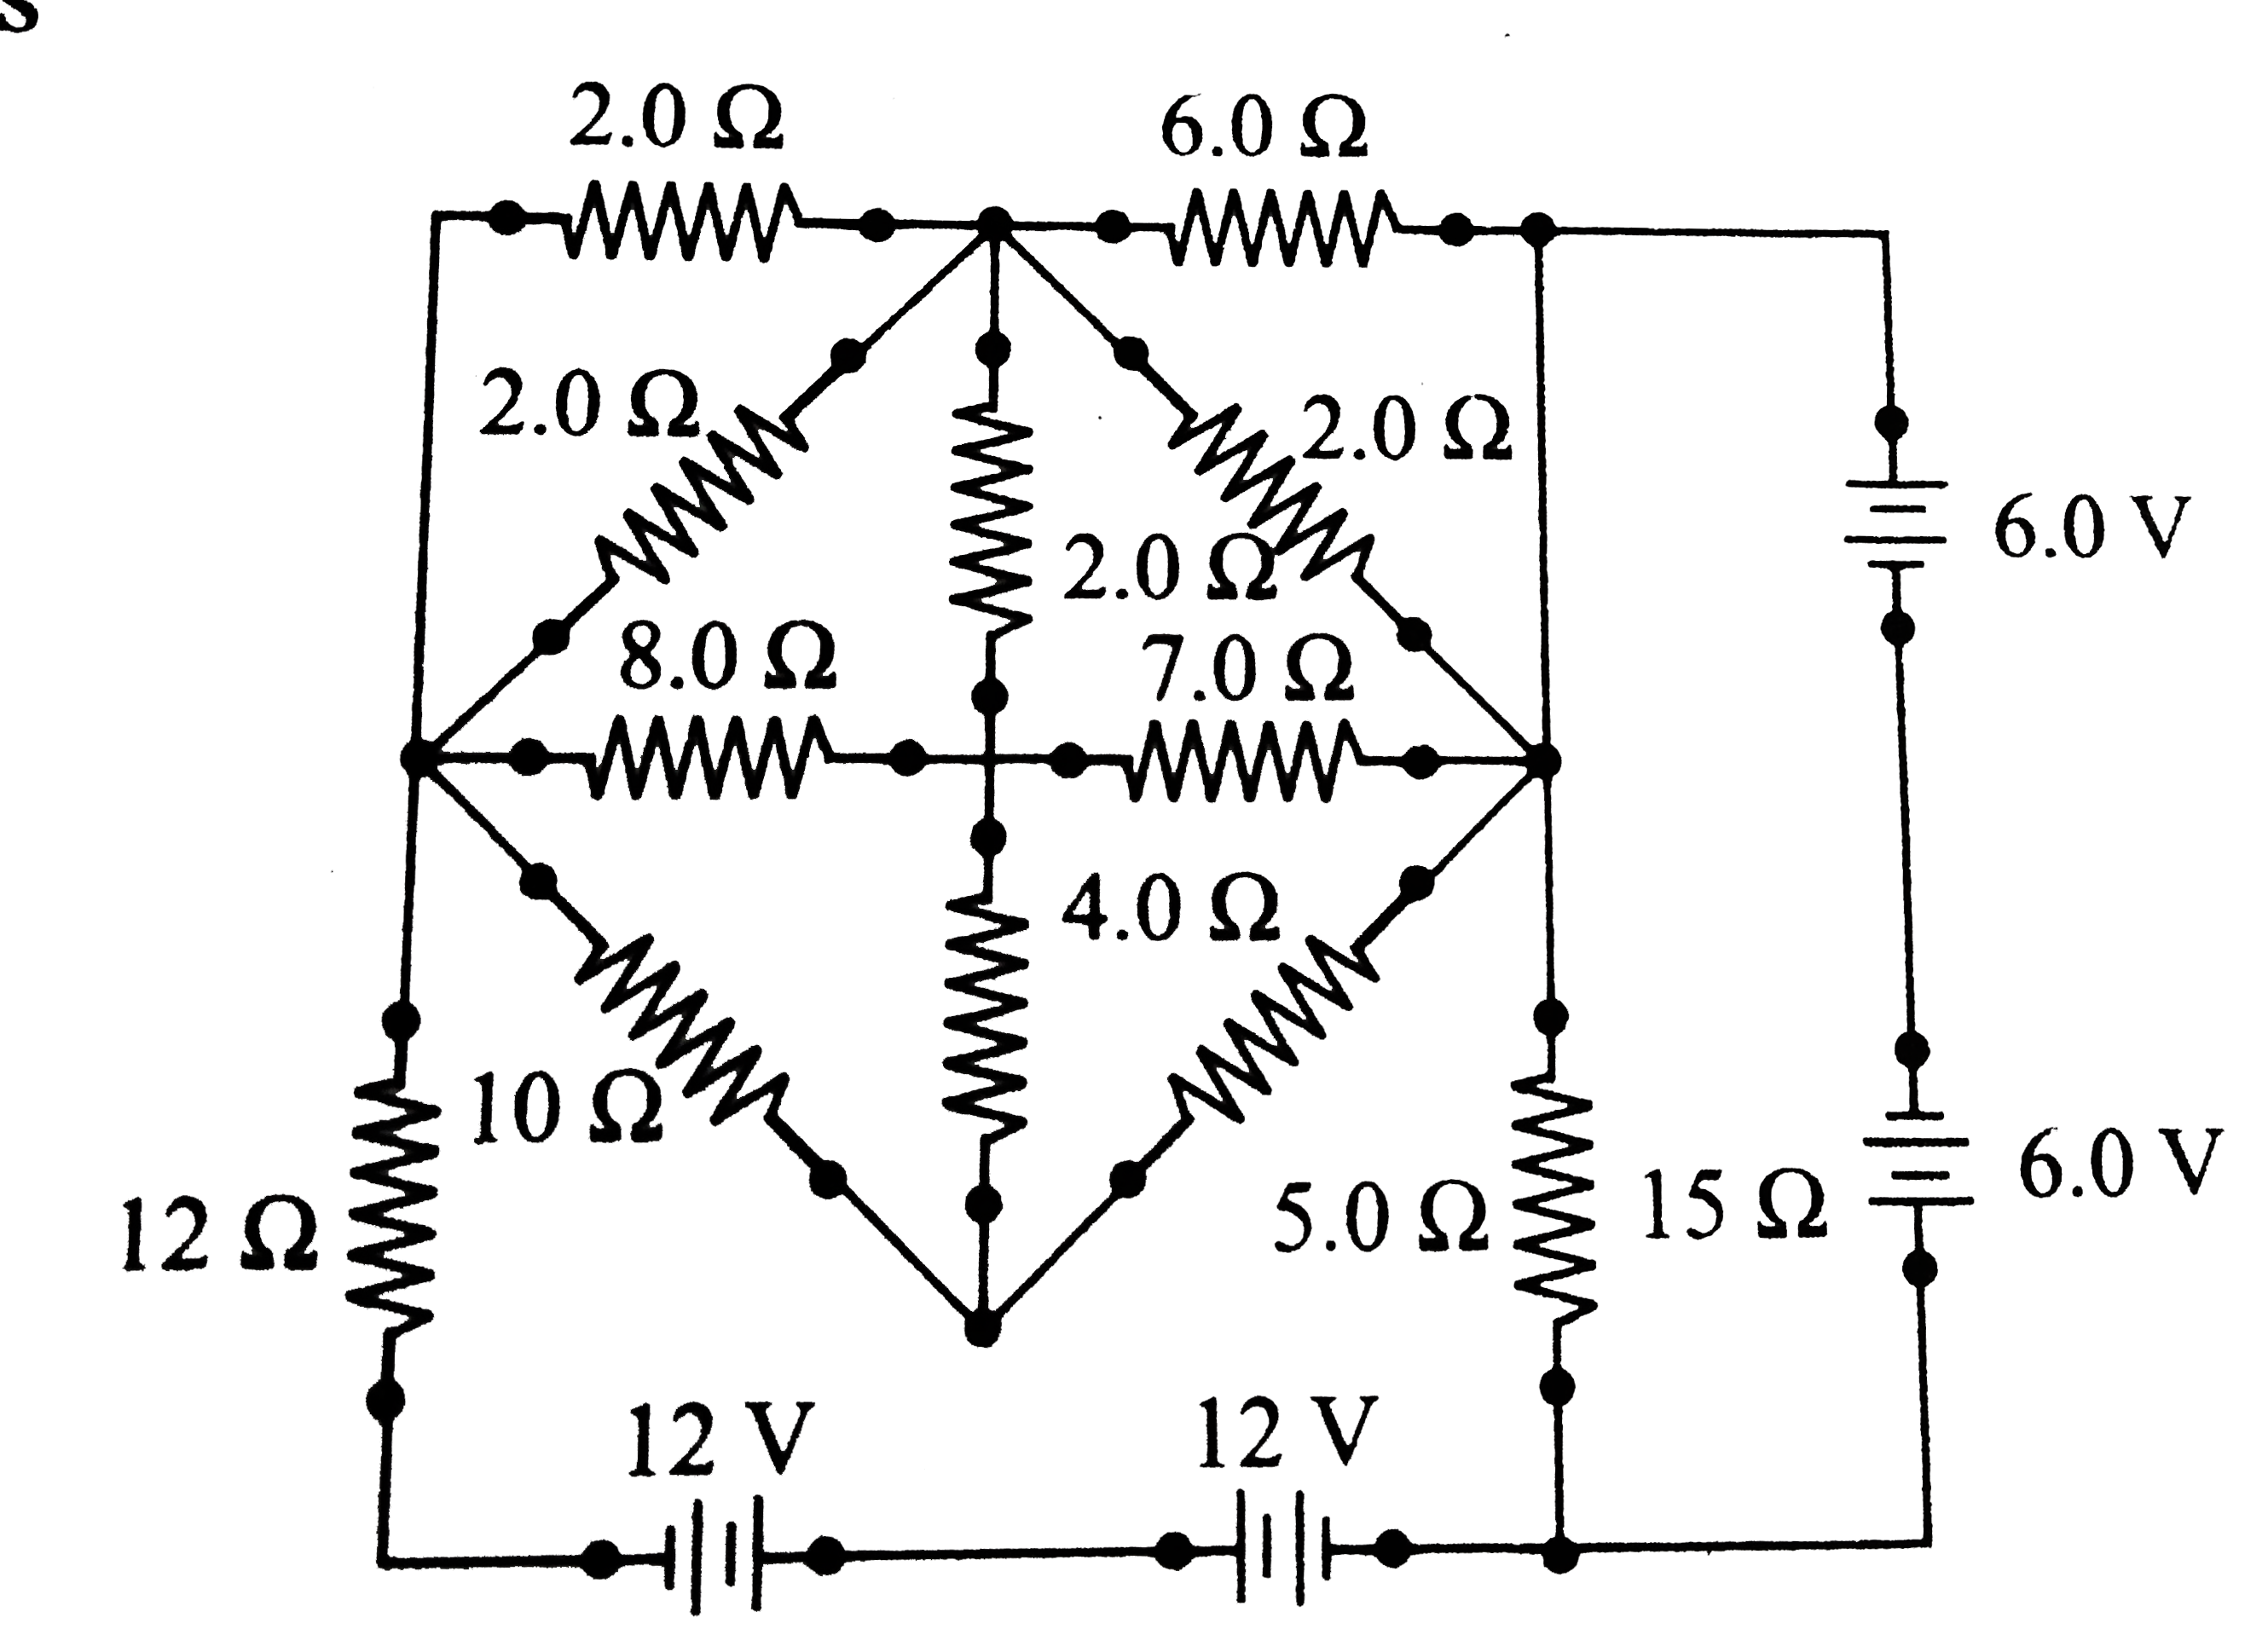
The current flowing through 10Ω resistor in the circuit shown in the figure is
 A50 mAB20 mAC40 mAD40 mA
The current through the 8Ω resistor (shown in fig.) is
 A4AB2ACzeroD2.5A
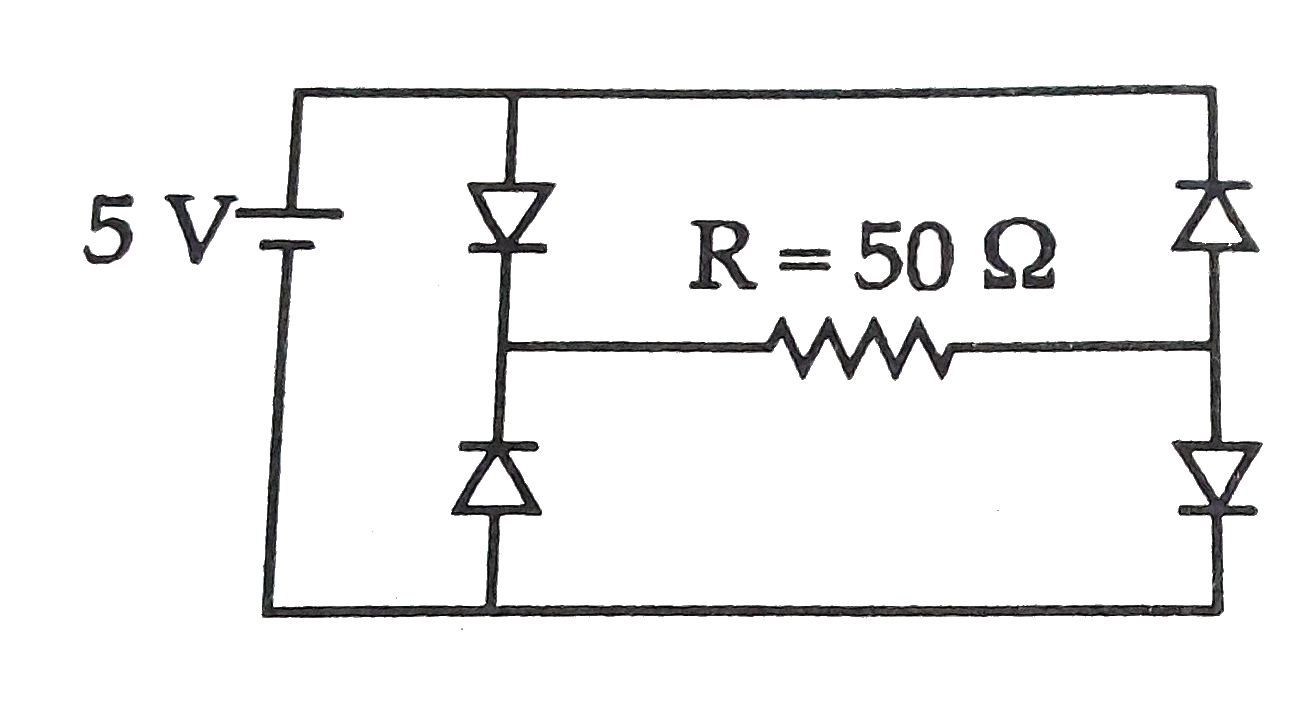
Four silicon diodes are connected as shown in the figure. Assuming the diodes to be ideal. The current through the resistor R is
View SolutionFind the currents through the three resistors shown in figure
View SolutionIn the circuit shown in figure the current through
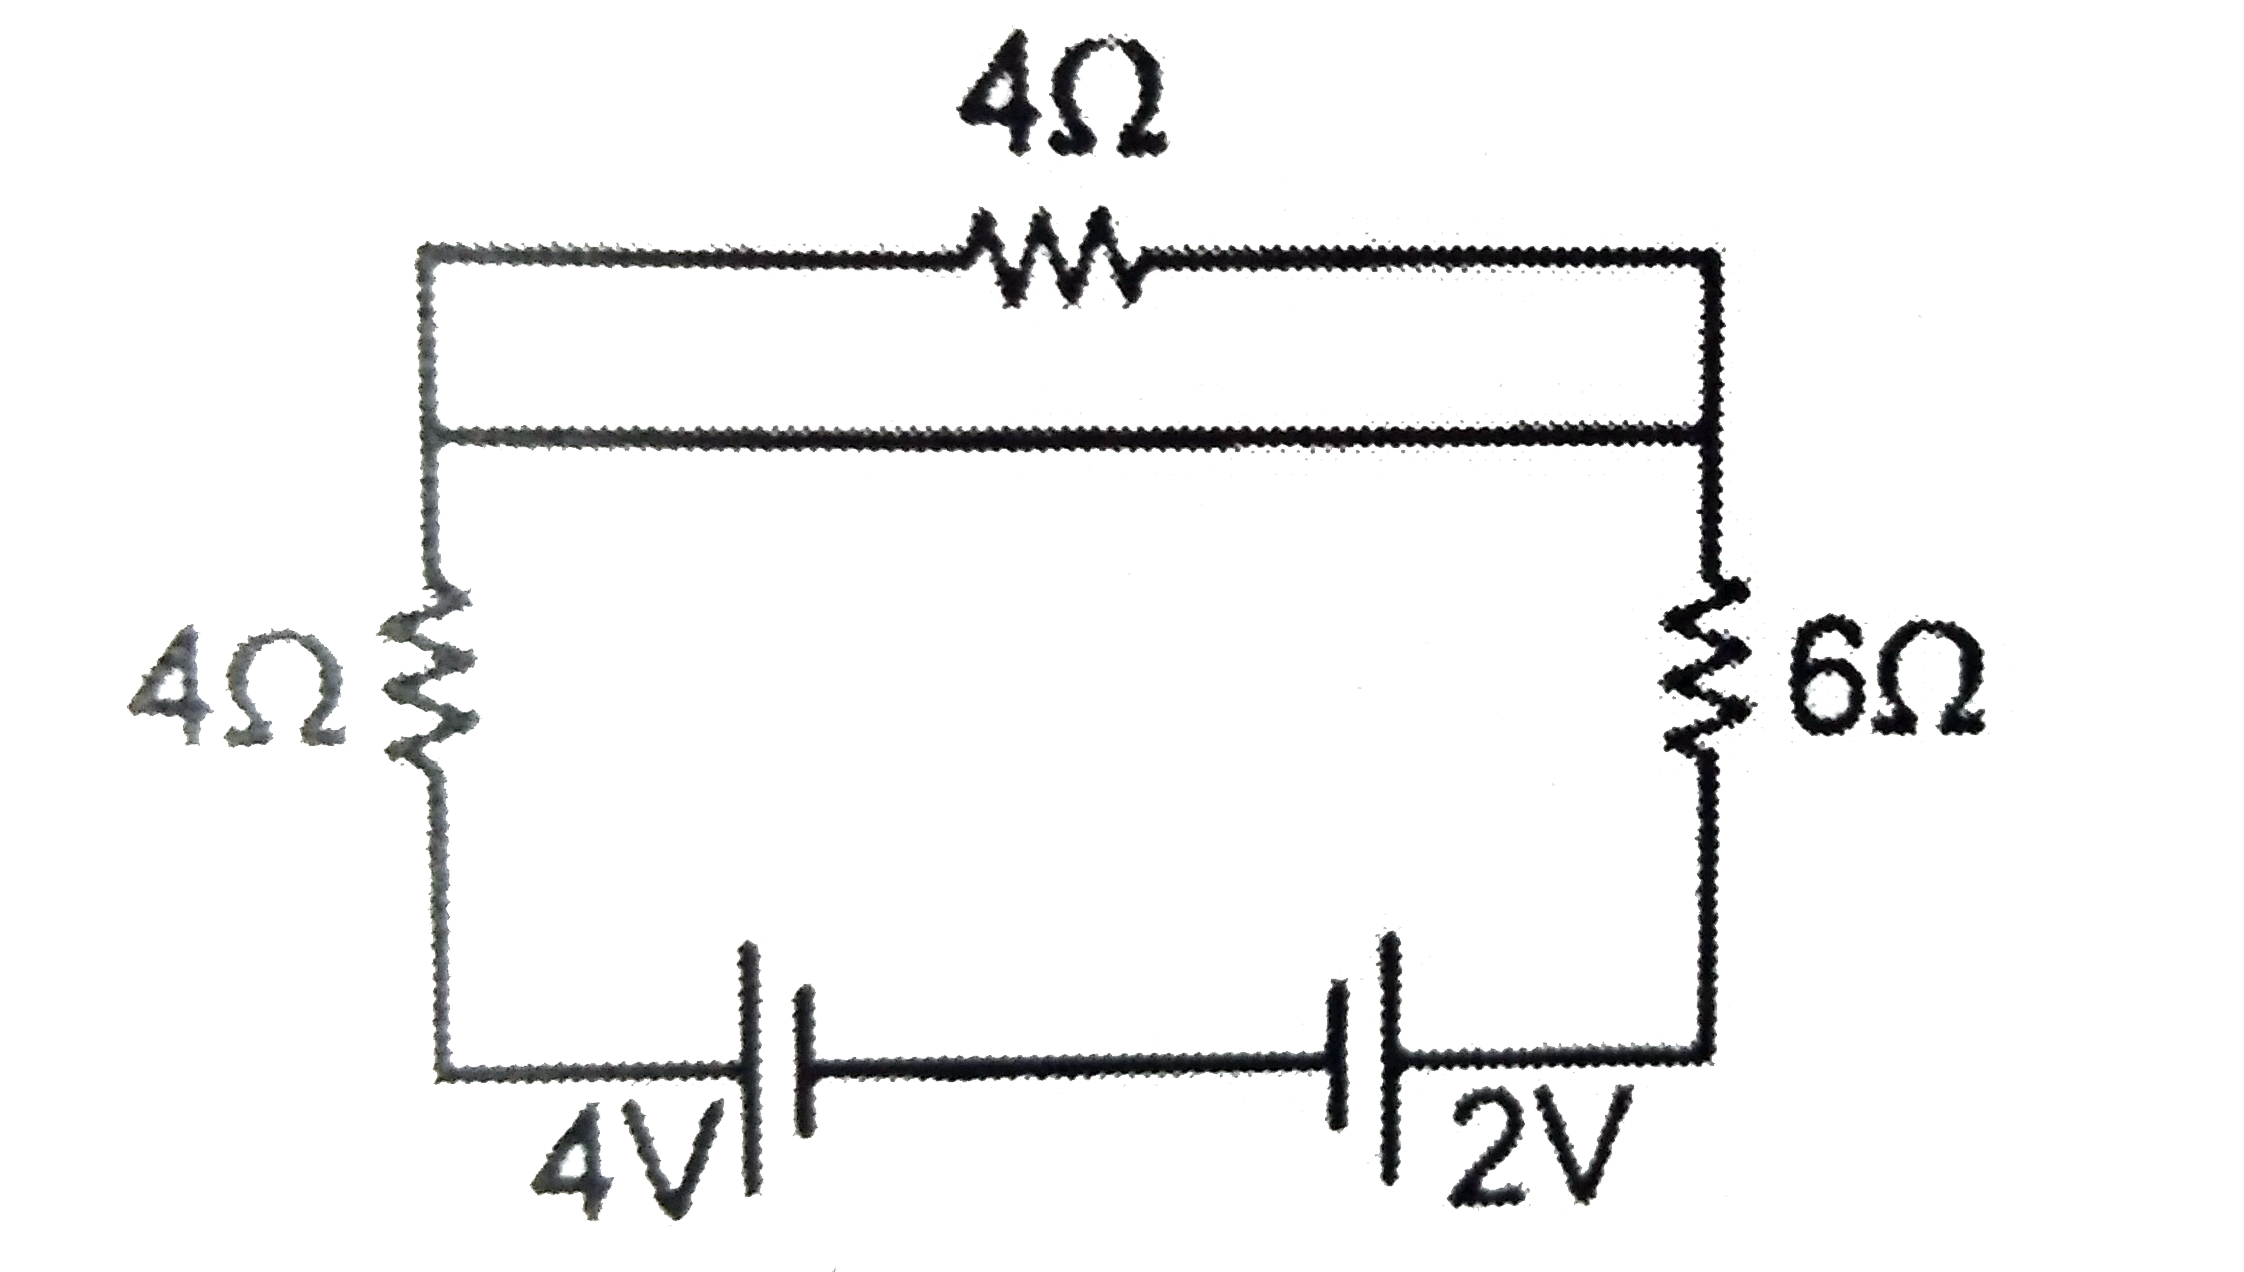
View SolutionConsider a circuit as shown in the figure.
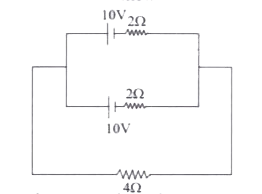
What is the current through 4 resistor ?
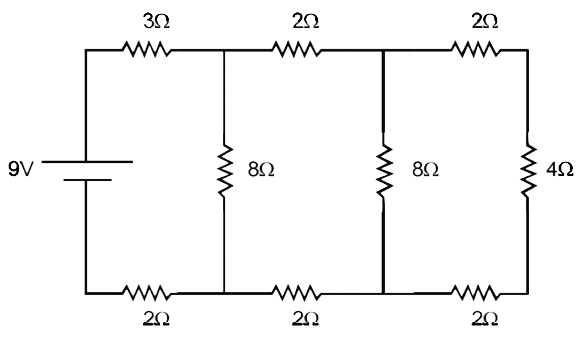
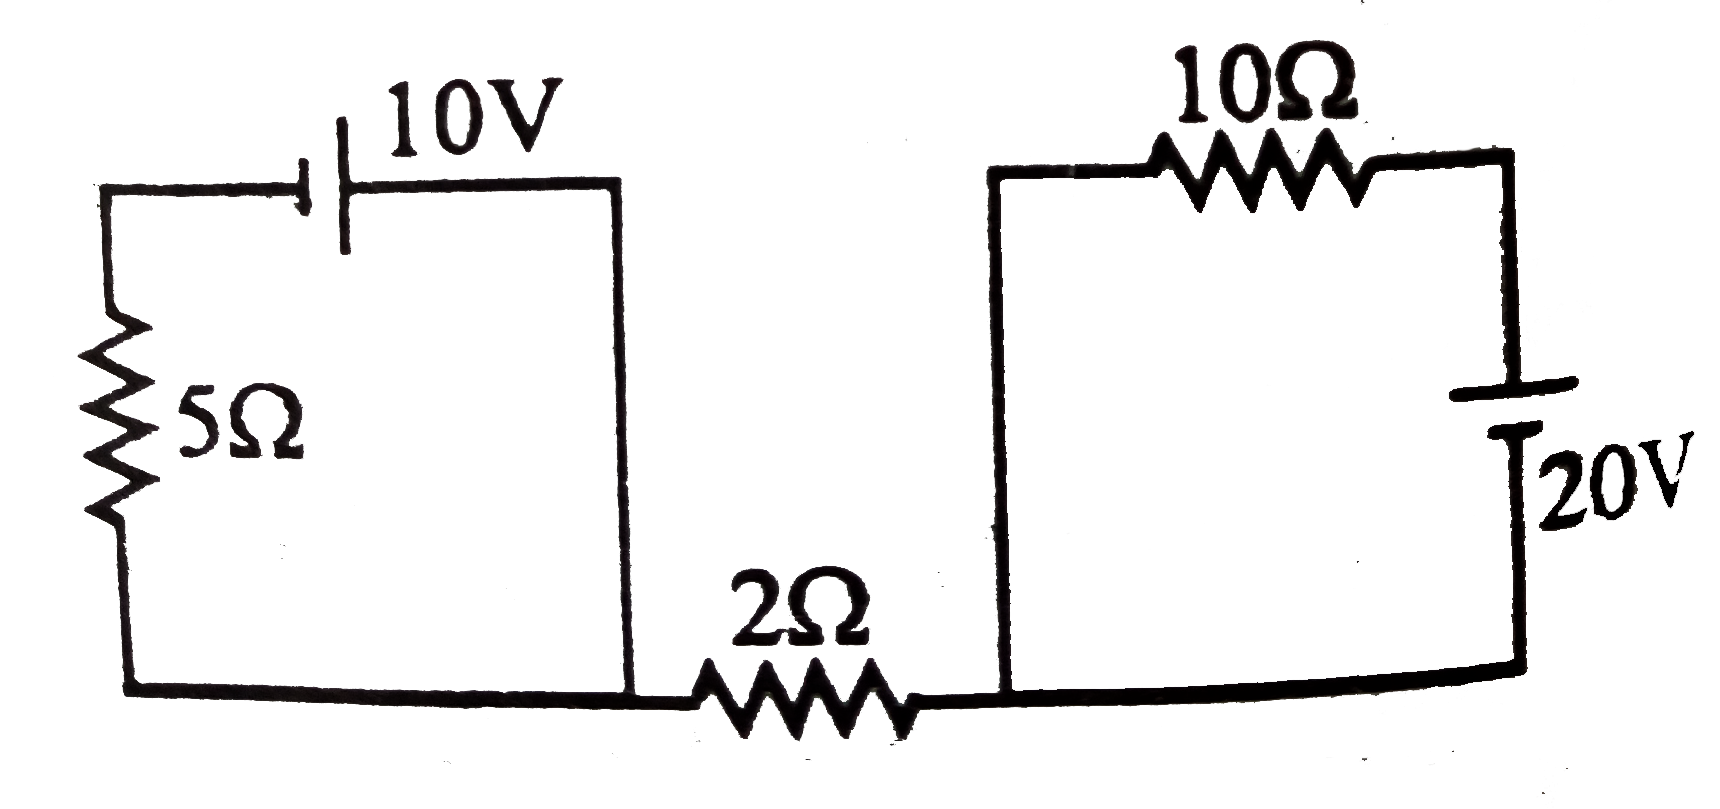
View SolutionIn the figure shown the current through 2Ω resistor is
View Solution
