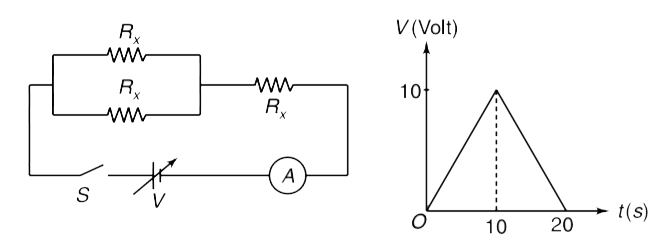
In the circuit shown, each resistor has a resistance RX which depends on the voltage VX across it.
For VX≤1V,RX=1Ω
and for VX>1V,RX=2Ω
The emf (V) of the source, changes with time (t) after the switch is closed at t=0. The variation of V with time is depicted in the graph. Plot the variation of ammeter reading with time.
The correct Answer is:(##IJAPHYV02C08E01080_A01##)
Topper's Solved these Questions
Similar Questions
Knowledge Check
In the circuit shown below E1=4.0V,R1=2Ω,E2=6.0V,R2=4Ω and R3=2Ω. The current I1 is
 A1.6AB1.8AC1.25AD1.0A
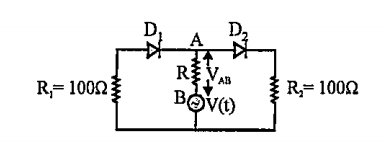
In the circuit given below, V(t) is the sinusoidal voltage source, voltage drop VAB(t) across the resistance R is
 Ais half wave rectifiedBis full wave rectifiedChas the same peak value in the positive and negative half cyclesDhas different peak values during positive and negative half cycle
In the circuit given below, V(t) is the sinusoidal voltage source, voltage drop VAB(t) across the resistance R is
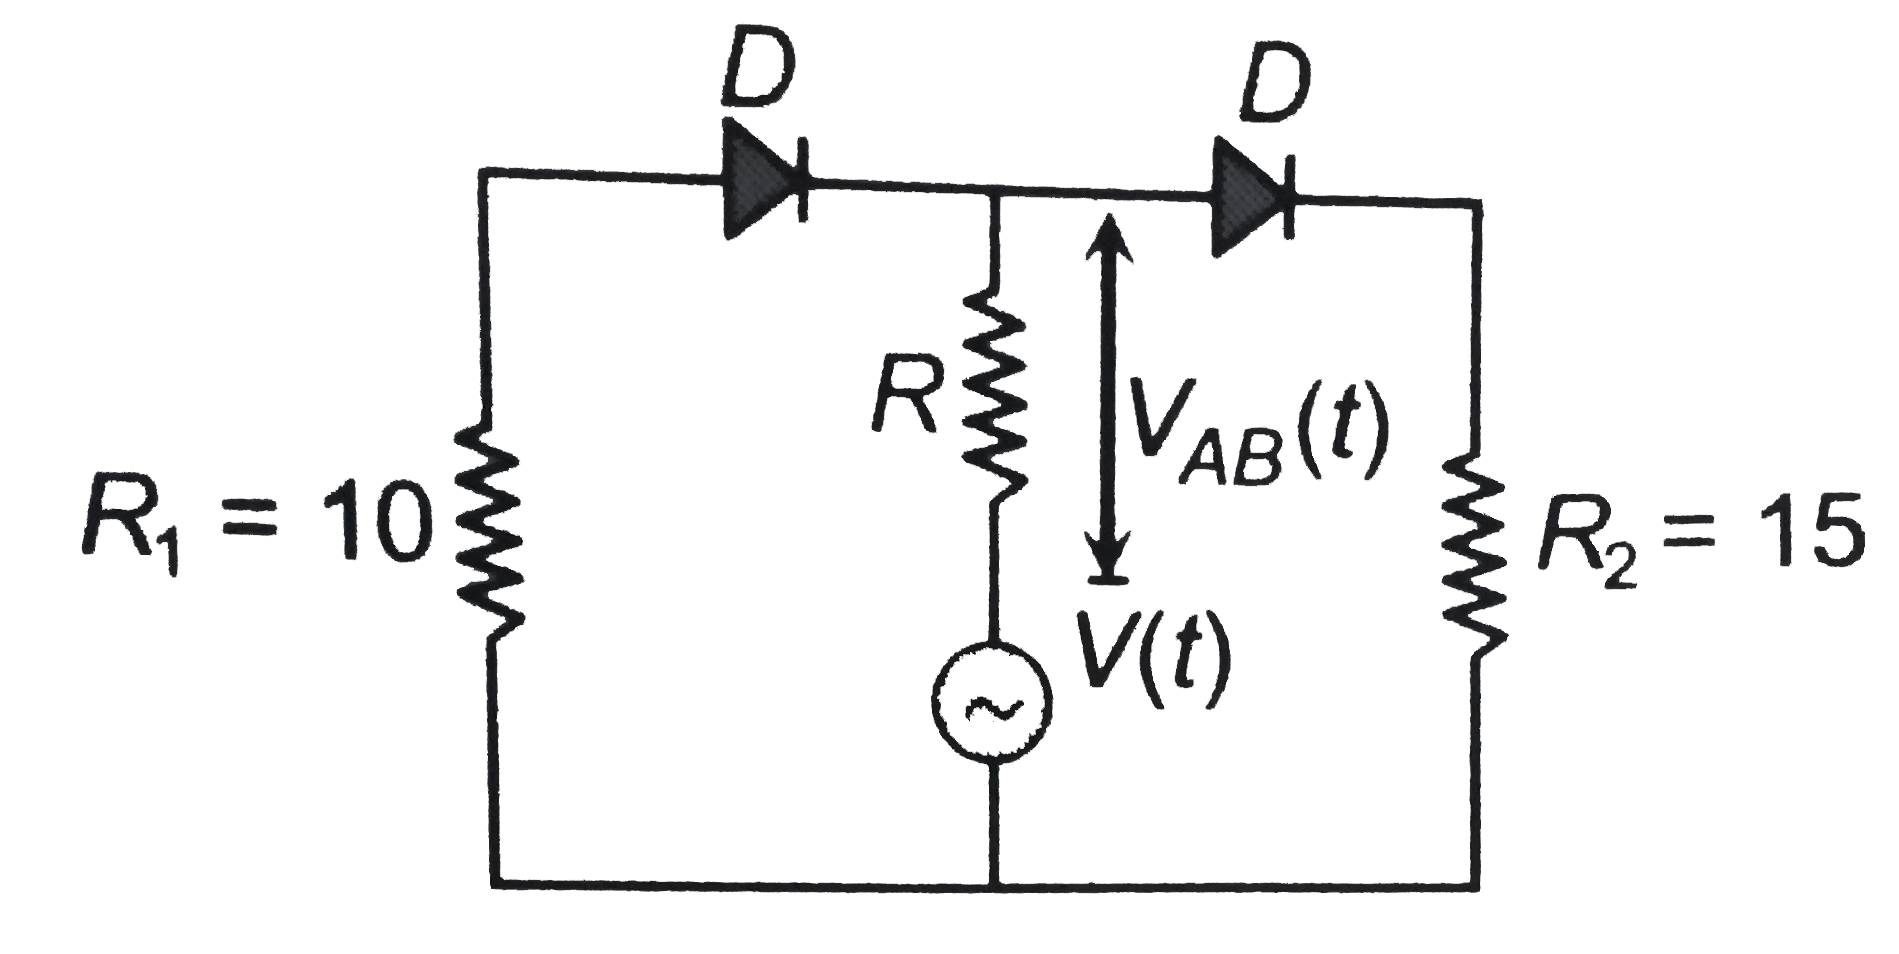 AIs half wave rectifiedBIs full wave rectifiedCHas the same peak value in the positive and negative half cyclesDHas different peak values during positive and negative half cycle
In the circuit shown, E1=7V,E2=7V,R1=R2=1Ω and R3=3Ω respectively. The current through the resistance R3
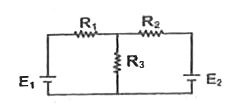
View SolutionIn the circuit shown, E1=7V,E2=7V,R1=R2=1Ω and R3=3Ω respectively. The current through the resistance R3

View SolutionAn inductor of inductance L = 400 mH and resistors of resistance R1=2Ω and R2=2Ω are connected to a battery of emf 12 V as shown in the figure. The internal resistance of the battery is negligible. The switch S is closed at t=0. The potential drop across L as a function of time is
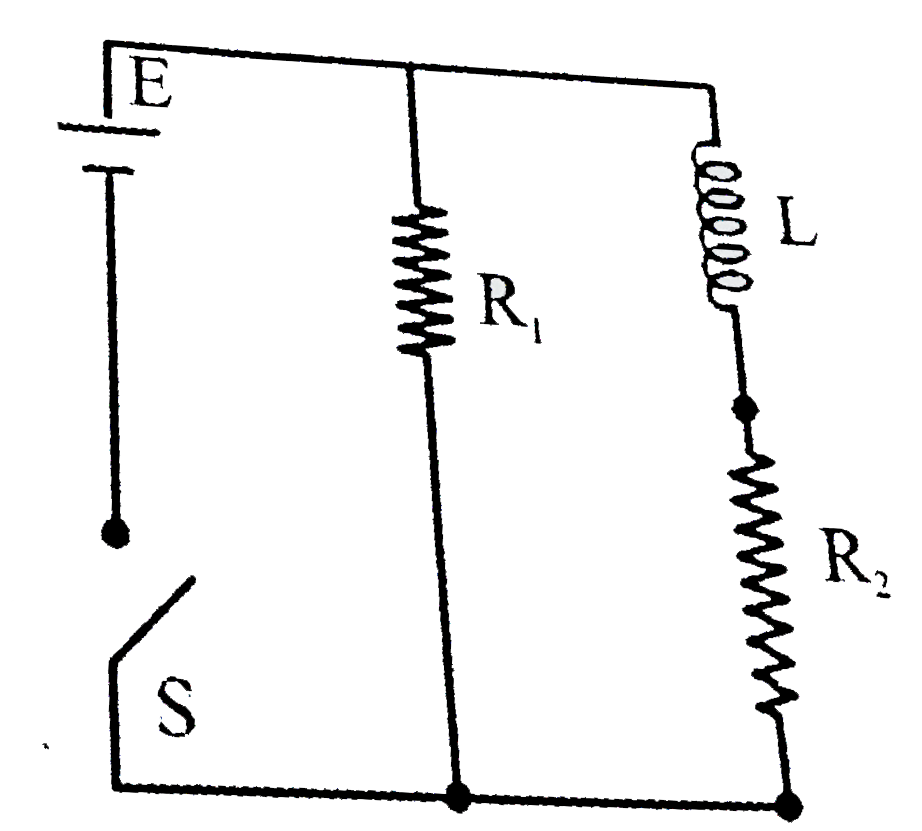
View SolutionAn inductor of inductance L = 400 mH and resistors of resistance R1=2Ω and R2=2Ω are connected to a battery of emf 12V as shown in the figure.The internal resistance of the battery is negligible.The switch S is closed at t = 0.The potential drop across L as a function of time is
View SolutionIn the circuit shown, E1=7V,E2=7V,R1=R2=1Ω and R3=3Ω respectively. The current through the resistance R3

View Solution

