Figure is given a plot of the cooordinate of the body against time. From t1 to t2 the graph is a parabola.
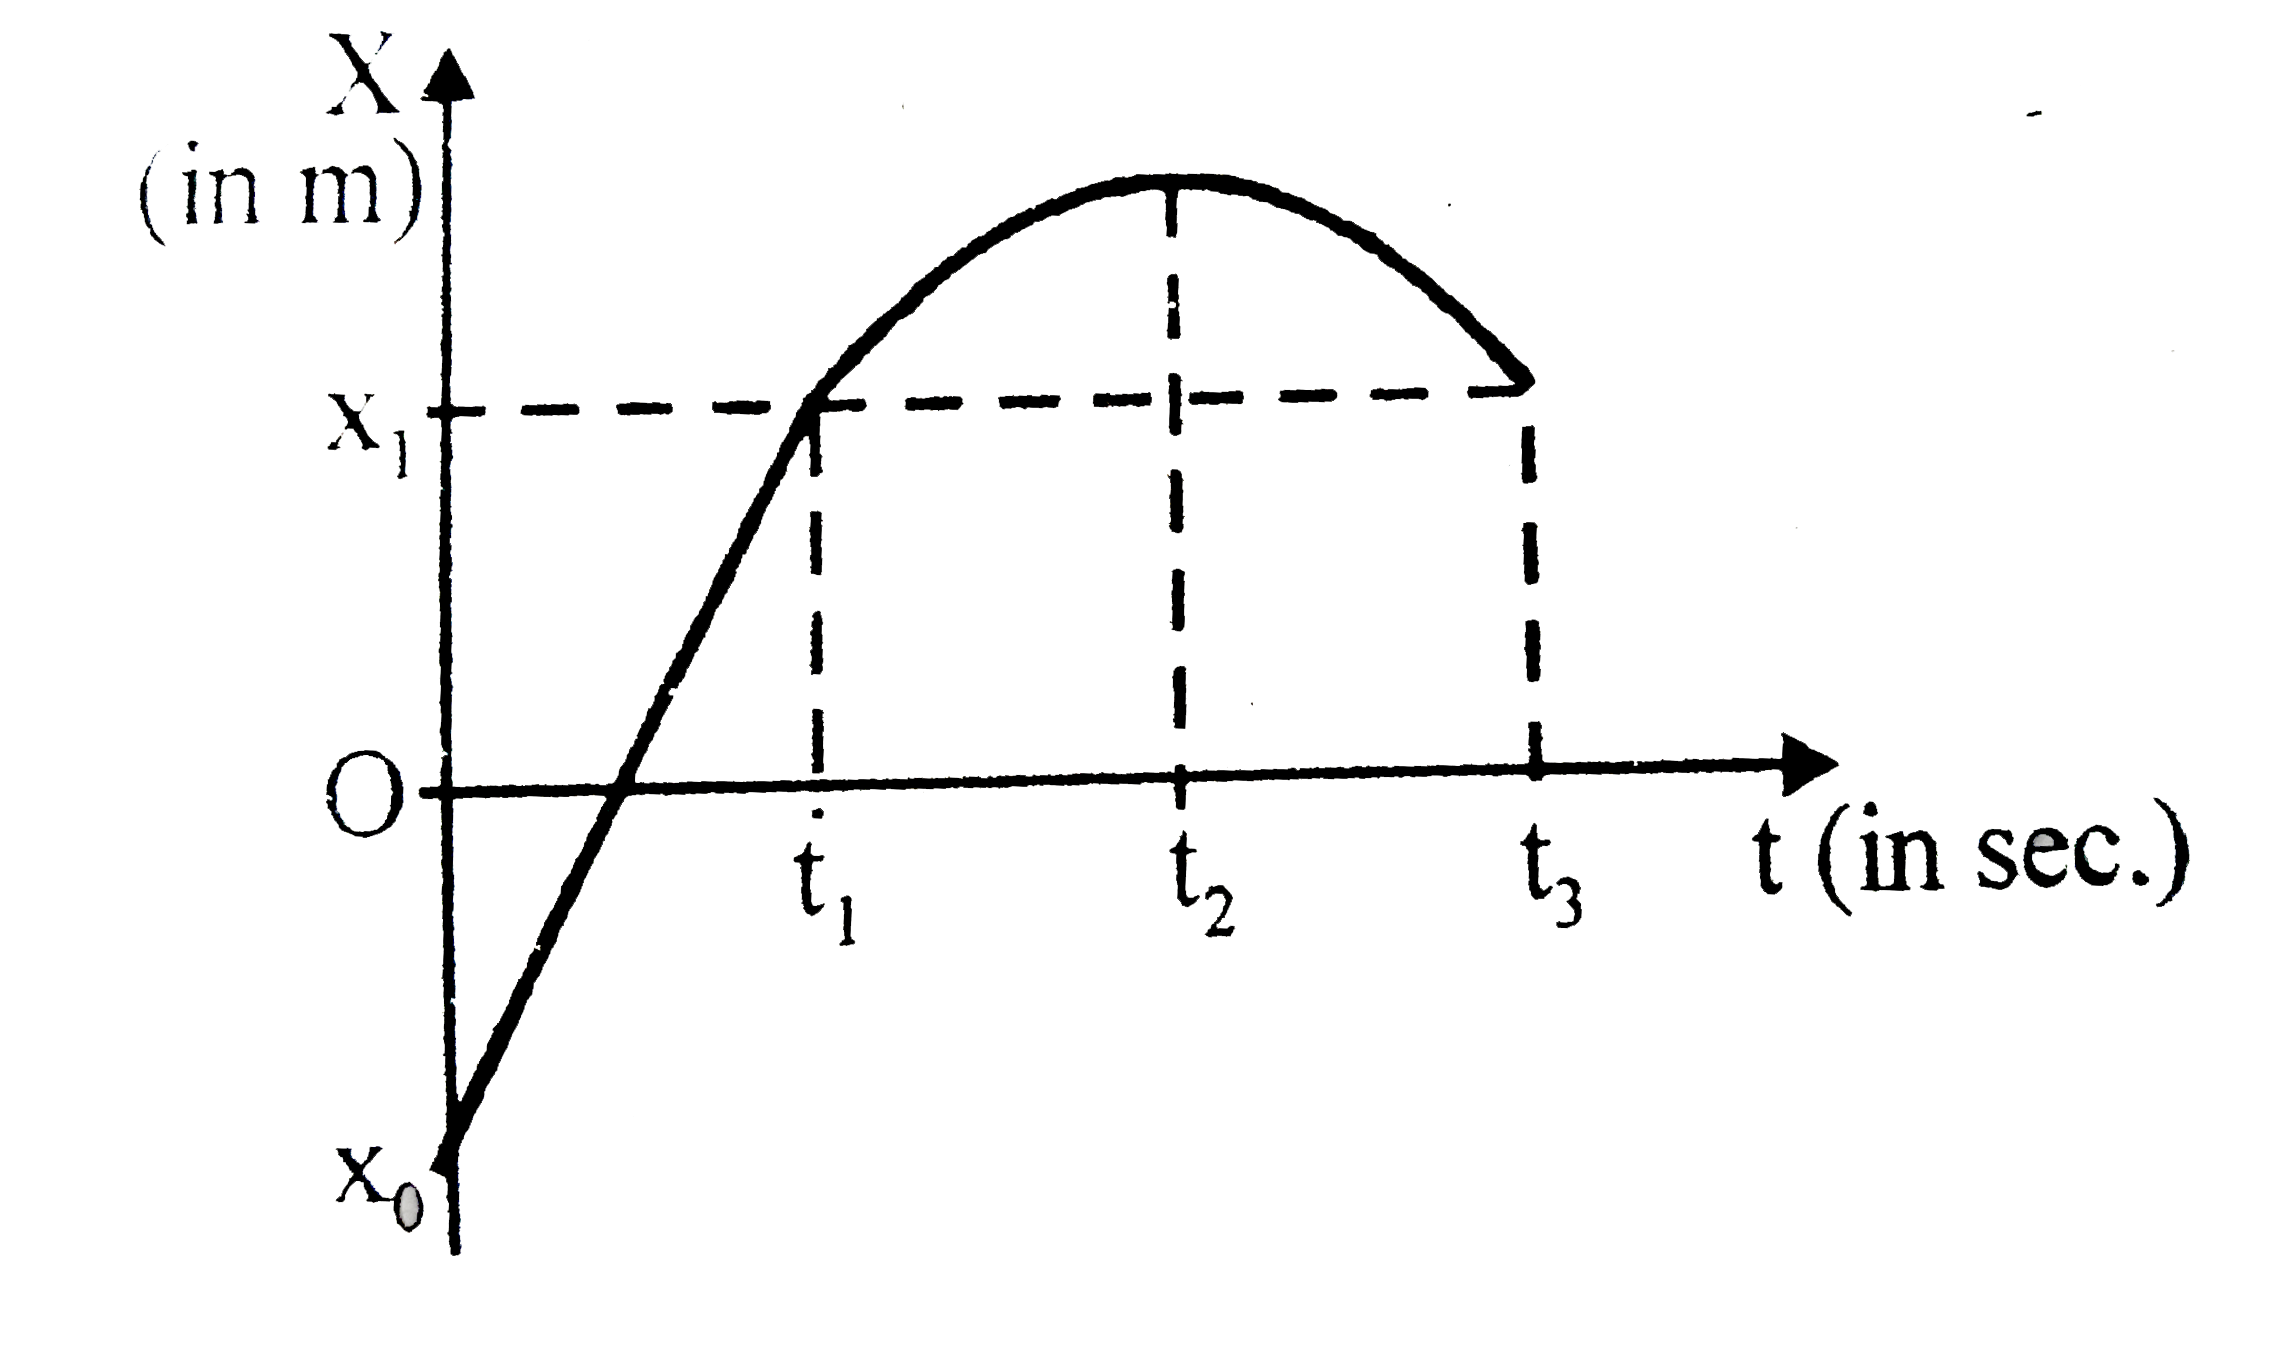
The acceleration from t1 to t3 is 2(x1−x0)t1(t3−t1)
The initial velocity is x1−x0t1
The maximum x coordinates is x1+(x1−x0)(t3−t1)t1
The body is speeding up at all times.
The correct Answer is:ABCD
u=x1−x0t1
a=u−(−u)t3−t1=2(x1−x0)t1(t3−t1)
at xmaxV=0
v2−u2−2as
02=(x1−x0t1)22×2(x1−x0)t1(t3−t1)×(x−x1)
(x1−x04t1)(t3−t1)=x−x1
x=x1+(x1−x0)(t3−t1)4t1
Topper's Solved these Questions
- BOOK - BANSALCHAPTER - TEST PAPERSEXERCISE - PHYSICS PART (A)32videos
TEST PAPERS
- BOOK - BANSALCHAPTER - TEST PAPERSEXERCISE - PHYSICS PART (B)3videos
TEST PAPERS
- BOOK - BANSALCHAPTER - TEST PAPERSEXERCISE - PHYSICS PART- C4videos
TEST PAPERS
- BOOK - BANSALCHAPTER - SEMICONDUCTORSEXERCISE - CBSE Question32videos
SEMICONDUCTORS
Similar Questions
Knowledge Check
- Question 1 - Select One or More
The figure shows the velocity (v) of a particle plotted against time (t).
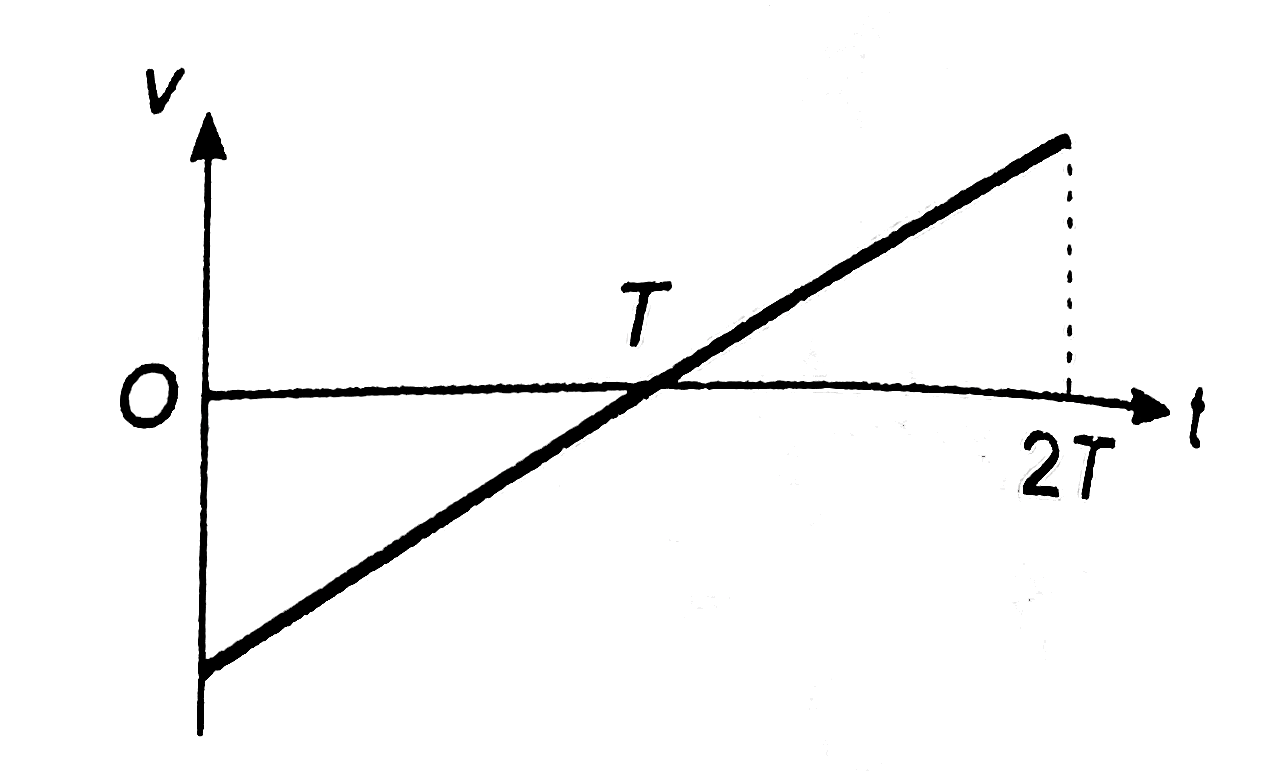 AThe particle changes its direction of motion at some point.BThe acceleration of the particle remains constantCThe displacement of the particle is zeroDThe initial and final speeds of the particle are the same
 - Question 2 - Select One or More
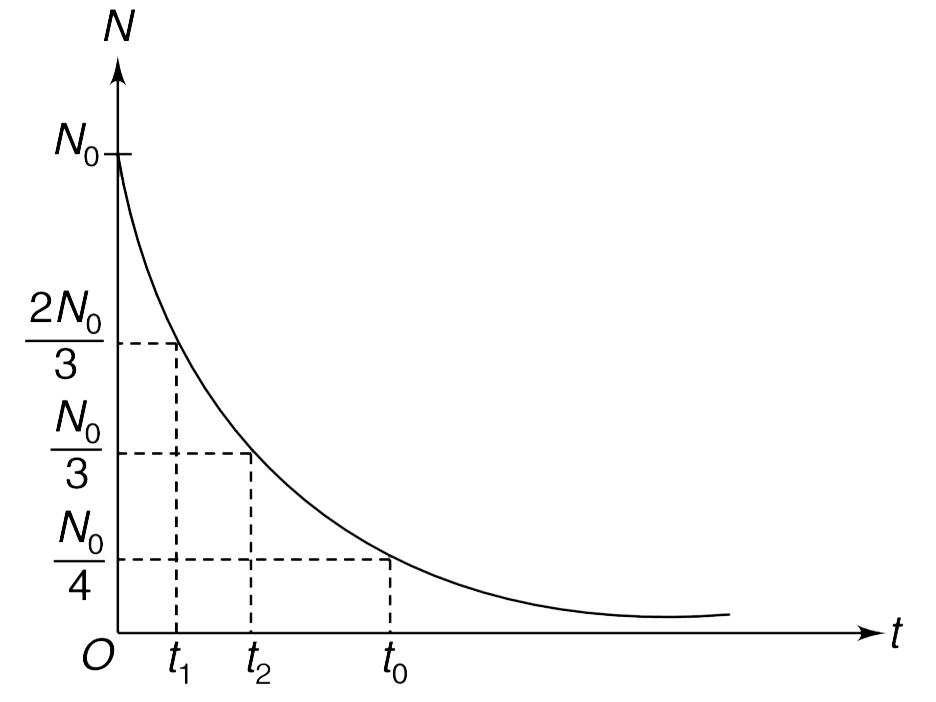
In the shown figures (1) and (2), capacitors are in steady state. Charging batteries are removed a switches S1 and S2 are closed at time t=0. The plot In I (I is the current in the resistor ) against time t the resitors R1 and R2 are shown in the figure. Choose the correct option (s)
(1) AIf ε1=2ε2,R1 must be equal to 2R2BIf R1=R2,C1 must be less than C2CIf C1=C2,R1 must be less than R2DR1C1 is equal to R2C2
 - Question 3 - Select One
For a planet, the graph of T2 against r3 is plotted. The slope of the graph is
A4πGMB4π2GMCGM4π2DGM4π
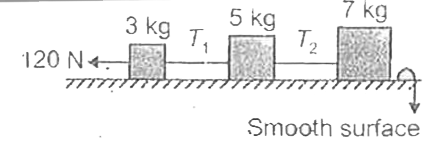
Find T1andT2 in the given figure .
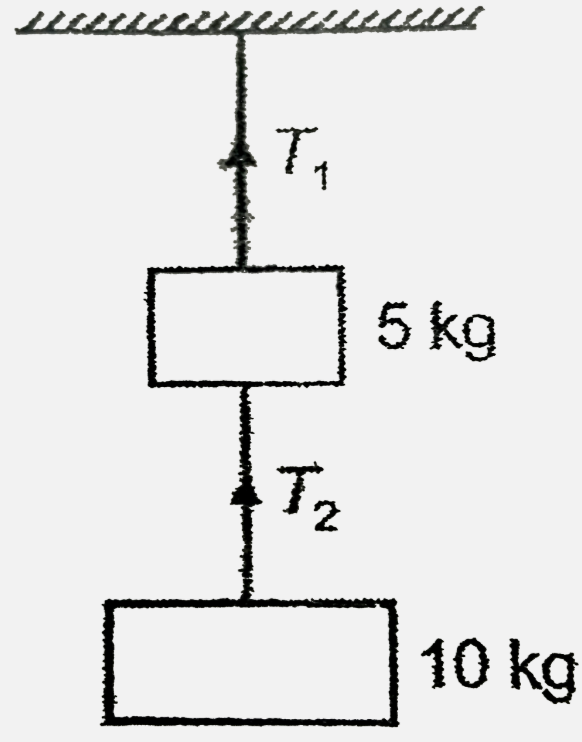 View Solution
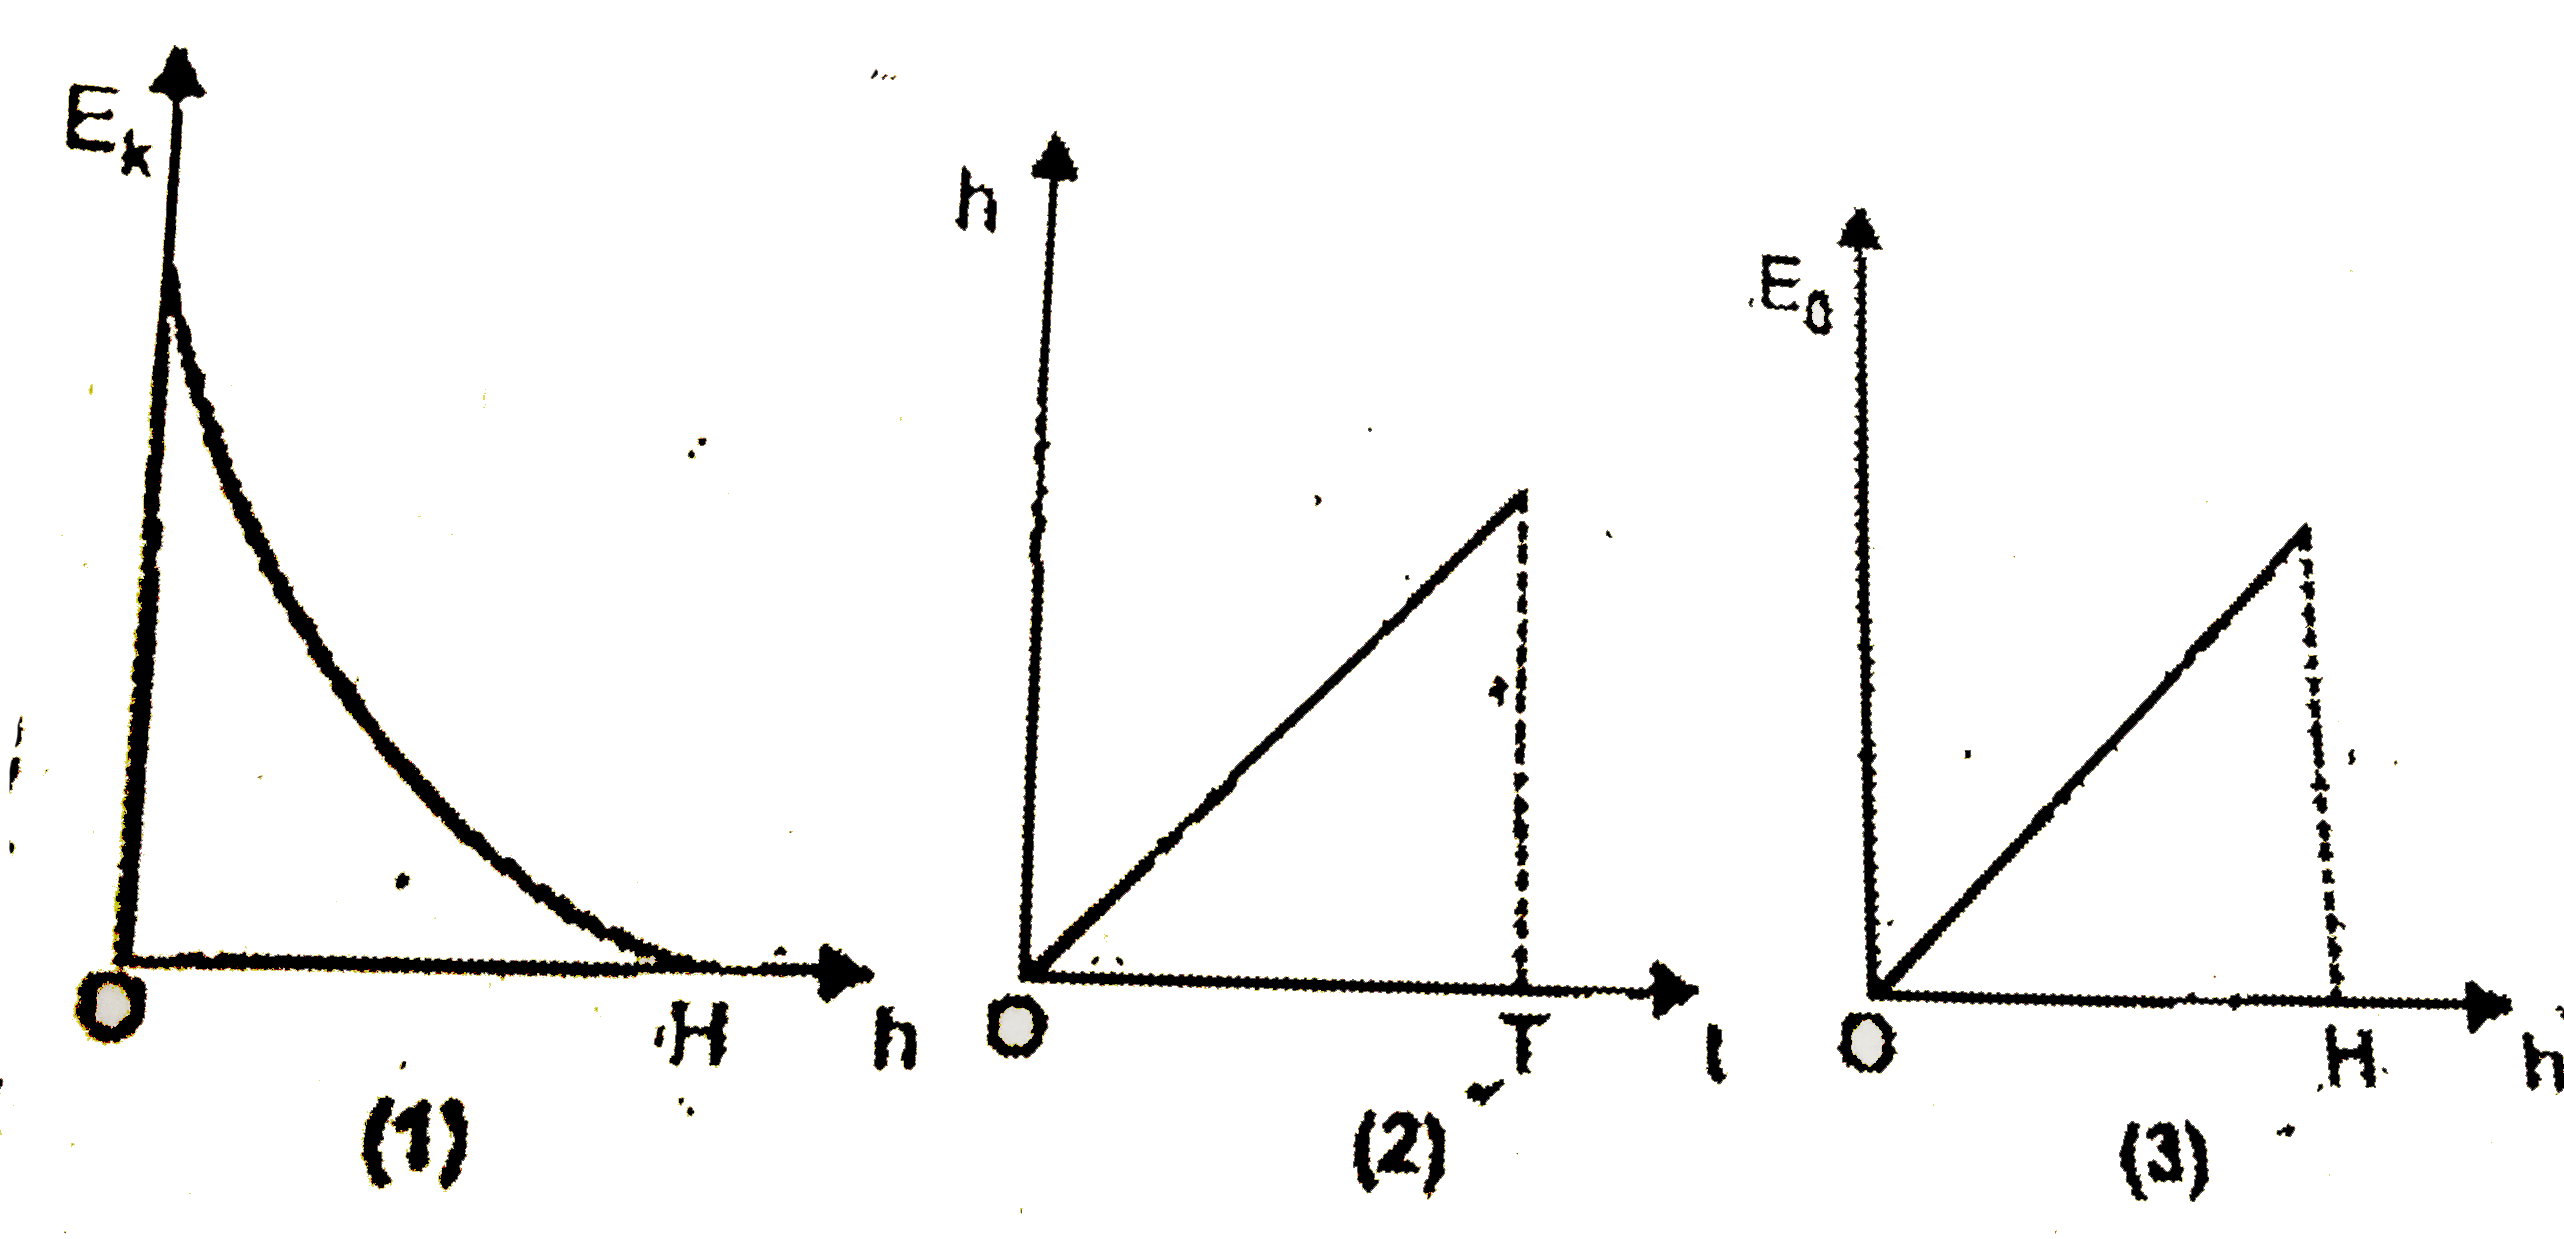
A ball is projected vertically upwards. Air resistance and variation in g may be neglected. The ball rises to its maximum height H in a time T, the height being h after a time t :
(1) The graph of kinetic energy Ek of the ball against height h is shown in figure 1
(2) The graph of height h against time t is shown in figure 2
(3) The graph of gravitational energy Ek of the ball against height h is shown in figure 3
(1)
Two particles move on a circular path ( one just inside and the other just outside) with angular velocities ro and 5ω starting from the same point. Then :View SolutionA ball is projected vertically upwards. Air resistance and variation in g may be neglected. The ball rises to its maximum height H in a time T, the height being h after a time t :
(1) The graph of kinetic energy Ek of the ball against height h is shown in figure 1
(2) The graph of height h against time t is shown in figure 2
(3) The graph of gravitational energy Ek of the ball against height h is shown in figure 3
(1)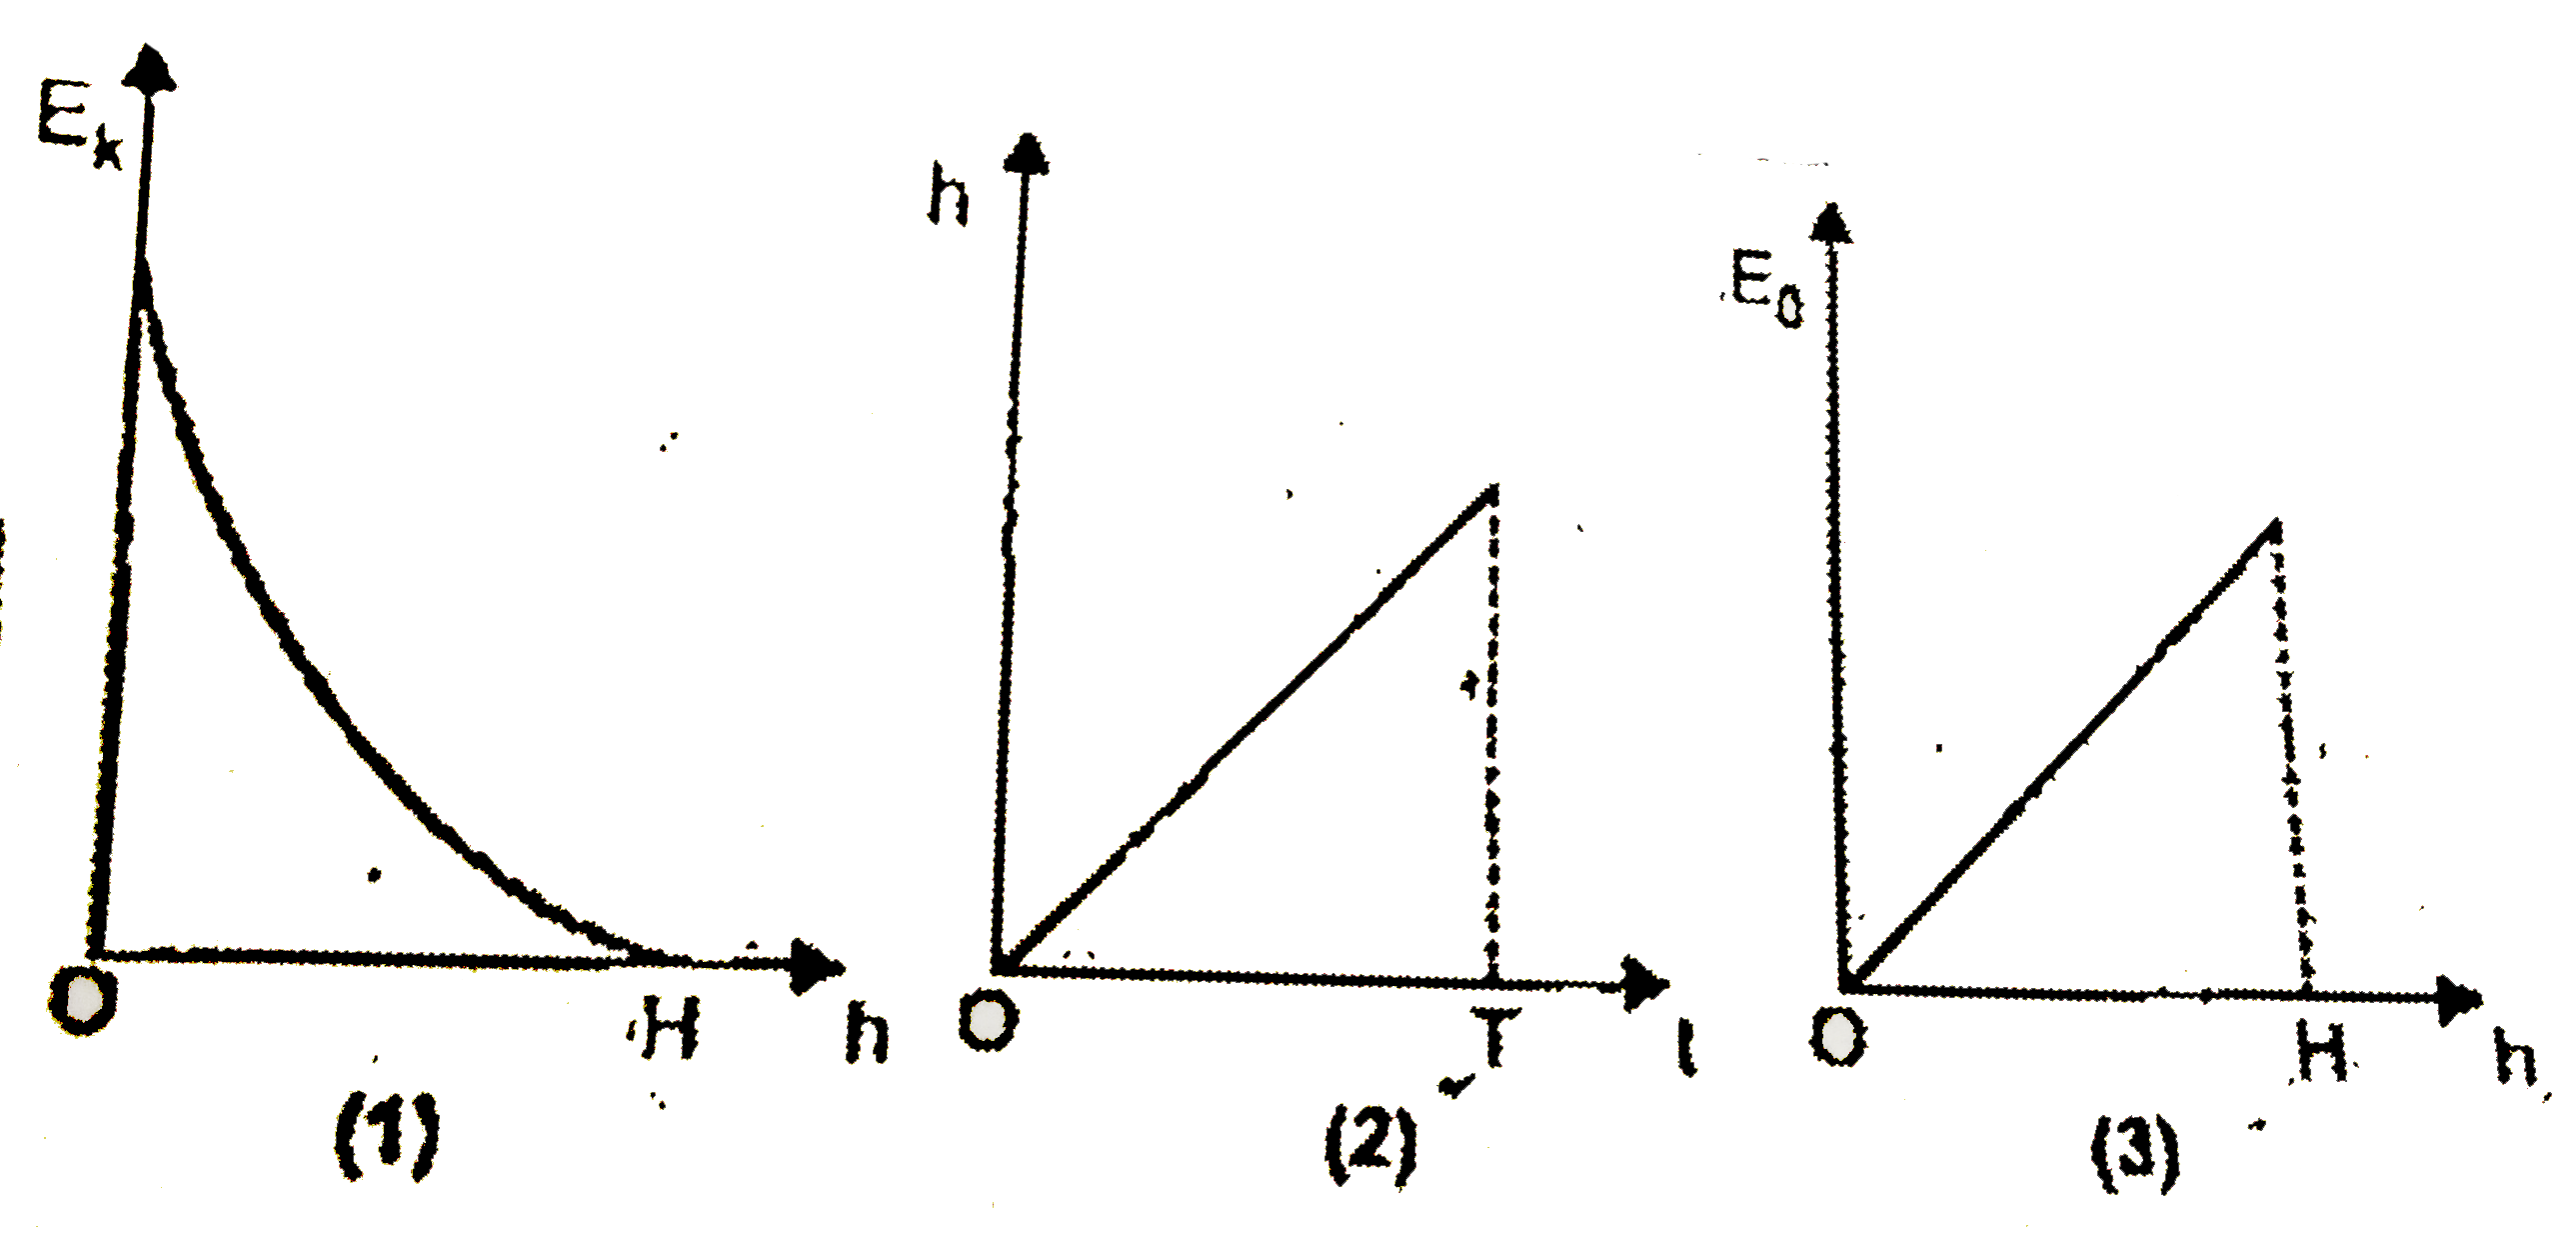
-Which the figure shows the correct answers ?View SolutionIn figure shown, the graph shows the variation of acceleration of body with time t. The velcocity of the body at t=0 is zero. The velocity of the body at t=30s is.
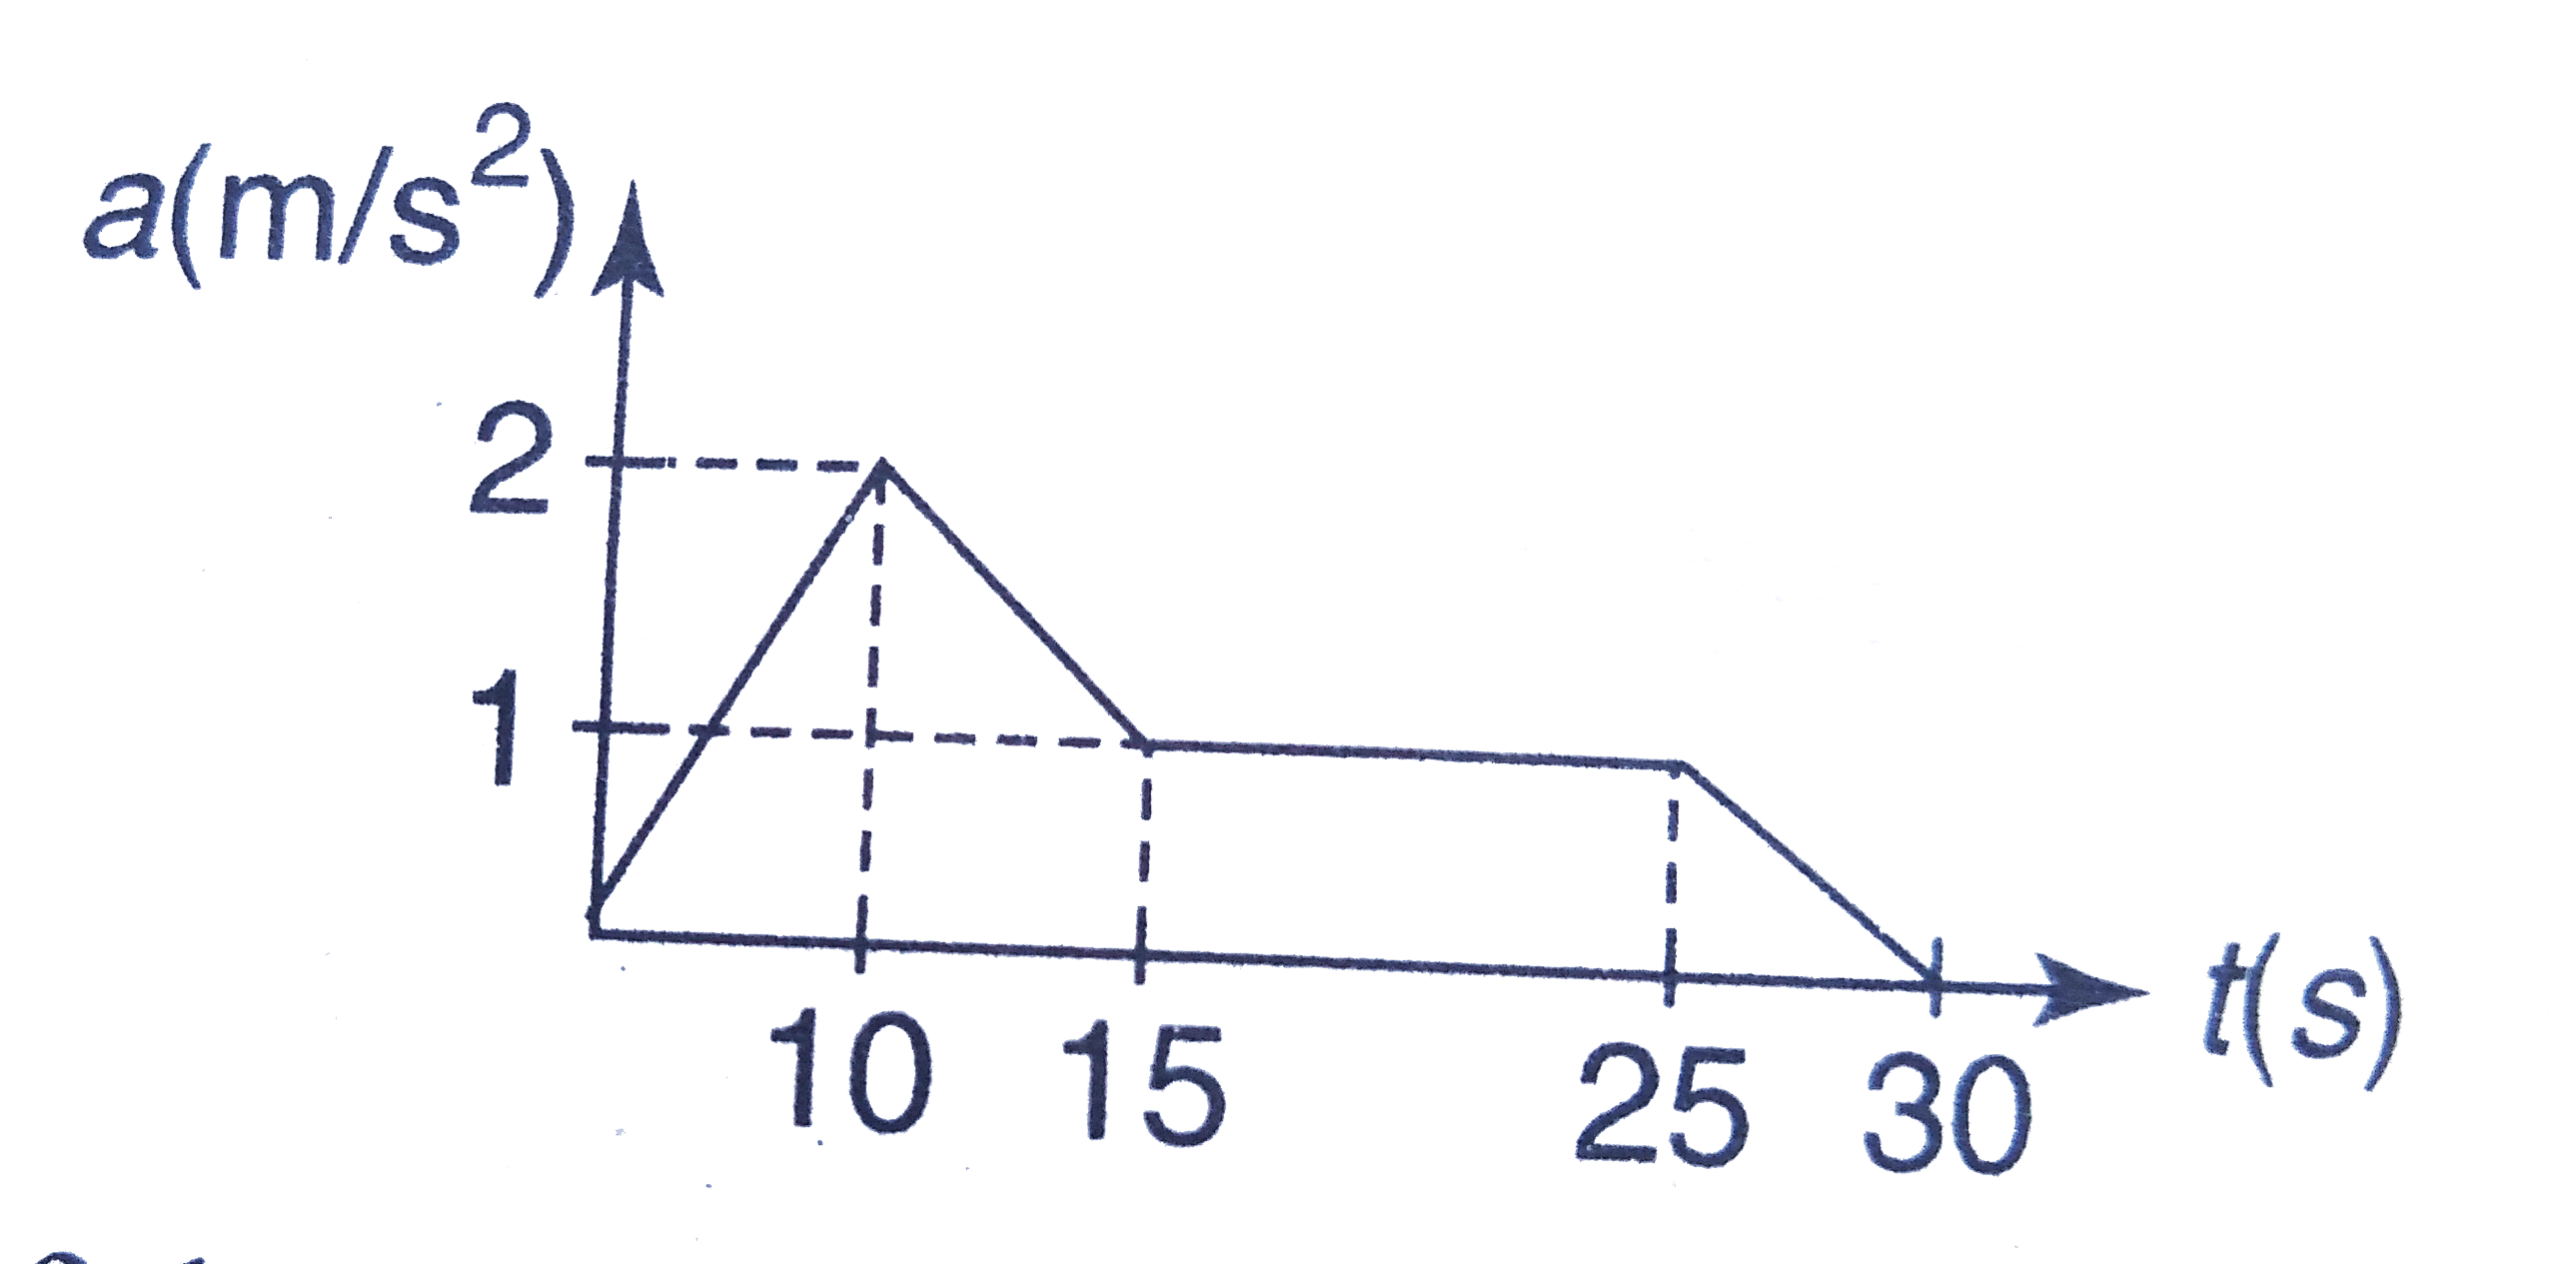 View Solution
The temperature of an spherical isolated black body falls from T1 and T2 in time t them time t is
View Solution


