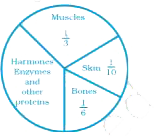
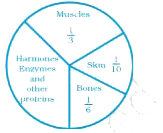
Pie-diagram or a pie-chart is a poctirial representation of the numerical data by non-intersecting adjacent sectors of the circle such that area of sector is proportional to the magnitude of the data represented by the sector.
Step by step video & image solution for Pie-diagram or a pie-chart is a poctirial representation of the numerical data by non-intersecting adjacent sectors of the circle such that area of sector is proportional to the magnitude of the data represented by the sector. by Maths experts to help you in doubts & scoring excellent marks in Class 8 exams.
Similar Questions
Knowledge Check
- Question 1 - Select One
Consider the following statements in respect of a histogram:
1. The histogram consists of vertical rectangular bars with a common base such that there is no gap between consecutive bars.
2. The height of the rectangle is determined by the frequency of the class it represents.
Which of the statements given above is/are correct?AOnly IIBOnly IICBoth I and IIDNeither I nor 2 - Question 2 - Select One
Consider the following statements :
1. Pie diagrams are suitable for catagorical data.
2. The arc length of a sector of a pie diagram is proportional to the value of the component represented by the sector.
Which of the statements given above is/are correct/A1 onlyB2 onlyCBoth 1 and 2DNeither 1 nor 2 - Question 3 - Select One
A pie-diagram representing the following data is_____
 A
A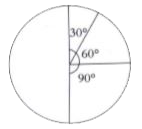 B
B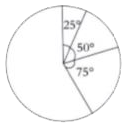 C
C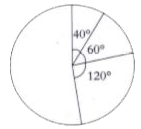 D
D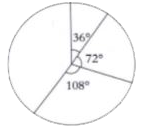
In the given pie chart what is the central angle of the sector representing the number of employees in the department D?
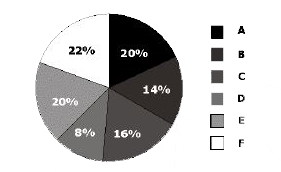 View Solution
Data collected in a survey shows that 40% of the buyers are interested in buying a particular brand of toothpaste. The central angle of the sector of the pie chart representing this information is
View SolutionIF a pie chart is drawn representive the number of students in all five colleges, what is the central angle whole of the sector representing the students of colleges B?
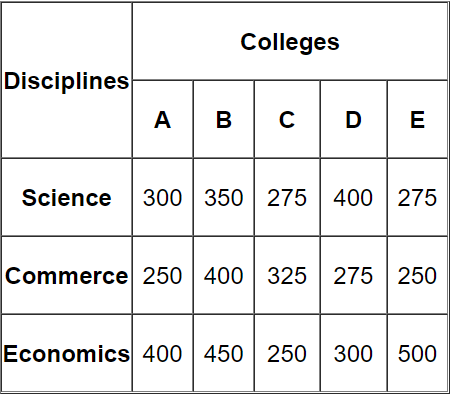 View Solution
The HR department of an MNC prepared a report. The pie chart from this report represents all the employees of the MNC and the languages that they speak. Study the diagram and answer the following questions.
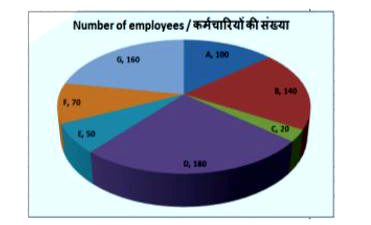
The measure of the central angle of the sector representing language A is __________ degrees.
(a)60
(b)50
(c)100
(d)25View Solution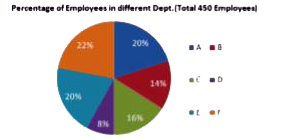
In the given pie-chart, what is the central angle of the sector representing the number of employees in the department D?View Solution

