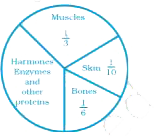
The central angle of the sectors in a pie chart will be a fraction of 360∘
The correct Answer is:True.
To solve the question regarding the central angle of sectors in a pie chart, we can follow these steps:
1. Understanding the Pie Chart: A pie chart represents data in a circular format, where each sector (or slice) corresponds to a category of data.
2. Total Central Angle: The total central angle in a pie chart is always 360 degrees. This represents the full circle.
3. Central Angle of Each Sector: Each sector in the pie chart will have a central angle that corresponds to the proportion of that category relative to the total data.
4. Fraction of the Total: The central angle for each sector can be calculated as a fraction of the total 360 degrees. If a category represents a certain fraction of the total data, the central angle can be calculated using the formula:
Central Angle=(Value of the CategoryTotal Value)×360∘
5. Conclusion: Since each sector's central angle is derived from the total angle of 360 degrees based on the proportion of the category, we can conclude that the central angle of the sectors in a pie chart is indeed a fraction of 360 degrees.
Final Statement:
Thus, the statement "the central angle of the sectors in a pie chart will be a fraction of 360 degrees" is true.
Central Angle=(Value of the CategoryTotal Value)×360∘
Thus, the statement "the central angle of the sectors in a pie chart will be a fraction of 360 degrees" is true.
Topper's Solved these Questions
- DATA HANDLINGBOOK - NCERT EXEMPLARCHAPTER - DATA HANDLINGEXERCISE - THINK AND DISCUSS
2 Videos
- DATA HANDLINGBOOK - NCERT EXEMPLARCHAPTER - DATA HANDLINGEXERCISE - EXERCISE (Choose the correct answer )
35 Videos
- COMPARING QUANTITIESBOOK - NCERT EXEMPLARCHAPTER - COMPARING QUANTITIESEXERCISE - Think and Discuss
2 Videos
- DIRECT AND INVERSE PROPORTIONS BOOK - NCERT EXEMPLARCHAPTER - DIRECT AND INVERSE PROPORTIONS EXERCISE - THINK AND DISCUSS
2 Videos
Similar Questions
Knowledge Check
The table shows the production of different types of cars (in thousands).
यह तालिका अलग-अलग प्रकार के कारों का उत्पादन ( हज़ार में) दर्शाती है |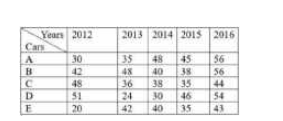 If the data related to the production of cars of type E is represented by a pie chart, then the central angle of the sector
representing the data of production of cars in 2013 will be:
यदि E प्रकार की कारों के उत्पादन से संबंधित आंकड़ों को एक पाई-चार्ट के द्वारा प्रदर्शित किया जाए, तो 2013 में कारों के उत्पादन के आंकड़ों को दर्शाने वाले खंड का केंद्रीय कोण होगा :A102∘B84∘C70∘D80∘The pie chart shows the value of the total annual production of dry fruits of a country. Study the diagram and answer the following questions.
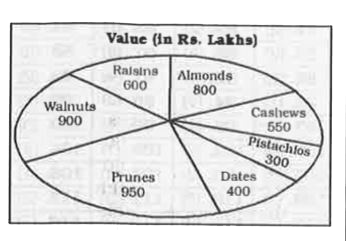
The measure of the central angle of the sector representing the annual production of dates is ______ degrees.A36B28C32D24The pie chart shows the value of the total annual production of dry fruits of a country. Study the diagram and answer the following questions.

The measure of the central angle of the sector representing the annual production of dates is ______ degrees.A36B28C32D24
Data collected in a survey shows that 40% of the buyers are interested in buying a particular brand of toothpaste. The central angle of the sector of the pie chart representing this information is
View SolutionWhat is the central angle of the sector in the pie chart representing hormones enzymes and other proteins.
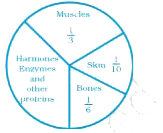
View SolutionDirections The following questions are based on the given pie-chart.Study the pie-chart and answer the questions.
 The central angle for the sector on "Paper-Cost" is (A) 2212 (B) 16∘ (C) 54.8∘ (D) 36∘
View SolutionThe table shows the production of different types of cars (in thousands).
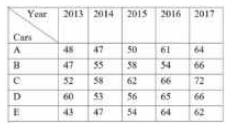
If the data related to the production of type D cars is represented by a pie chart, then the central angle of the sector representing the production of cars in 2016 will be:
View SolutionThe table shows the production of different types of cars (in thousands).

If the data related to the production of type D cars is represented by a pie chart, then the central angle of the sector representing the production of cars in 2016 will be:
View Solution

