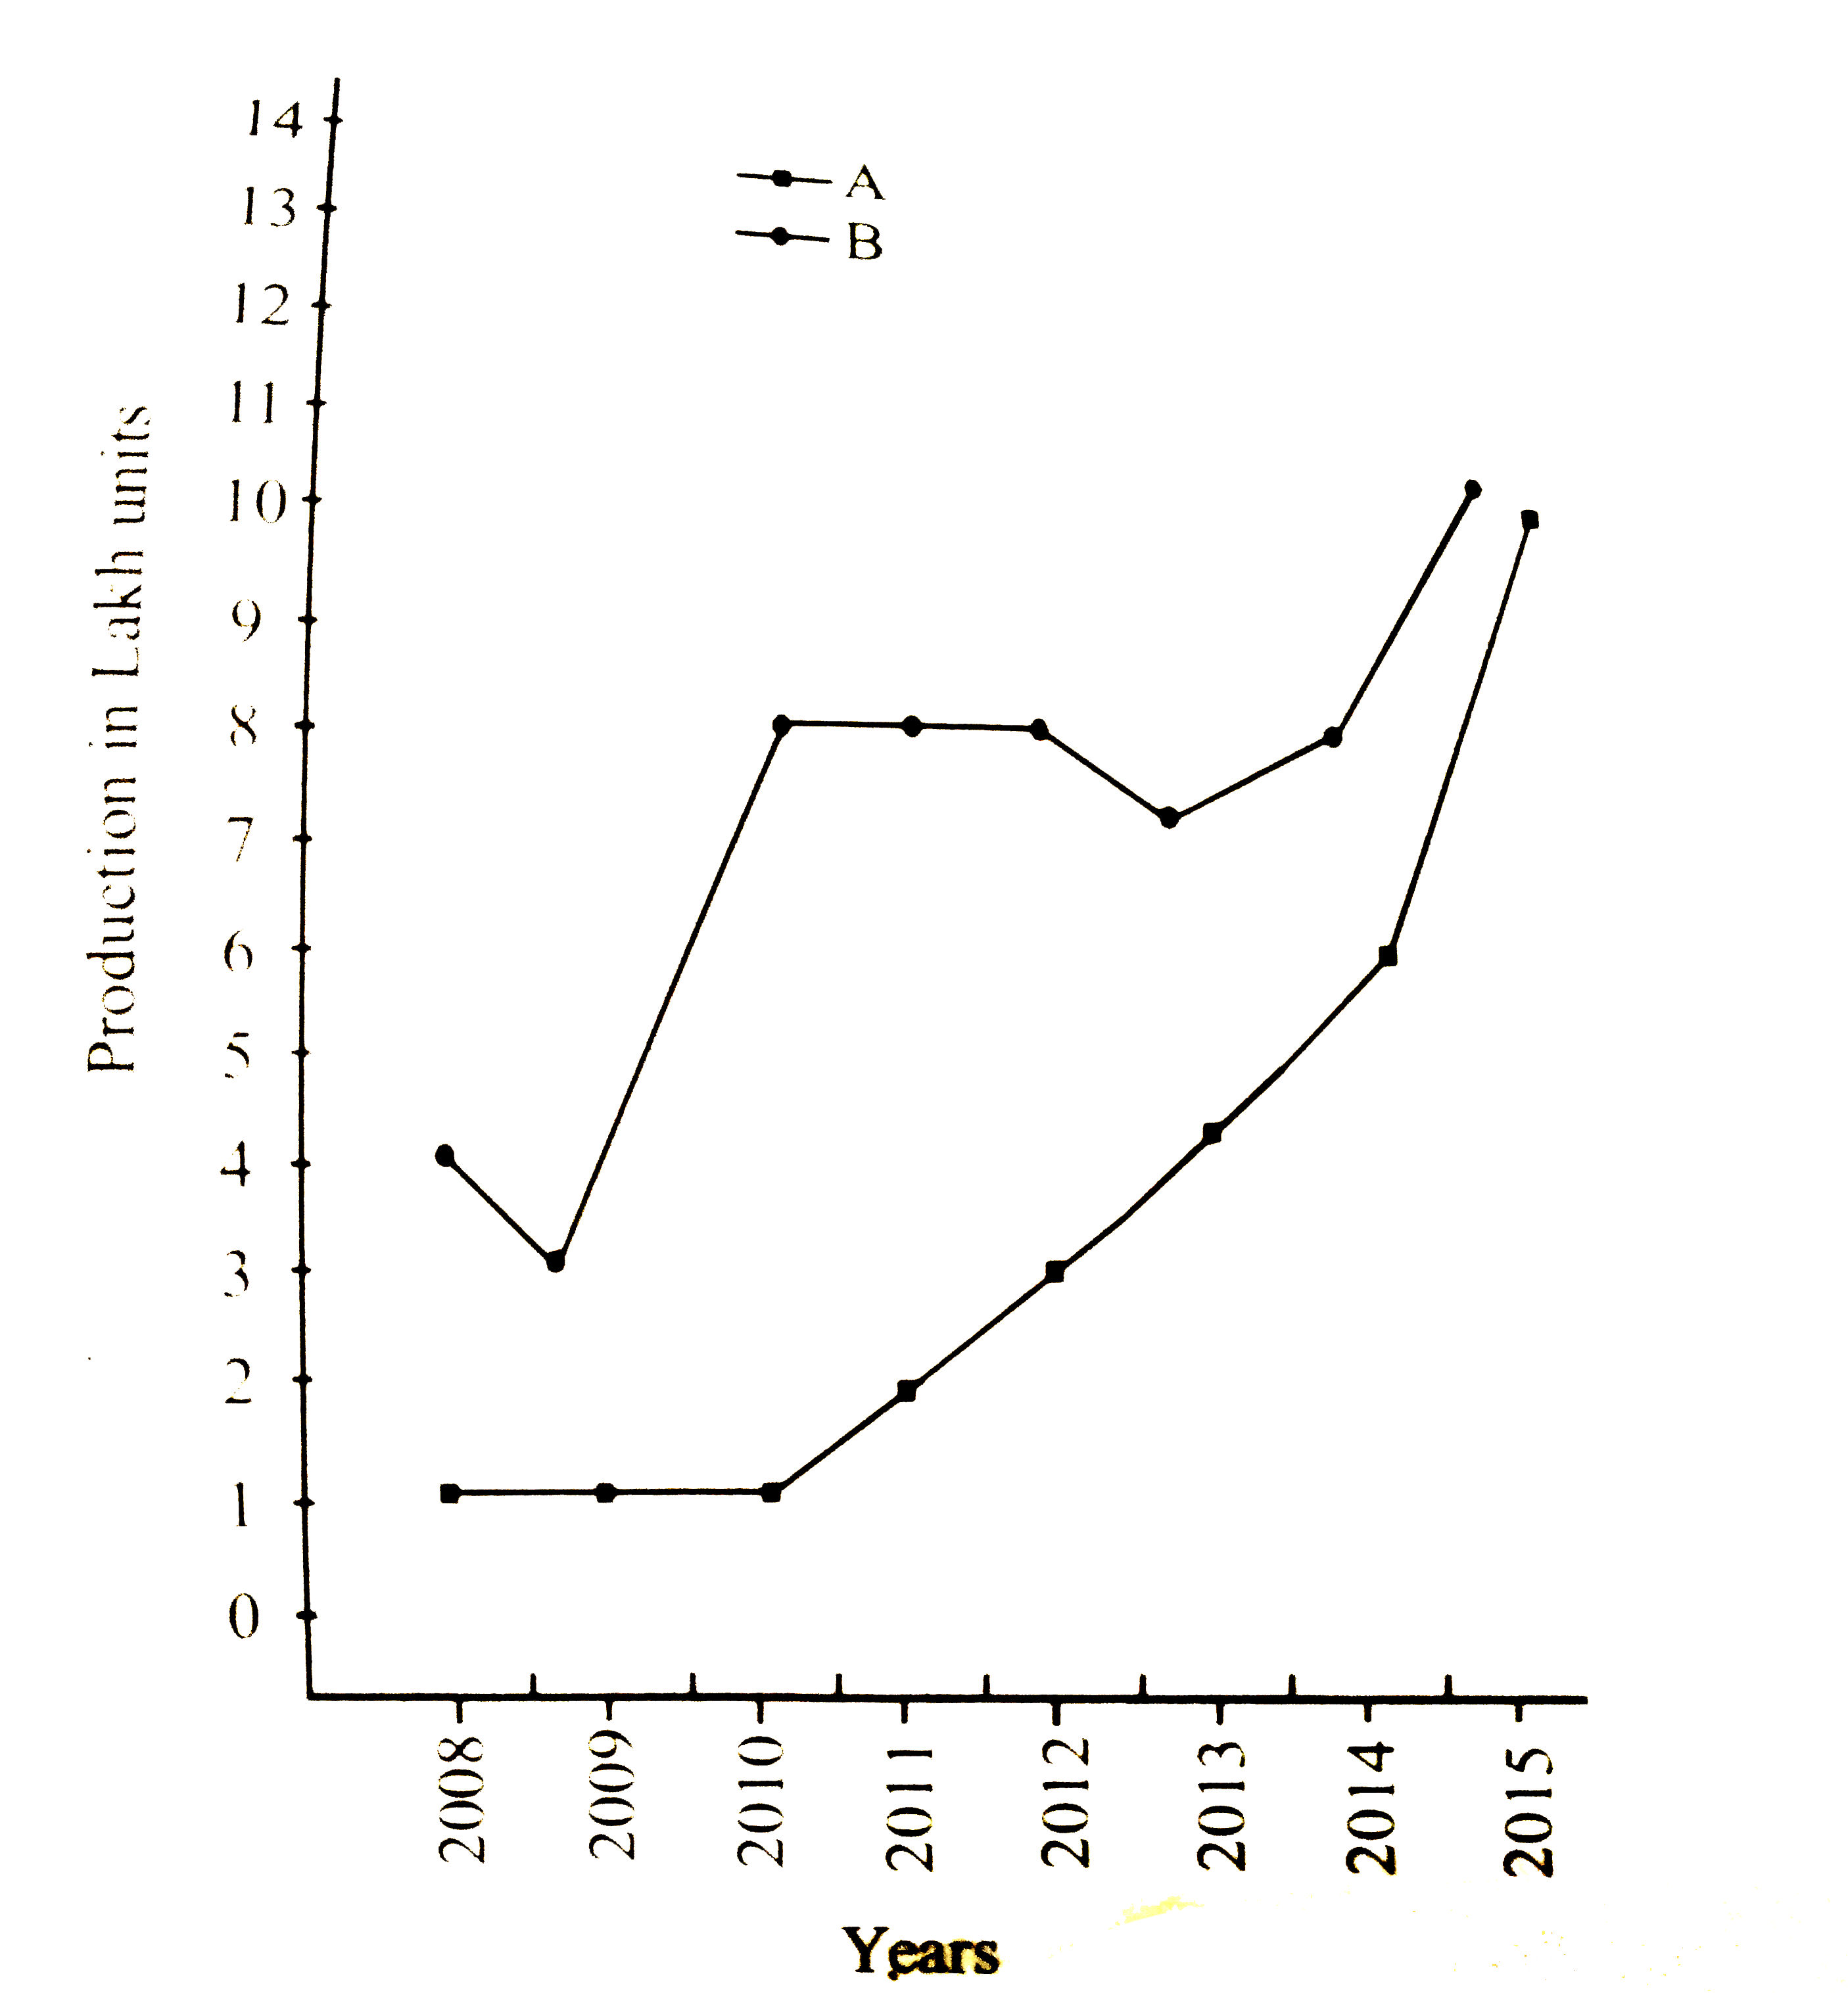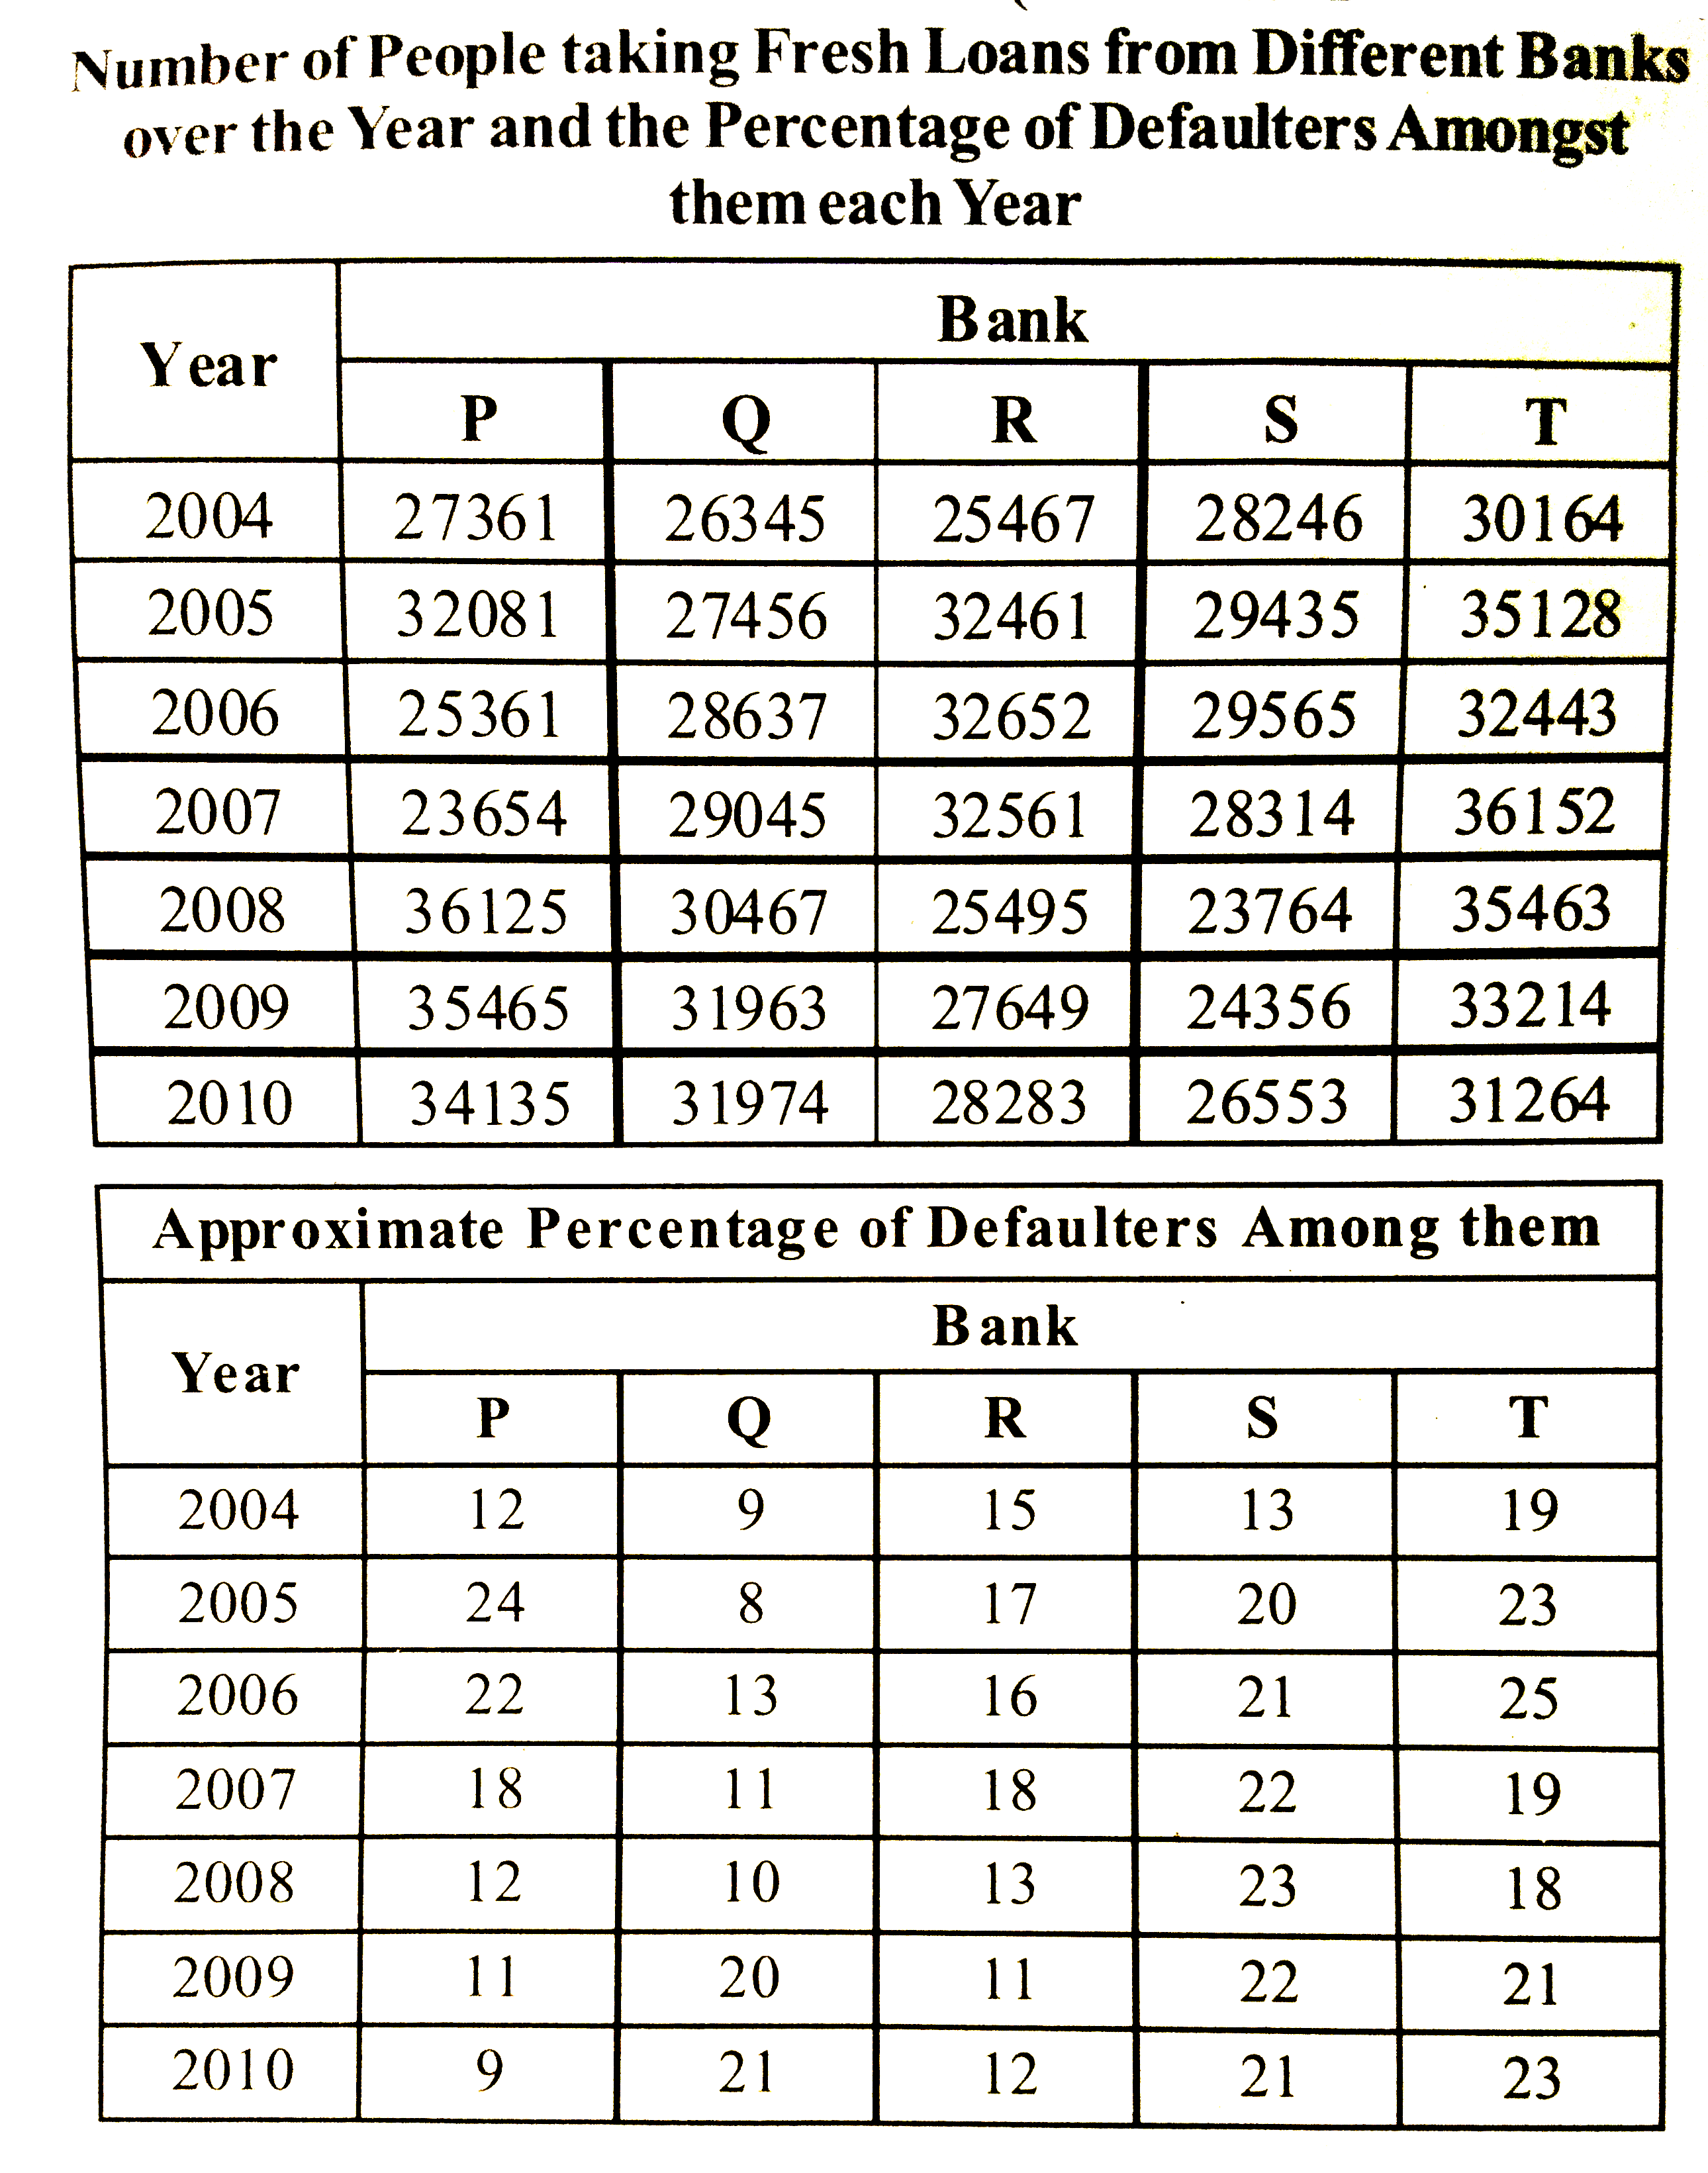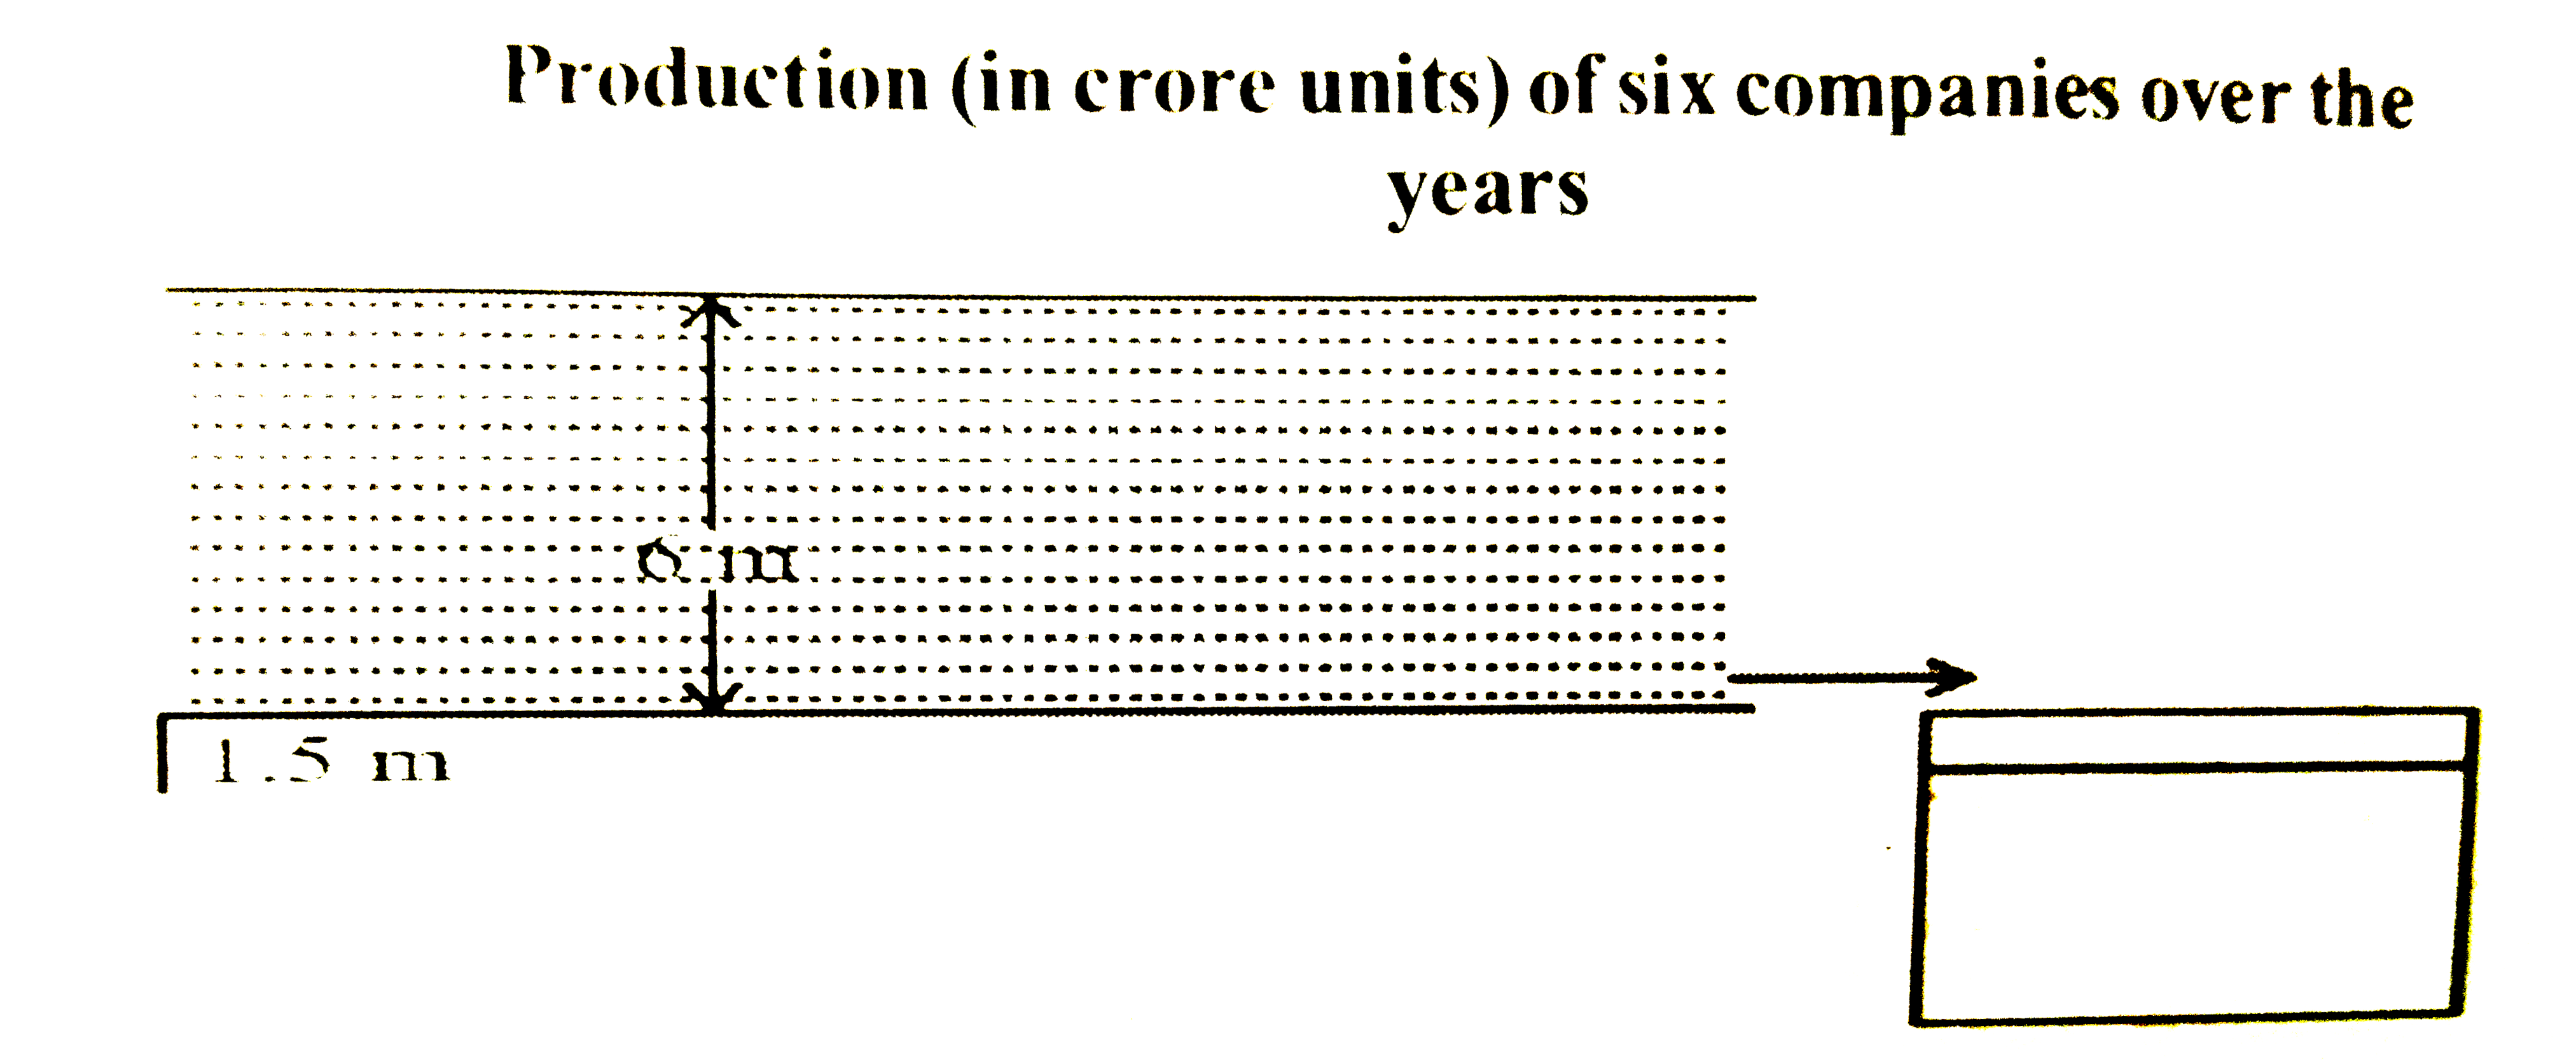
For SIO, which years was the per cent increase or decrease in production from the previous year the highest ?
2013
2010
2014
2012
The correct Answer is:C
Apprroximate per cent increase or decrease in production from the previous year for SIO are as follows:
2010=285×100=2.35%
2011=2×10087=2.29%
2012=2×10089=2.24%
2013=1×10091=1.09%
2014=4×10092=4.35%
Ouicker method : See the difference of produced units between two consecutive years. The difference is maximum for 2013 to 2014, and production during all these years is almost same. Hence, in the year 2014, SIO registered maximum increase in production over the previous year.
Topper's Solved these Questions
Similar Questions
Knowledge Check
Study the following table carefully to answer these questions.
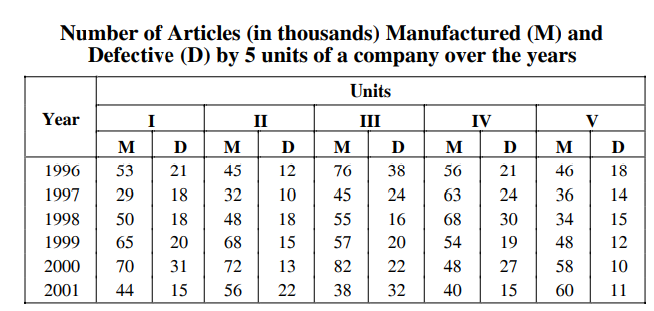
During which year was the percentage increase/decrease in manufacture from the previous year the highest for unit?A1198B2001C1999D1997Study the following table carefully to answer the questions that follows.
Number of Articles (in thousands) Manufactured (M) and Defective (D) company over the years-
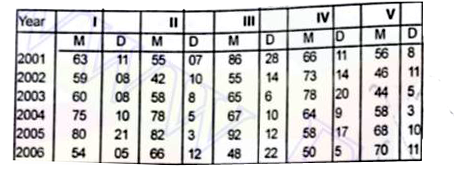
During which year was the percentage increase/decrease in manufacture from the previous year the highest for unit II ?A2001B2002C2003D2004Study the following graph to answer the given questions.
Per cent profit earned by two companies over the given years

For Company Y, which year is the percent of increase in percent profit over that of previous year the highest?A2002-03B1999-00C2001 – 02DCannot be determined
Study the table carefully to answer the questions that follow-
Which year is the percentage increase/decrease in number of units sold from the previous year the lowest for company L?
View SolutionStudy the following graph carefully and answer the questions given below –
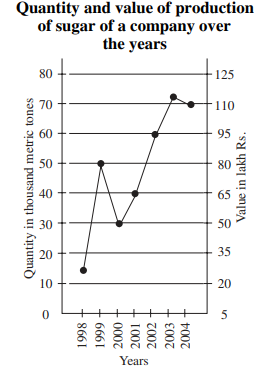
In which of the following years was the percentage increase in value of sugar per metric ton from the previous year the maximum?
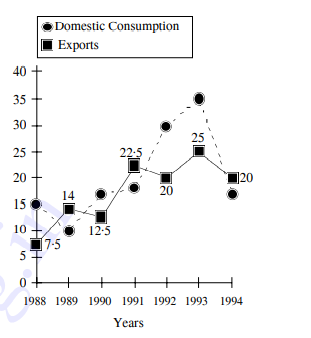
View SolutionStudy the following graph carefully to answer the questions given below it Import and Export of spare parts by an automobile company over the given years
During which year the percentage rise/fall in exports from the previous year is the highest?
View SolutionStudy the following graph carefully and answer the questions that
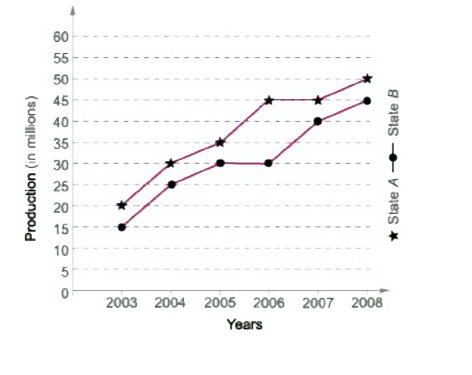
For state B , the percentage rise in population from the previous year was the highest in which of the following years ?
View SolutionRead the following graph carefully and answer the questions given below.
Production of sugar in three different factories over years (in thousand tonnes)
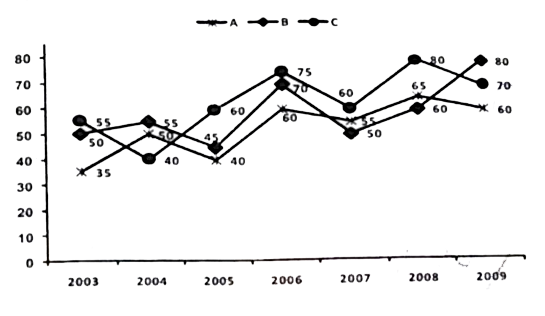
In which year was the percentage increase/decrease in production of company B maximum ?
View Solution

