Study the table carefully to answer the questions that follow-
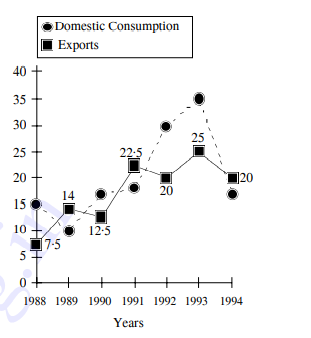
Which year is the percentage increase/decrease in number of units sold from the previous year the lowest for company L?
2000
2002
2001
1998
The correct Answer is:A
Step by step video, text & image solution for Study the table carefully to answer the questions that follow- Which year is the percentage increase/decrease in number of units sold from the previous year the lowest for company L? by Maths experts to help you in doubts & scoring excellent marks in Class 14 exams.
Updated on:21/07/2023Topper's Solved these Questions
Similar Questions
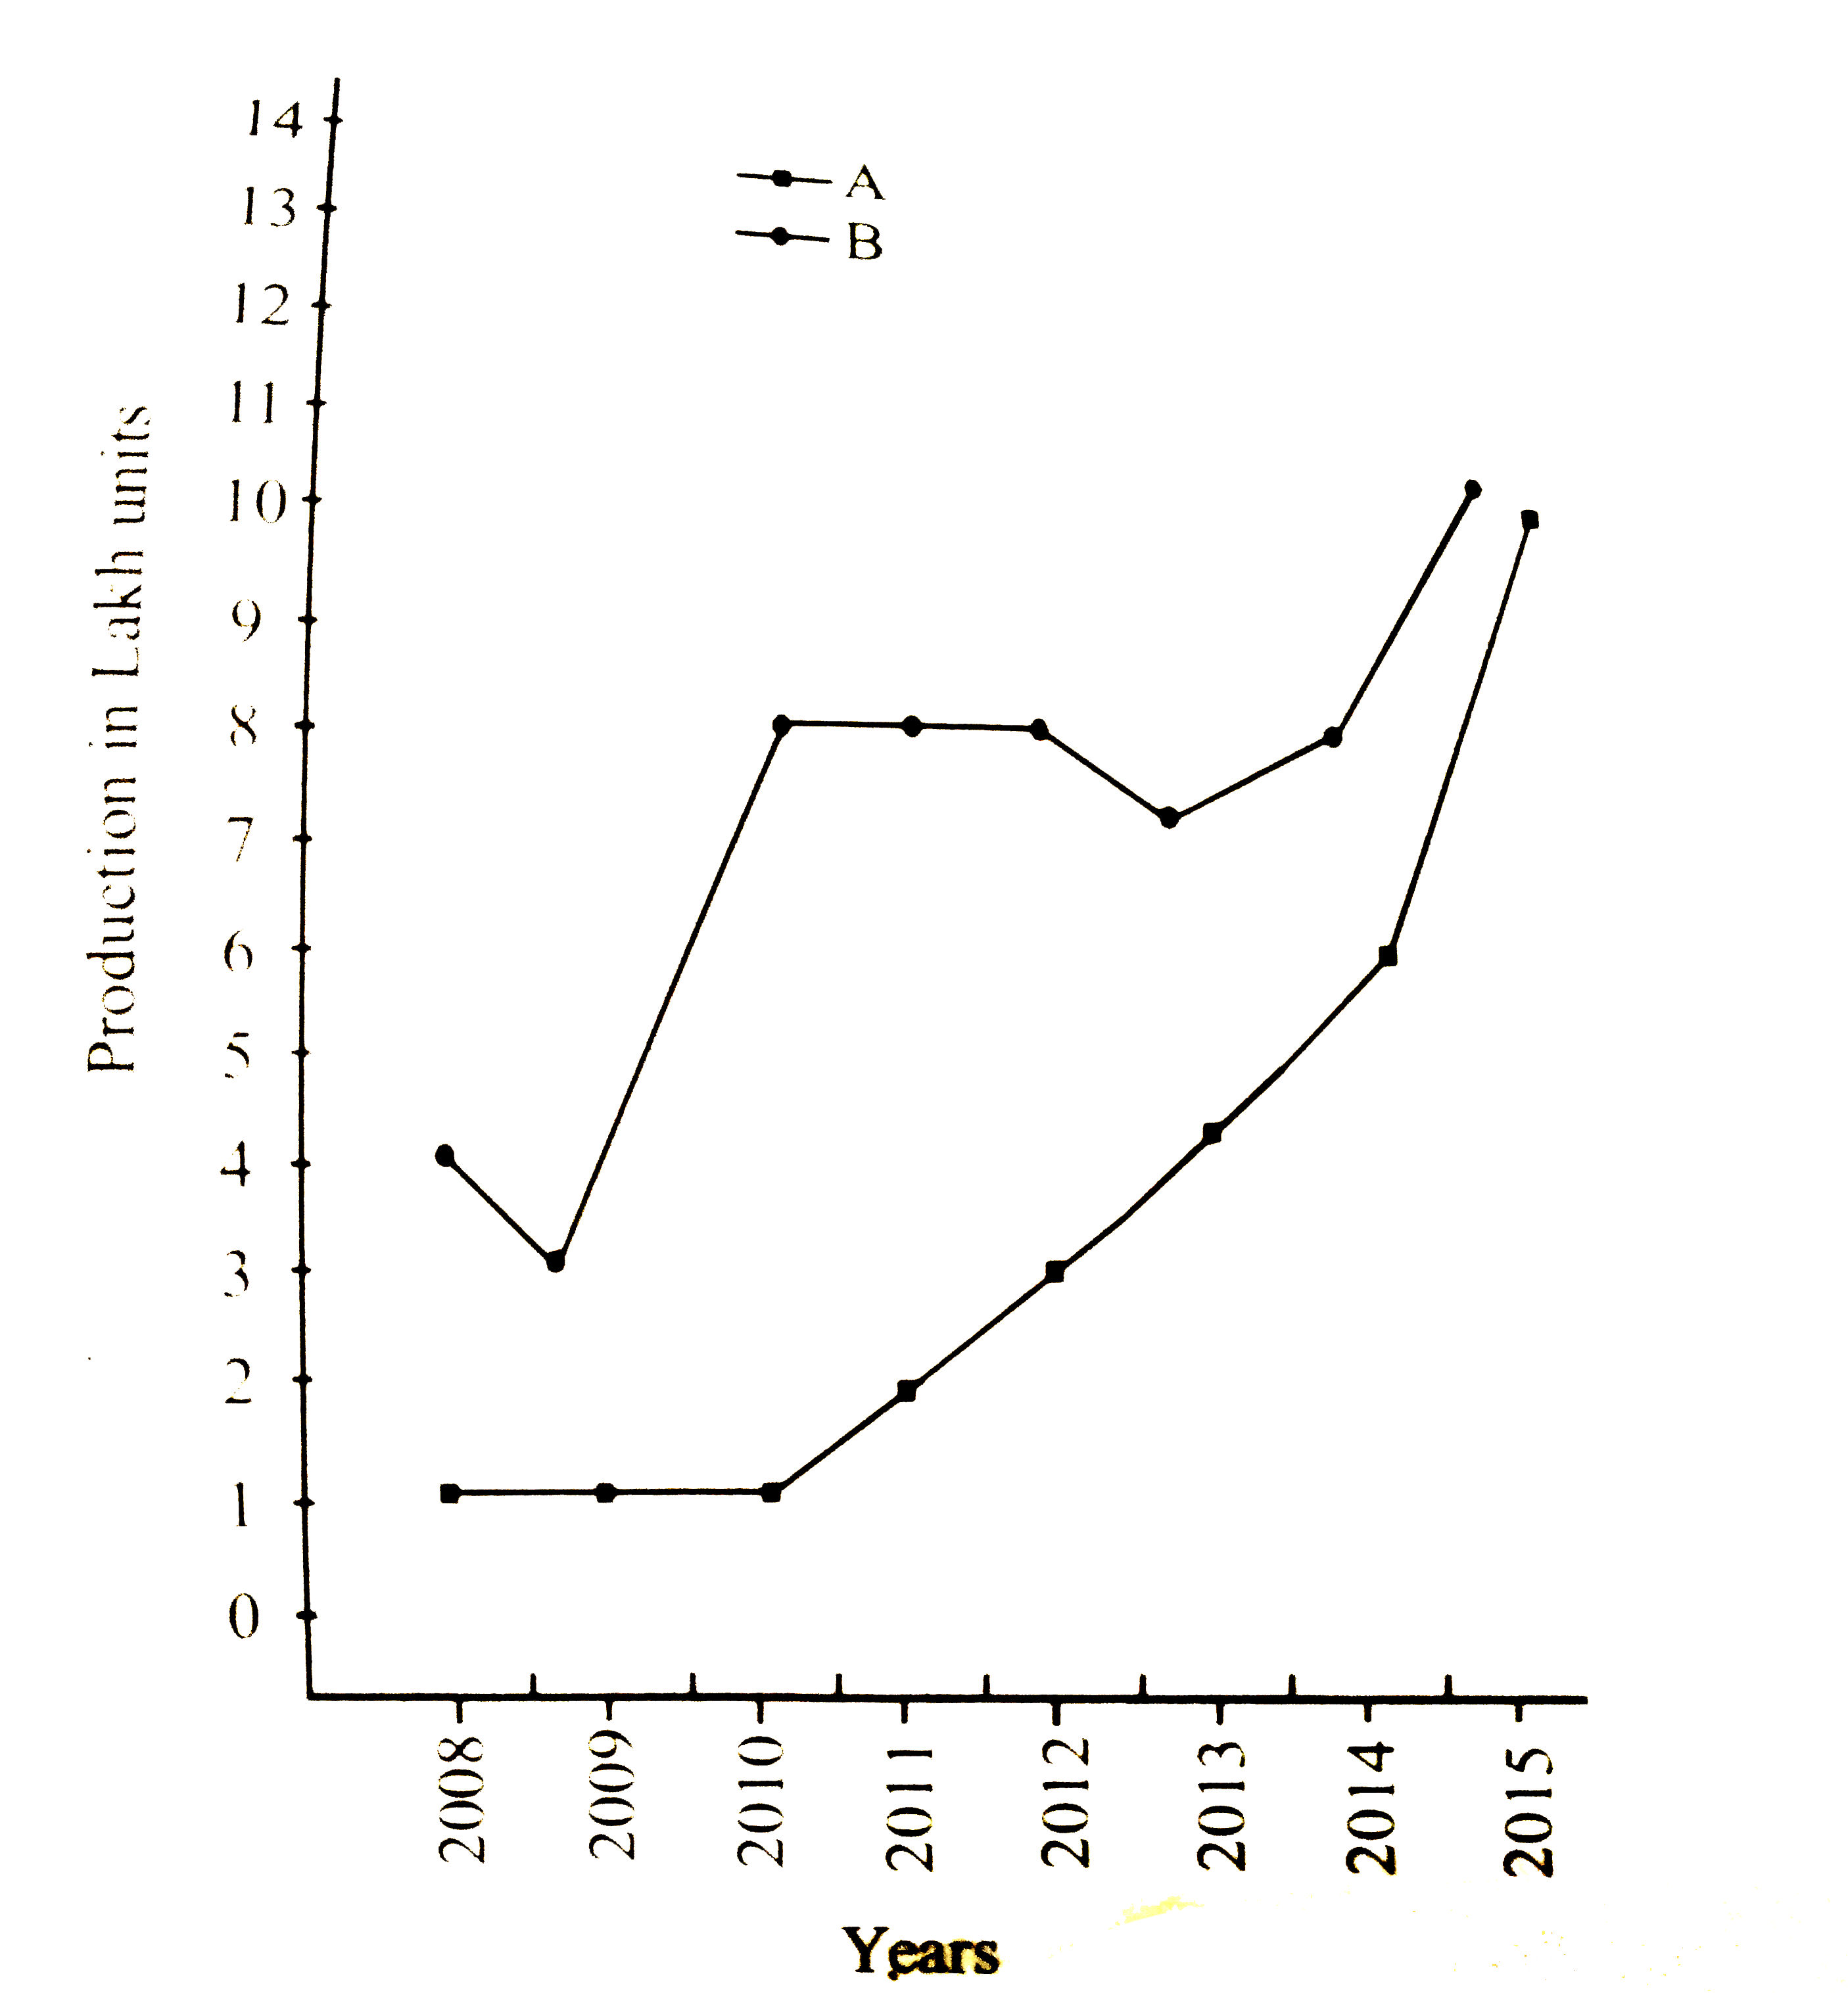
For Company A, in which year is the percentage increases/decrease in the production from the previous year the highest ?
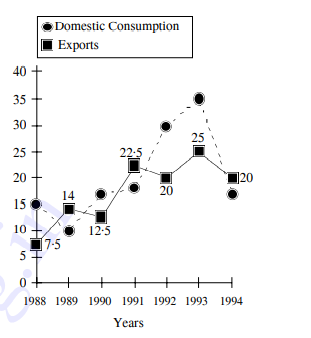
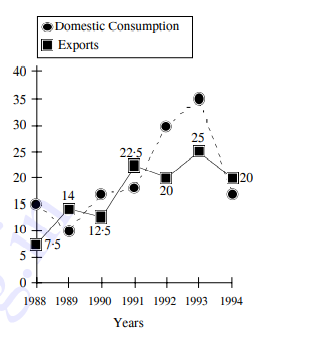
View SolutionStudy the following graph carefully and answer the given questions.
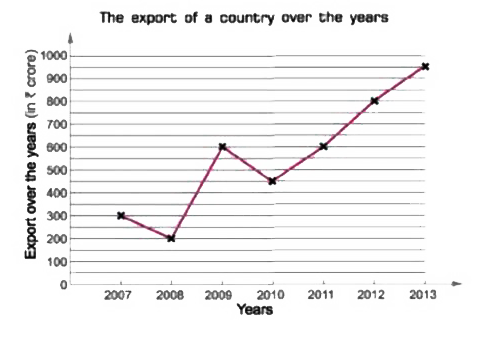
Which year has the highest per cent increase/decrease in exports as compared to the preceding year ?
View Solution
Knowledge Check
Study the following table carefully to answer these questions.
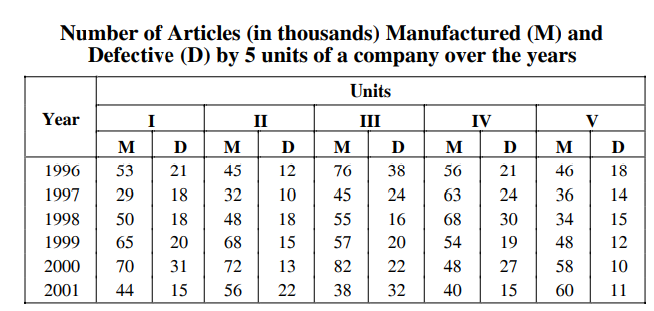
During which year was the percentage increase/decrease in manufacture from the previous year the highest for unit?A1198B2001C1999D1997Study the table carefully to answer the questions that follow-
What is the approximate average number of units sold in the year 1999?A407300000B4040000C42740000D4073000000Study the table carefully to answer the questions that follow-
Which company has sold the maximum number of units over the years?AQBMCNDNone of these
Study the following bar graph and answer the question that follows.
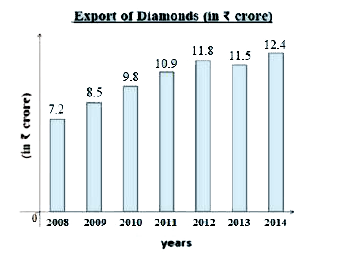
In which year was the maximum percentage increase in diamond exports compared to the previous year?
View SolutionStudy the following graph carefully and answer the questions that follow
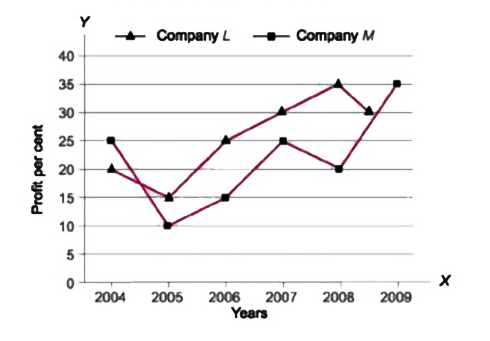
What was the percentage increase in percent rise in profit of company M in the year 2009 from the previous year ?
View SolutionStudy the table carefully to answer the following questions ----
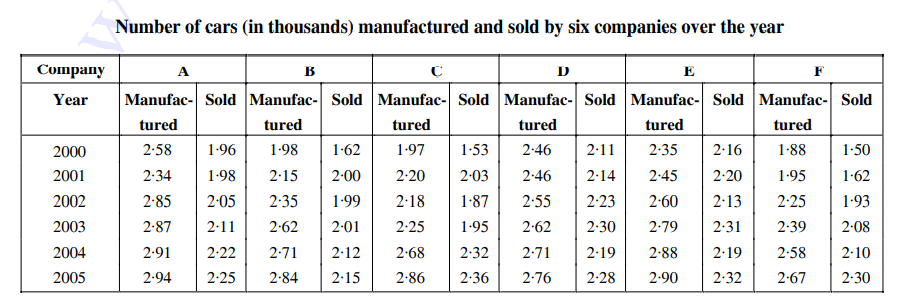
What is the approximate percent increase in the number of cars sold by company F in the year 2004 from the previous year ?
View SolutionStudy the following graph carefully and answer the questions given below –
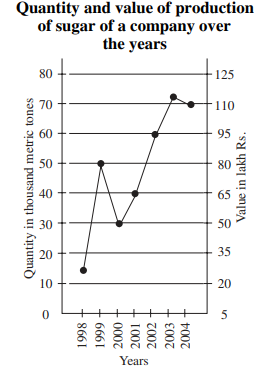
In which of the following years was the percentage increase in value of sugar per metric ton from the previous year the maximum?
View SolutionStudy the following table carefully to answer the questions that follows.
Number of Articles (in thousands) Manufactured (M) and Defective (D) company over the years-
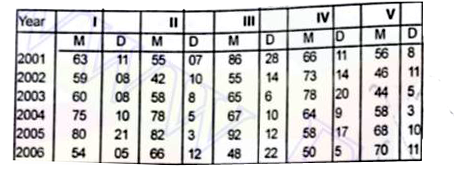
During which year was the percentage increase/decrease in manufacture from the previous year the highest for unit II ?
View Solution
