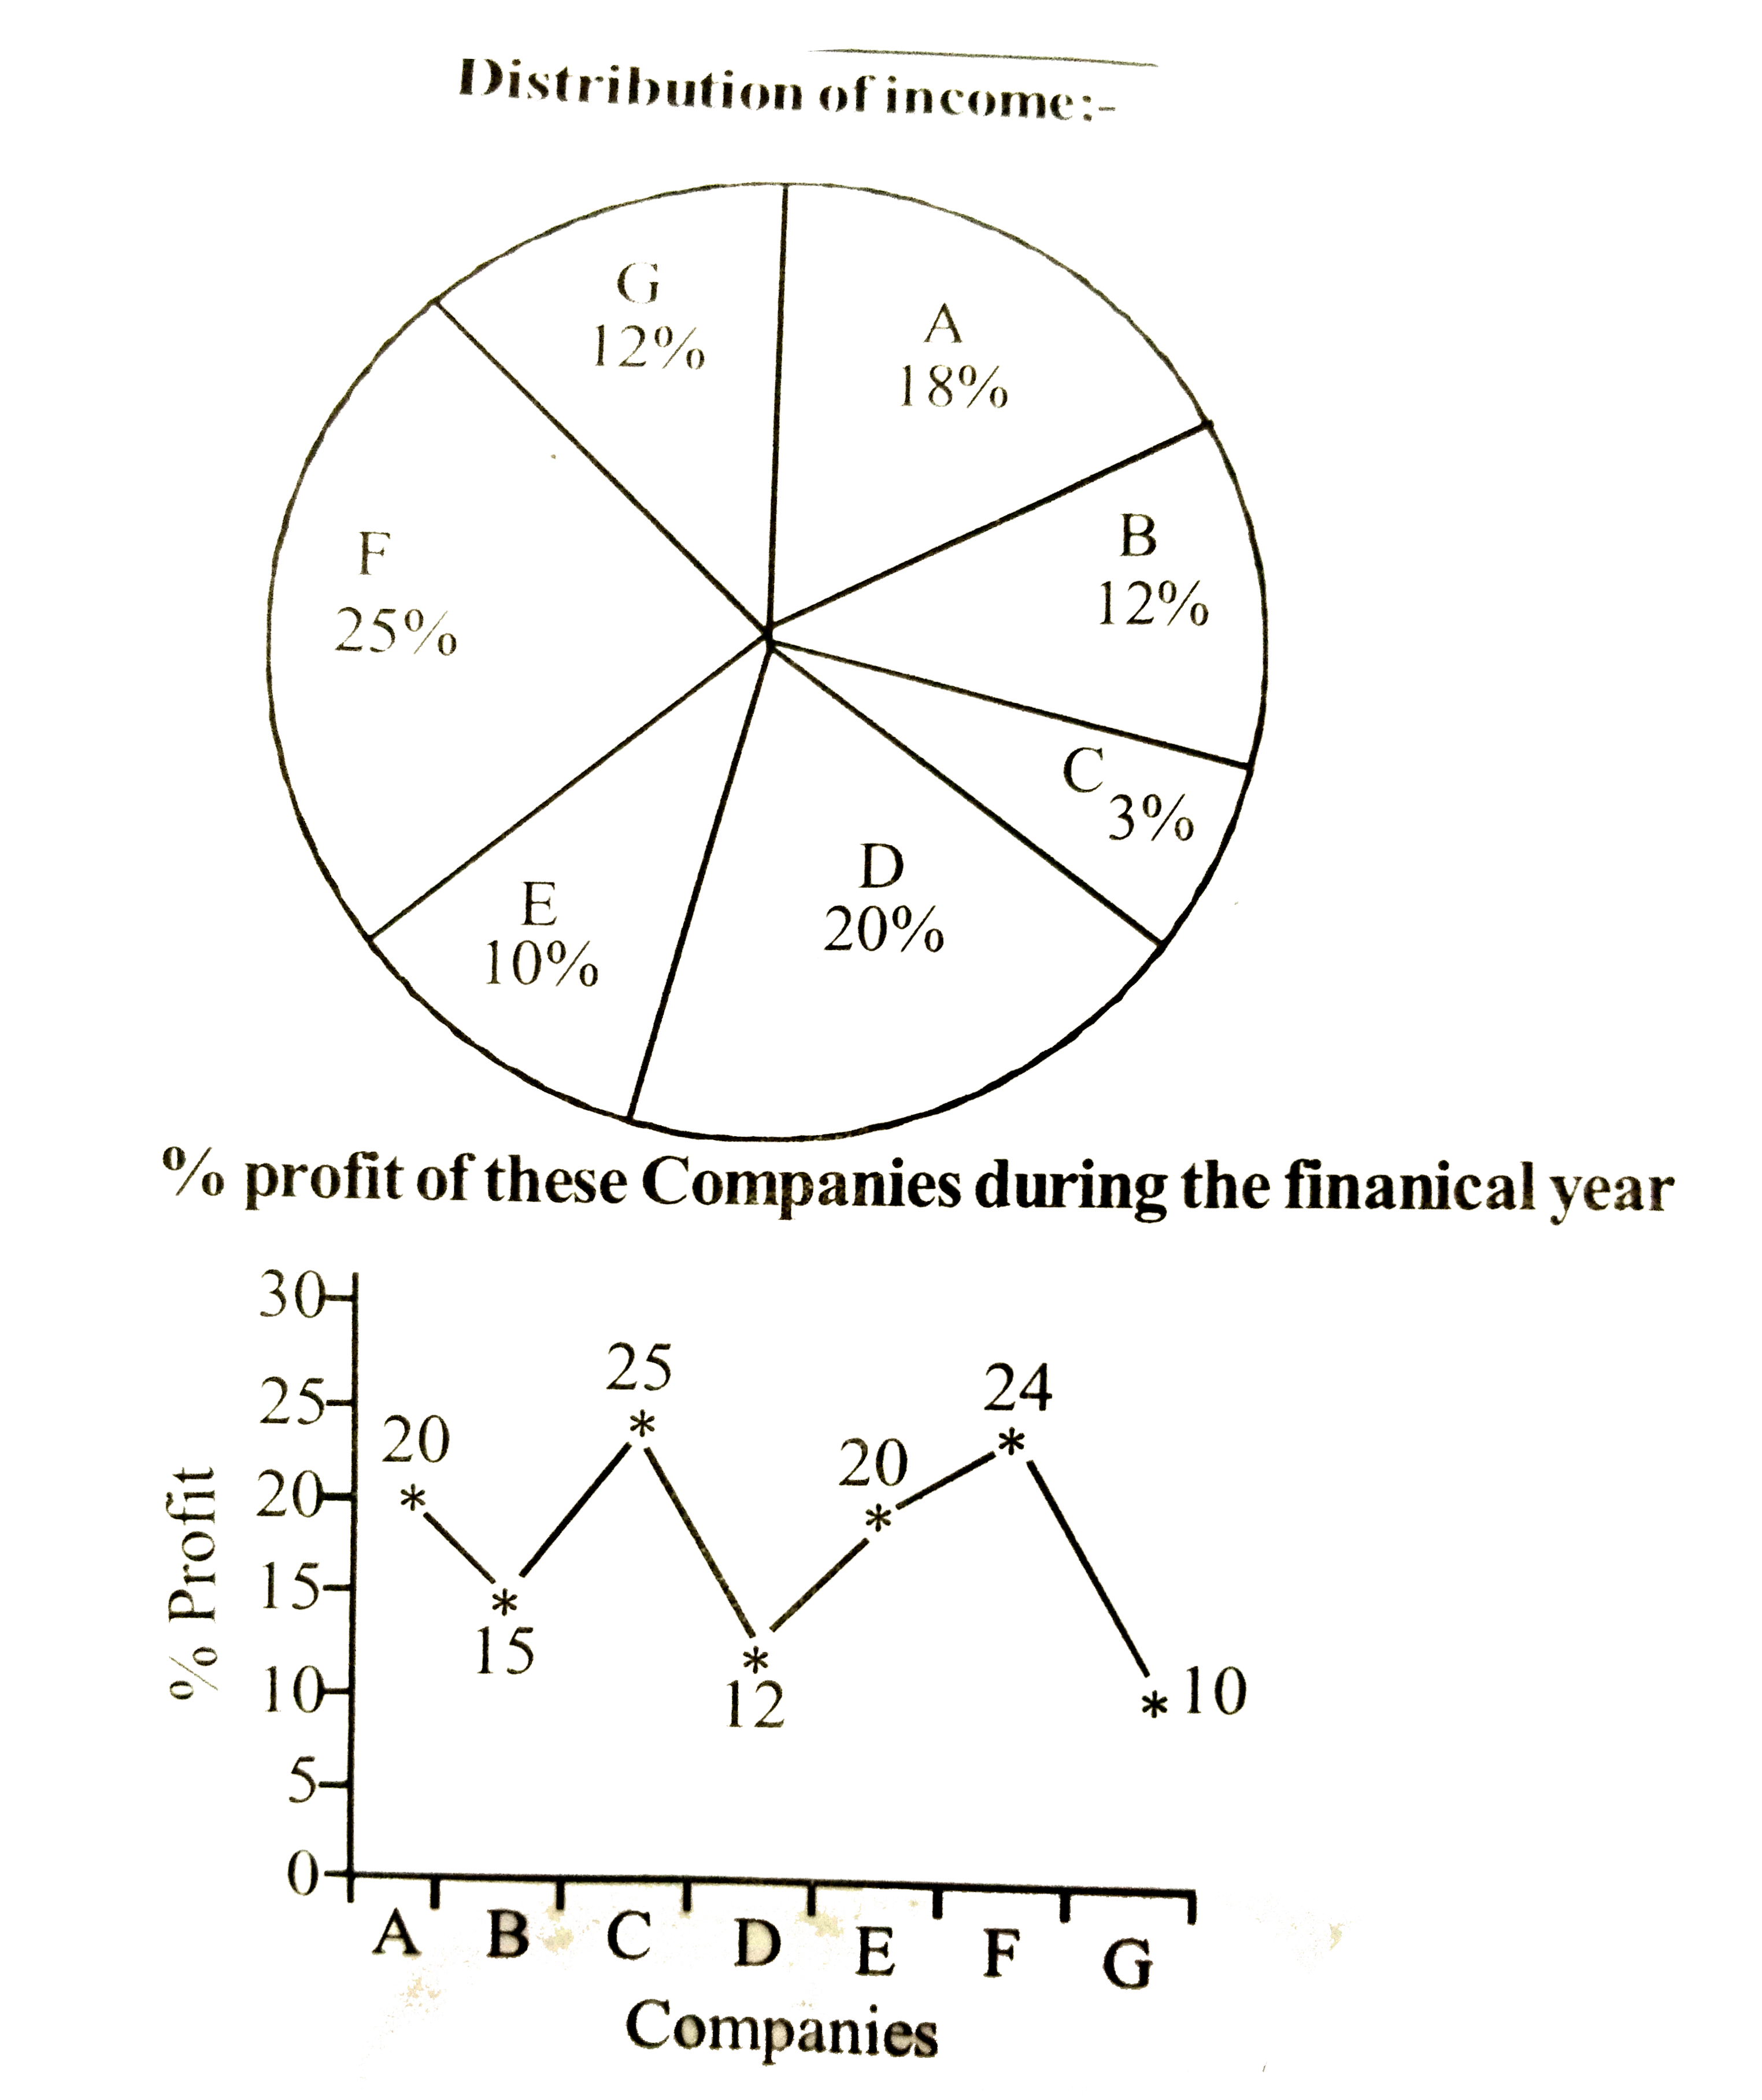
What was the ratio of the expenditure of company 'A' to that of company 'C' ?
Cannot be determined
The correct Answer is:C
Ratio of income (A's C''s)
Ratio of their exp.
Topper's Solved these Questions
Similar Questions
The following line graph gives the percent profit earned by two companies X and Y during the period Percentage profit earned by two companies X and Y =Income-ExpenditureExpenditure×100
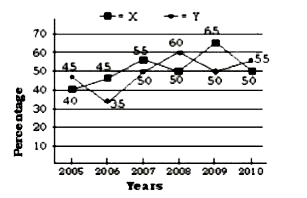
If the incomes of two companies were equal in 2008, then what was the ratio of expenditure of company X to that of company Y in 2008?
View SolutionStudy the following graph carefully to answer the questions given below. Expenditure in lakhs) of three different Companies in Five Different Years
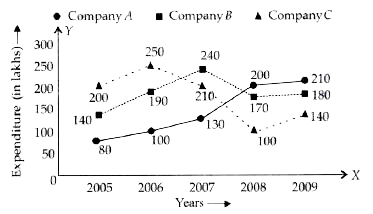
What was the ratio of the expenditure of Company A in the year 2009 to the expenditure of Company B in the year 2005?
View Solution
Knowledge Check
Study the following graph carefully to answer the question that follow
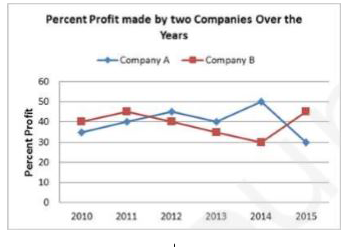
In the year 2014 the income of both the companies A and B was the same what was the respective ratio of expenditure of company A to the expenditure of company B in that year?AA)15:13BB)25:21CC)21:25DD)13:15the given bar graph presents income and Expenditure of a company for the five years, 2014 to 2018
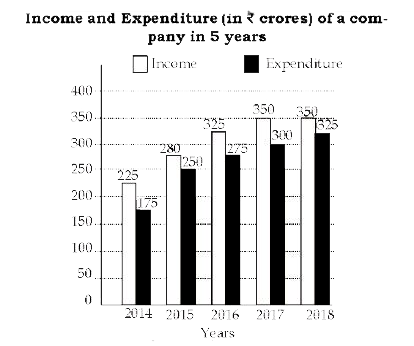
What is the ratio of total expenditure to total income of the company in 2014,2016 and 2017?A13:18B3:4C15:16D5:6Study the following graph carefully and answer the given questions :-
The following graph shows the % profit of two companies over the years :-
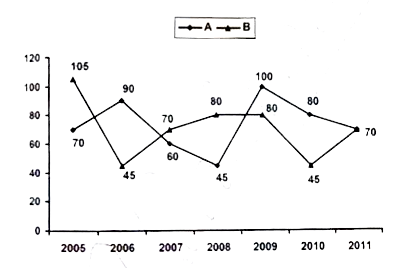
If income of company A in the year 2006 and 2009 are same then what is the respective ratio of expenditure of company A in both the same years ?A11:20B19:20C20:19D20:11
Per cent Profit =Income-ExpenditureExpenditure×100
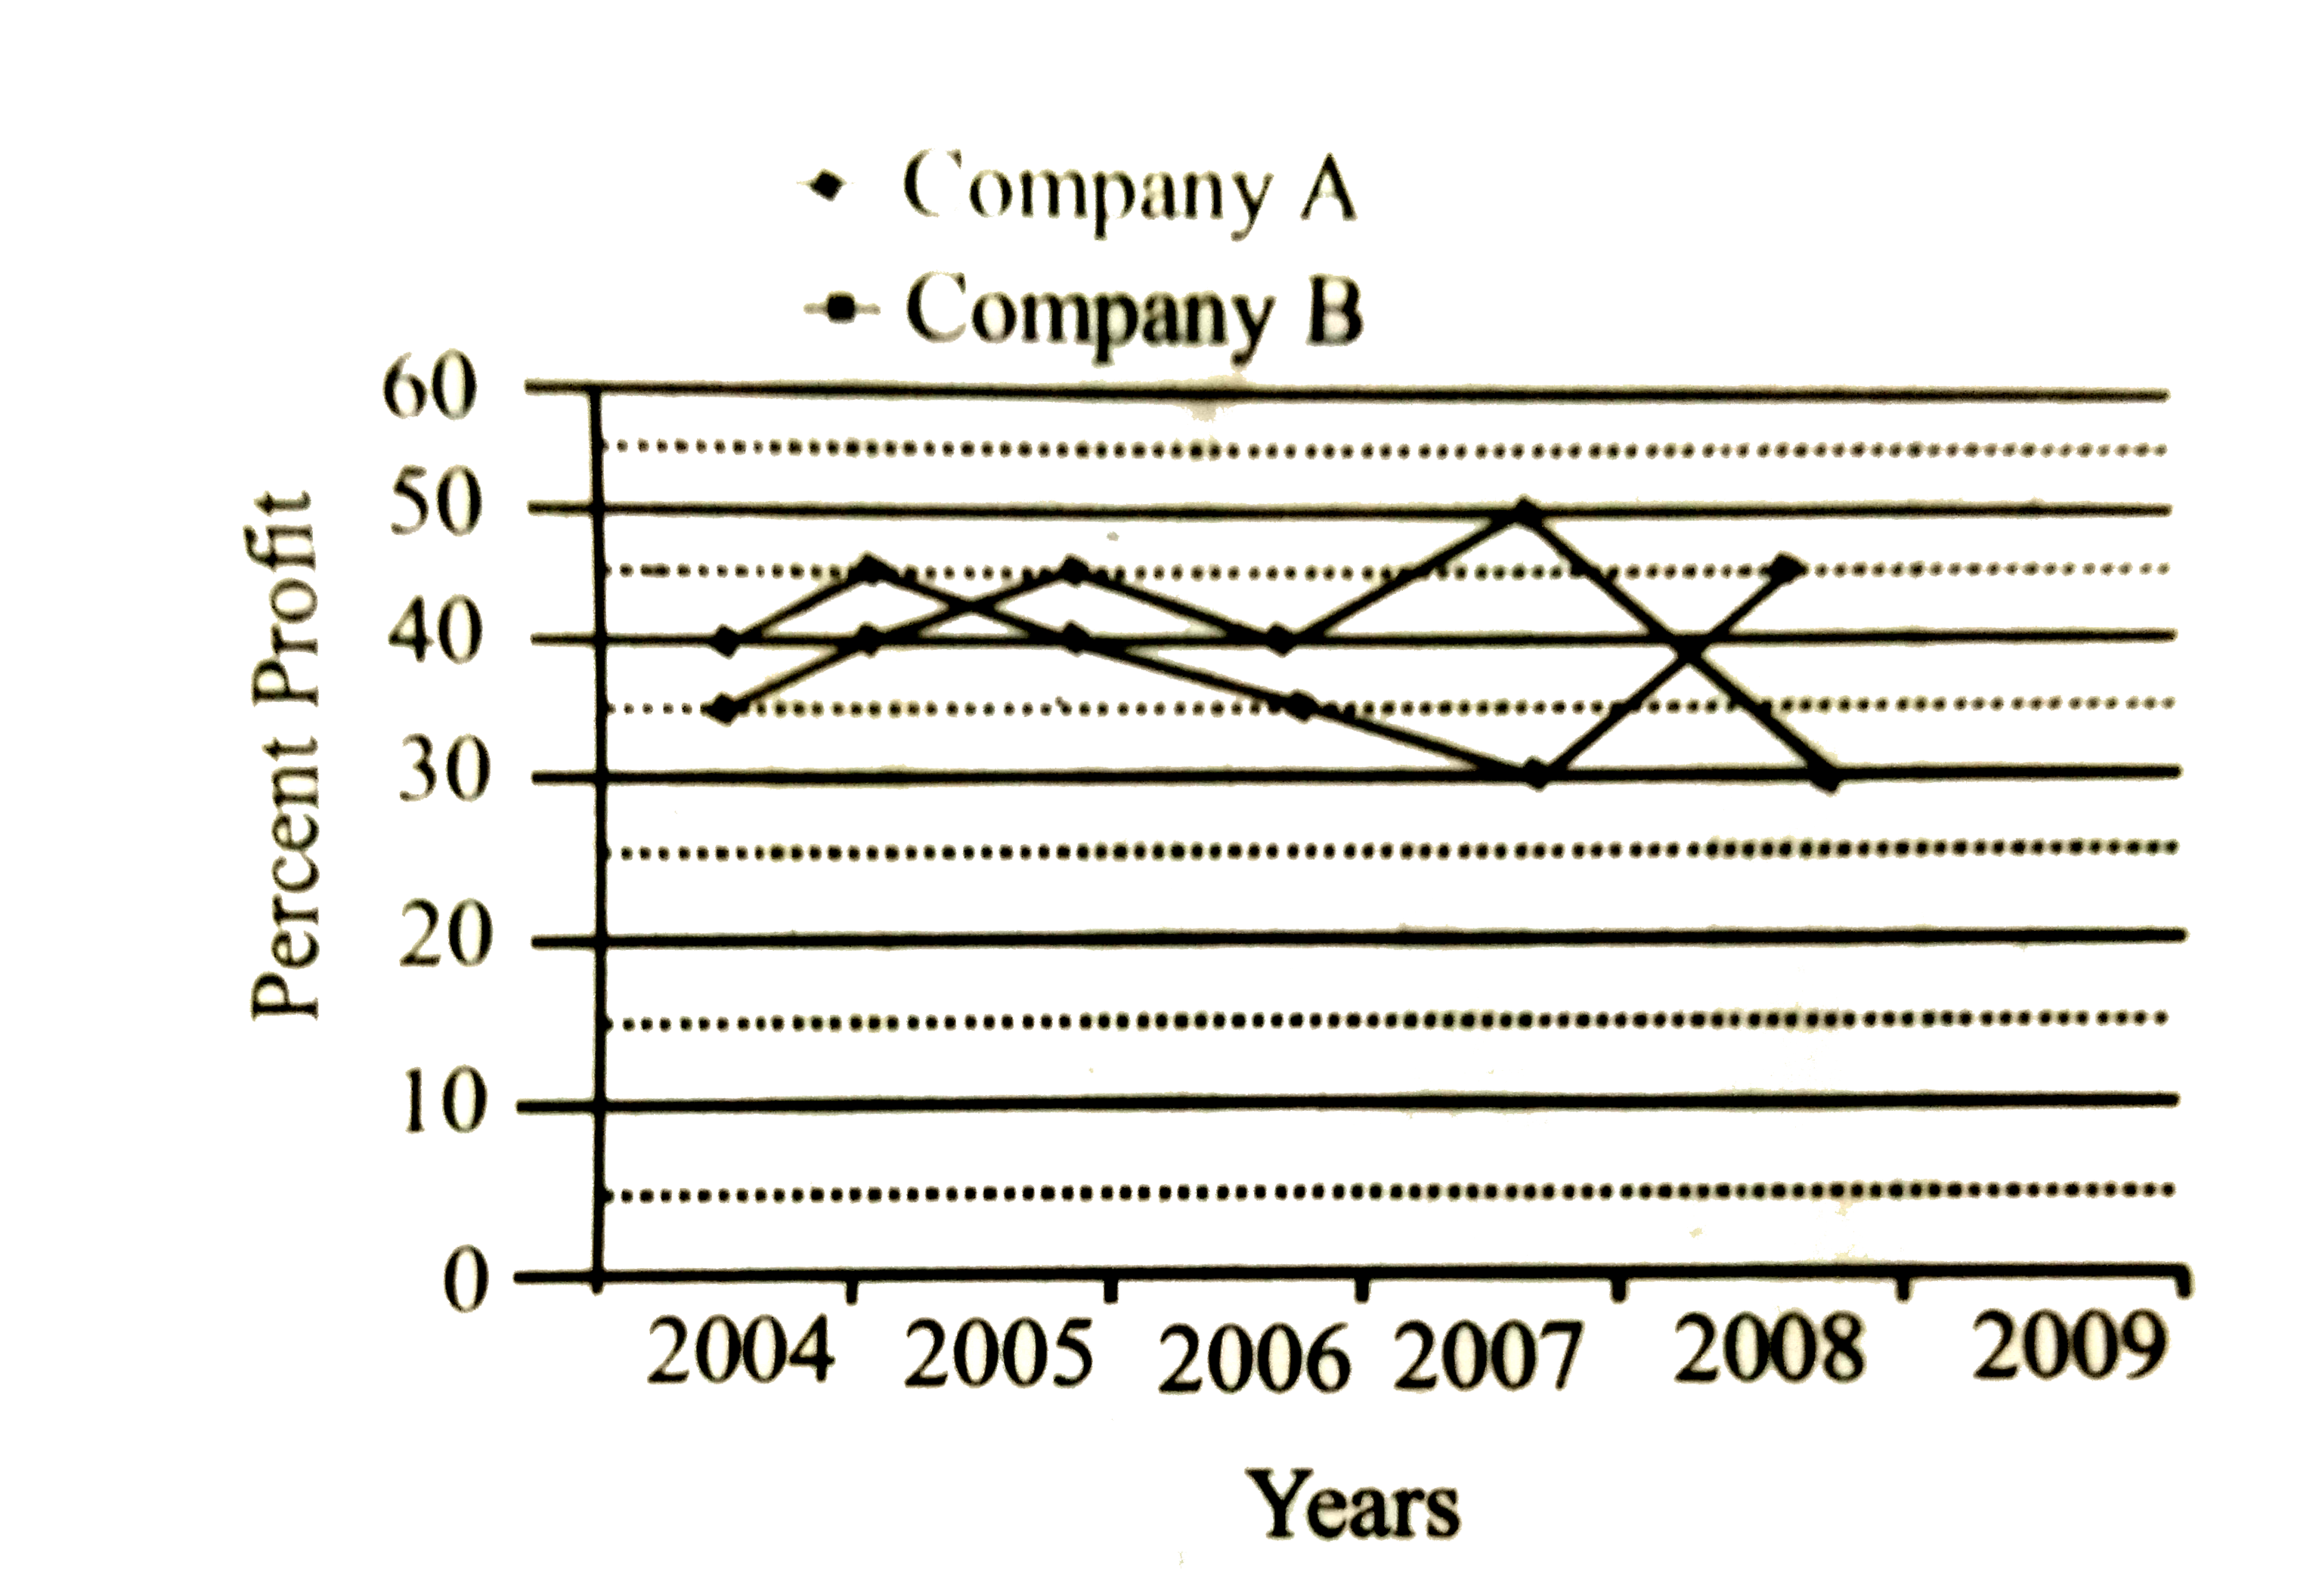
If in the year 2008, the income of both the companies A and B was the same, what was the respective ratio of expenditure of company A to te expenditure of comapny B in that year ?
View Solution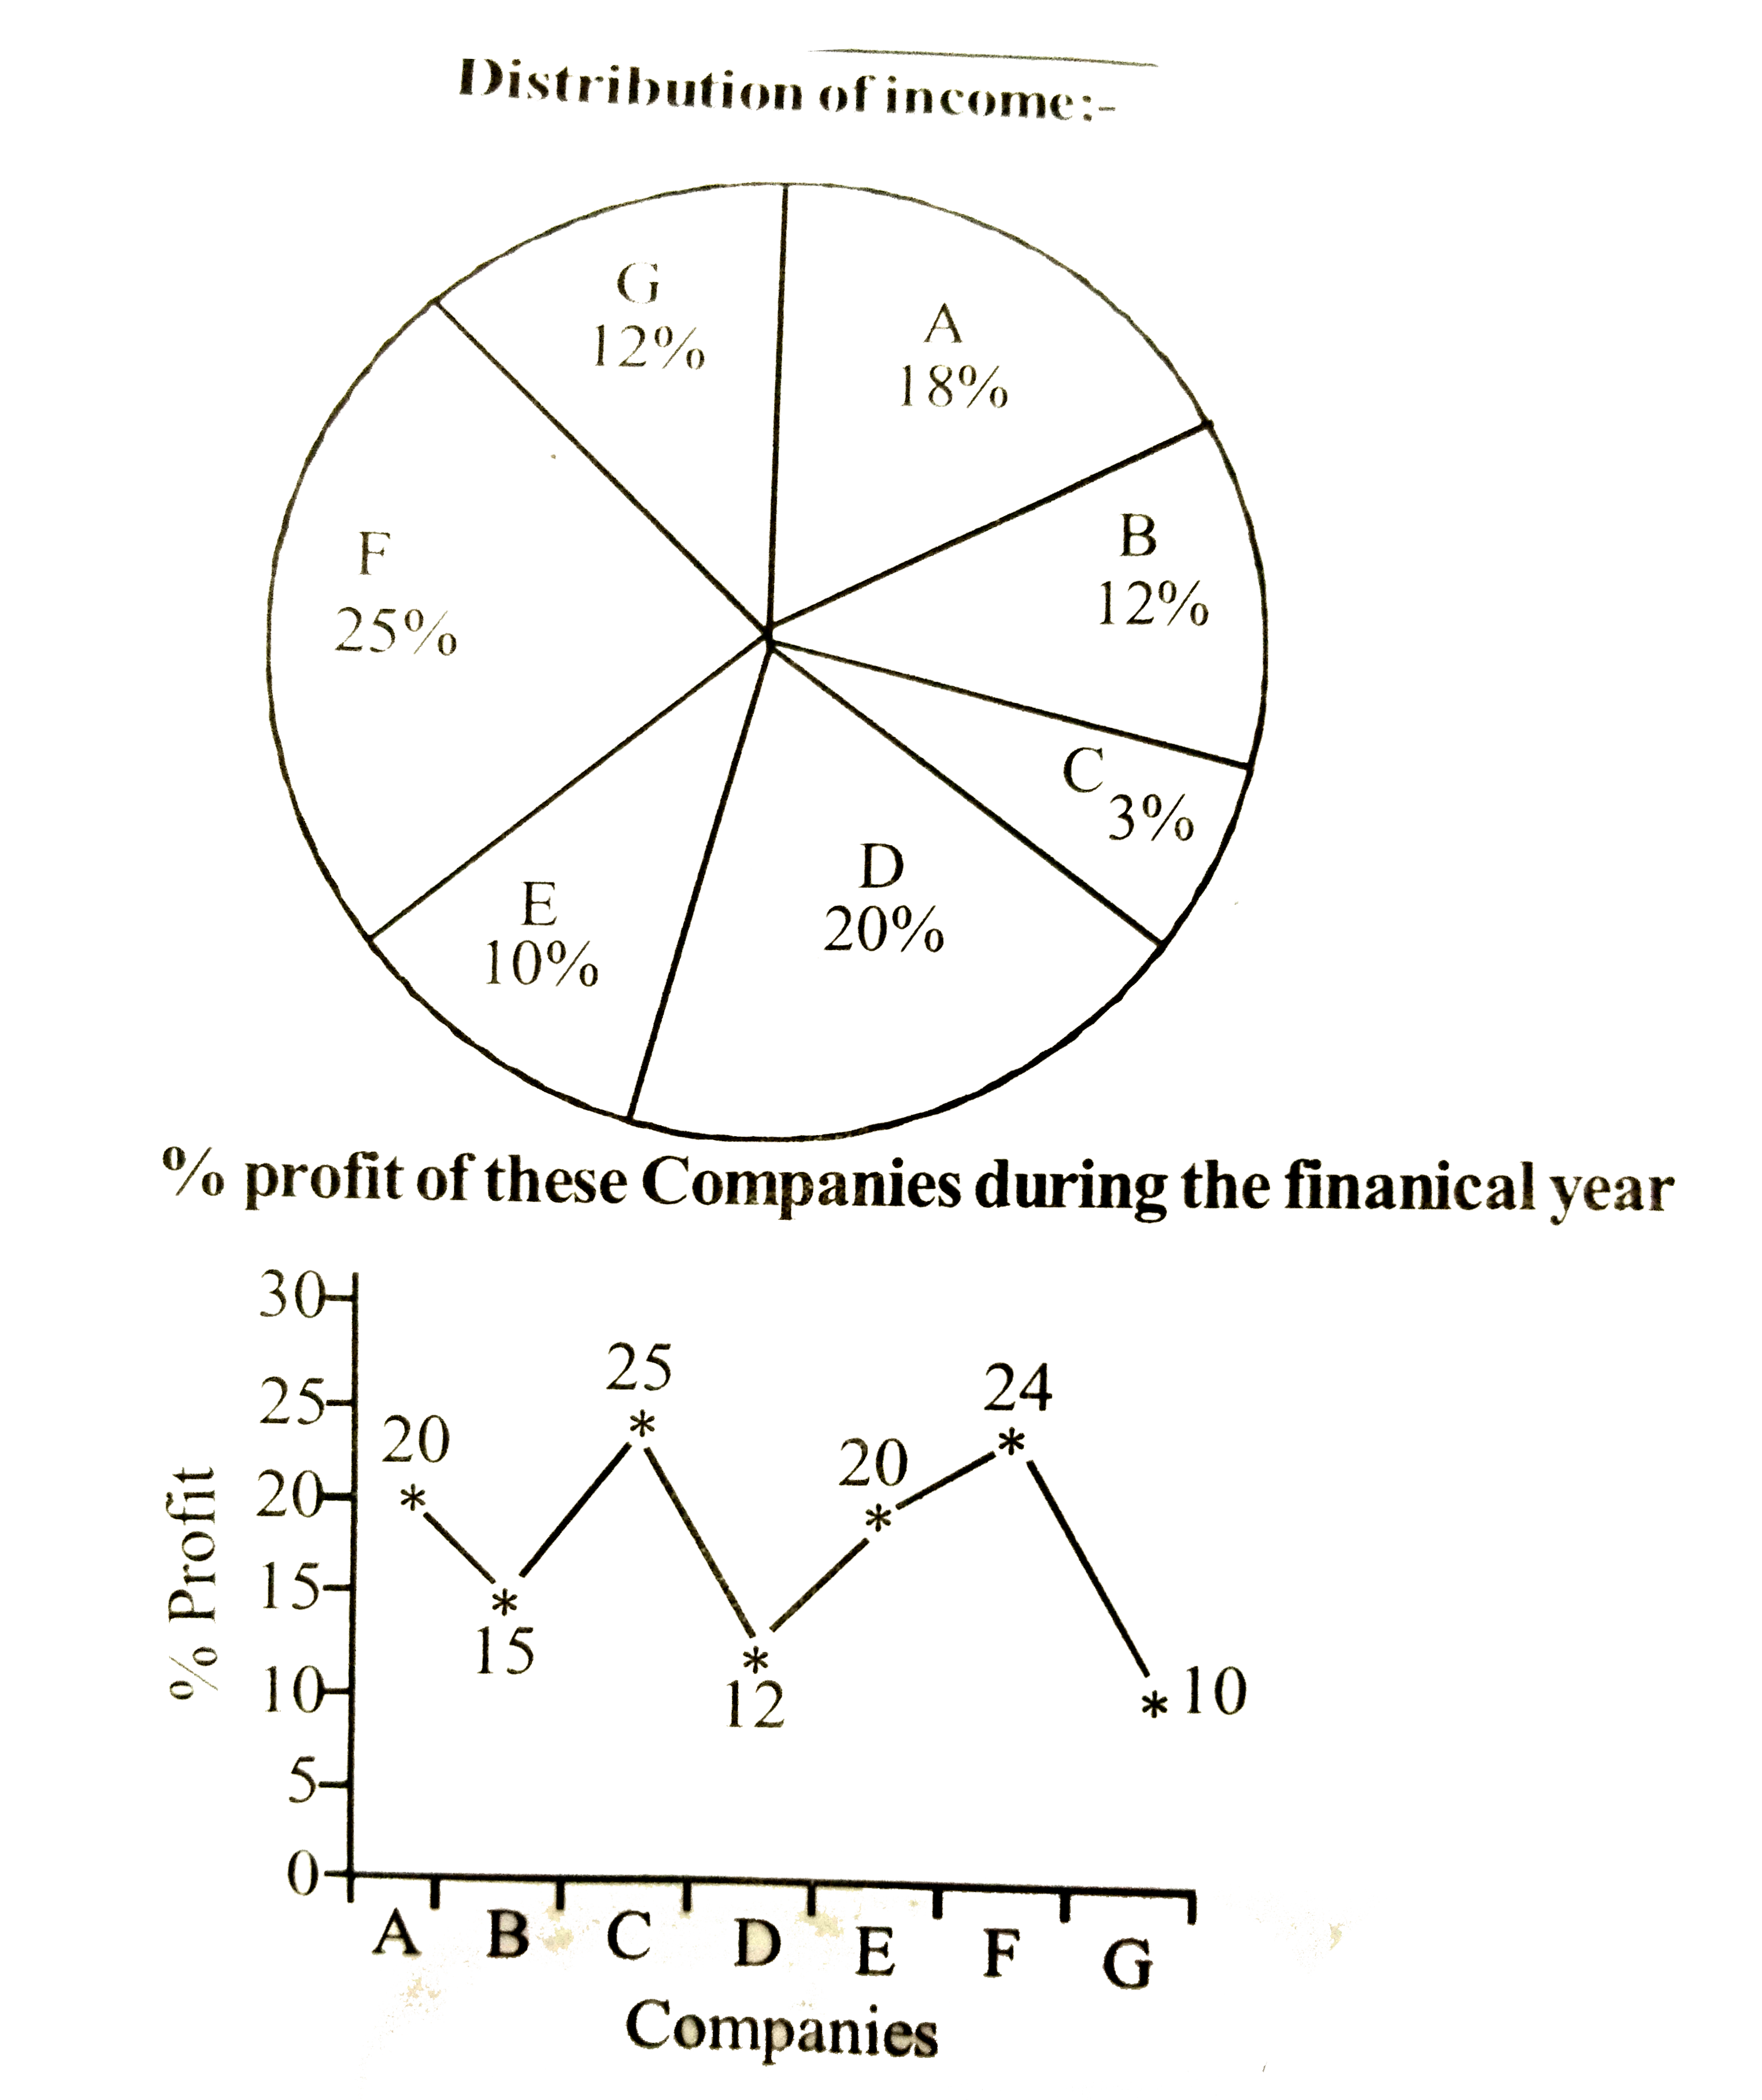
If in the given financial year income of company 'D' was Rs. 535 cr, what was the approximate expenditure of company 'B' in that year ?
View SolutionThe given Bar Graph presents the Revenue and Expenditure (in crores of Rupees ) of a company during the five year period, 2014-2018.
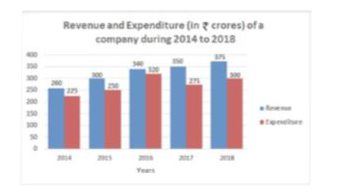
What is the ratio of the total revenue of the company in 2015 and 2018 to that of its expenditure in 2014 and 2018 ?
View SolutionStudy the following graph carefully and answer the given questions :-
The following graph shows the % profit of two companies over the years :-
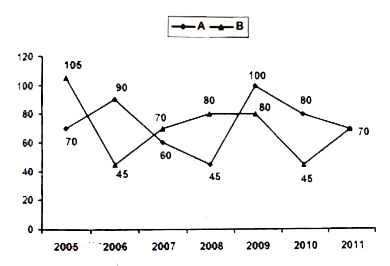
In which of the following years the ratio of expenditure to income was the least for company B?
View SolutionThe given pie chart shows the distribution of expenditure of a company (in percenatge). The total expenditure of the company is Rs. 136000.
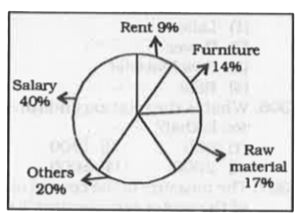
What will be the ratio of the expenditure incurrd on Salary to the expenditure incurred on Rent?
View Solution
