The following line graph gives the percent profit earned by two companies X and Y during the period Percentage profit earned by two companies X and Y =Income-ExpenditureExpenditure×100
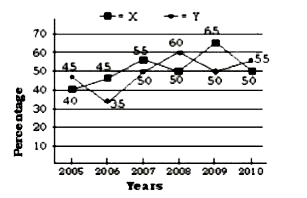
If the incomes of two companies were equal in 2008, then what was the ratio of expenditure of company X to that of company Y in 2008?
6:5
5:6
11:6
16:15
The correct Answer is:D
Step by step video & image solution for The following line graph gives the percent profit earned by two companies X and Y during the period Percentage profit earned by two companies X and Y =("Income-Expenditure")/("Expenditure")xx100 If the incomes of two companies were equal in 2008, then what was the ratio of expenditure of company X to that of company Y in 2008? by Maths experts to help you in doubts & scoring excellent marks in Class 14 exams.
Updated on:21/07/2023Topper's Solved these Questions
Similar Questions
The following line graph gives the percent profit earned by two companies X and Y during the period Percentage profit earned by two companies X and Y =Income-ExpenditureExpenditure×100
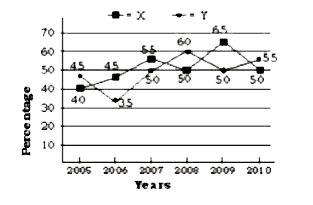
If the expenditure of company Y in 2006 was Rs. 220 crores, what was its income in 2006 ?
View SolutionThe following line graph gives the percent profit earned by two companies X and Y during the period Percentage profit earned by two companies X and Y =Income-ExpenditureExpenditure×100
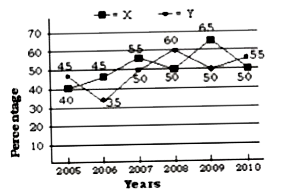
The income of two companies X and Y in 2009 were in the ratio of 3 : 4 respectively. What was the respective ratio of their expenditures in 2009?
View Solution
Knowledge Check
Study the following graph carefully to answer the questions that follows
In the given years total earned profit by two companies
% profit=Income-ExpenditureExpenditure×100%
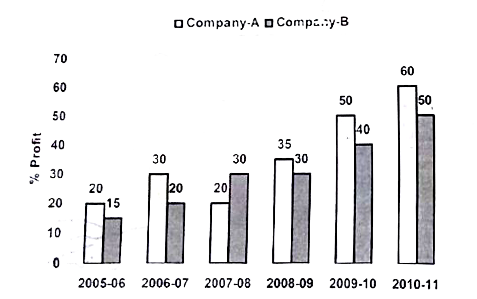
If income of company B in 2009-10 was 175 crore then what was the expenditure of company B in 2010-11?A2:3B1:2C3:4DCan't be determinedStudy the following graph carefully to answer the questions that follows
In the given years total earned profit by two companies
% profit=Income-ExpenditureExpenditure×100%
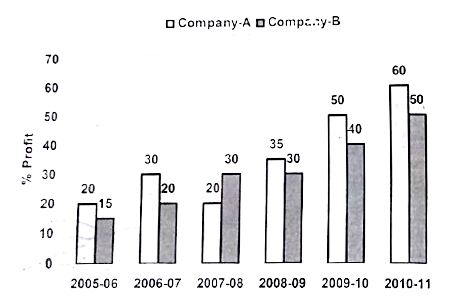
If the income of company Ain 2006-07 was equal to expenditure of company B in 2010-11 then what was the respective ratio of income of company A in 2006-07 and that of company B in 2010-11 ?A2:3B3:5C13:15DCan't be determinedStudy the following graph carefully and anser the question
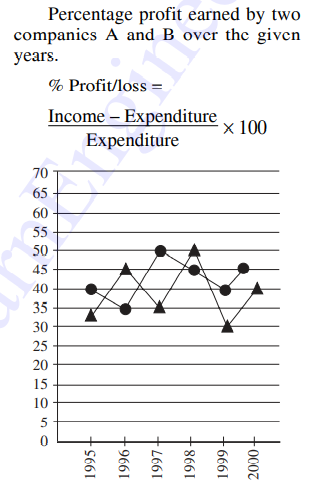
If the incomes of company B in 1997 and 1998 were in the ratio of expenditures of that company in these two years?A20:29B9:10C29:45D10:29
The following line graph gives the percent profit earned by two companies X and Y during the period Percentage profit earned by two companies X and Y =Income-ExpenditureExpenditure×100
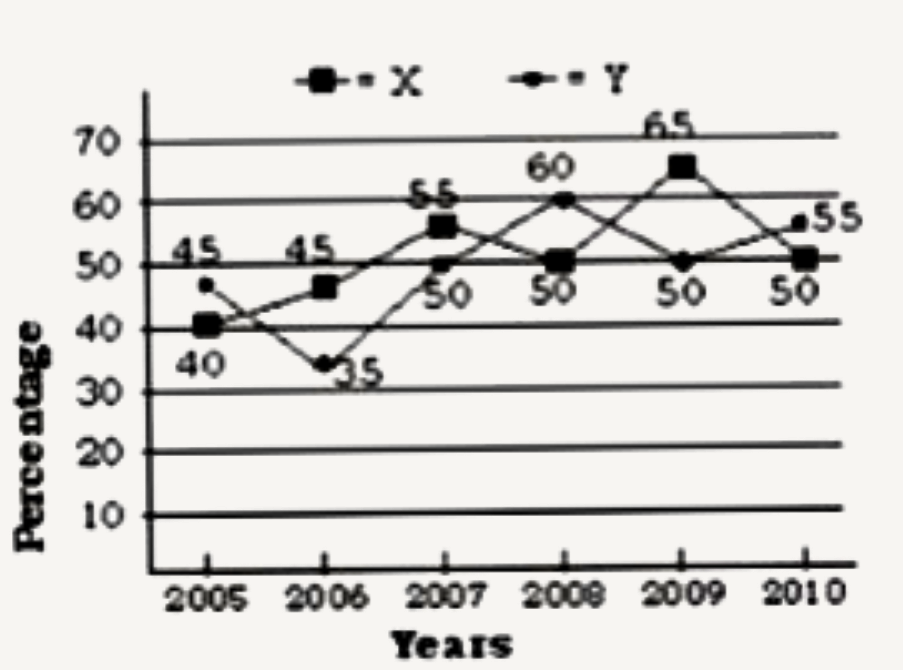
If the expenditure of company X and Y is 2005 were equal and the total income of the two companies in 2005 was Rs. 342 crores, what was the total profit of the two companies together in 2005?
View SolutionThe following line graph gives the percent profit earned by two companies X and Y during the period Percentage profit earned by two companies X and Y =Income-ExpenditureExpenditure×100
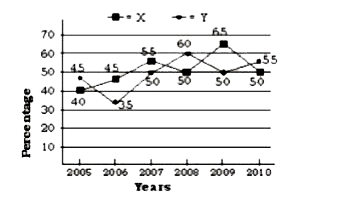
The expenditure of company X in the year 2007 was Rs. 200 crores and the income of company X in 2007 was the same as its expenditure in 2010. The income of company X in 2010 was
View SolutionPer cent Profit =Income-ExpenditureExpenditure×100
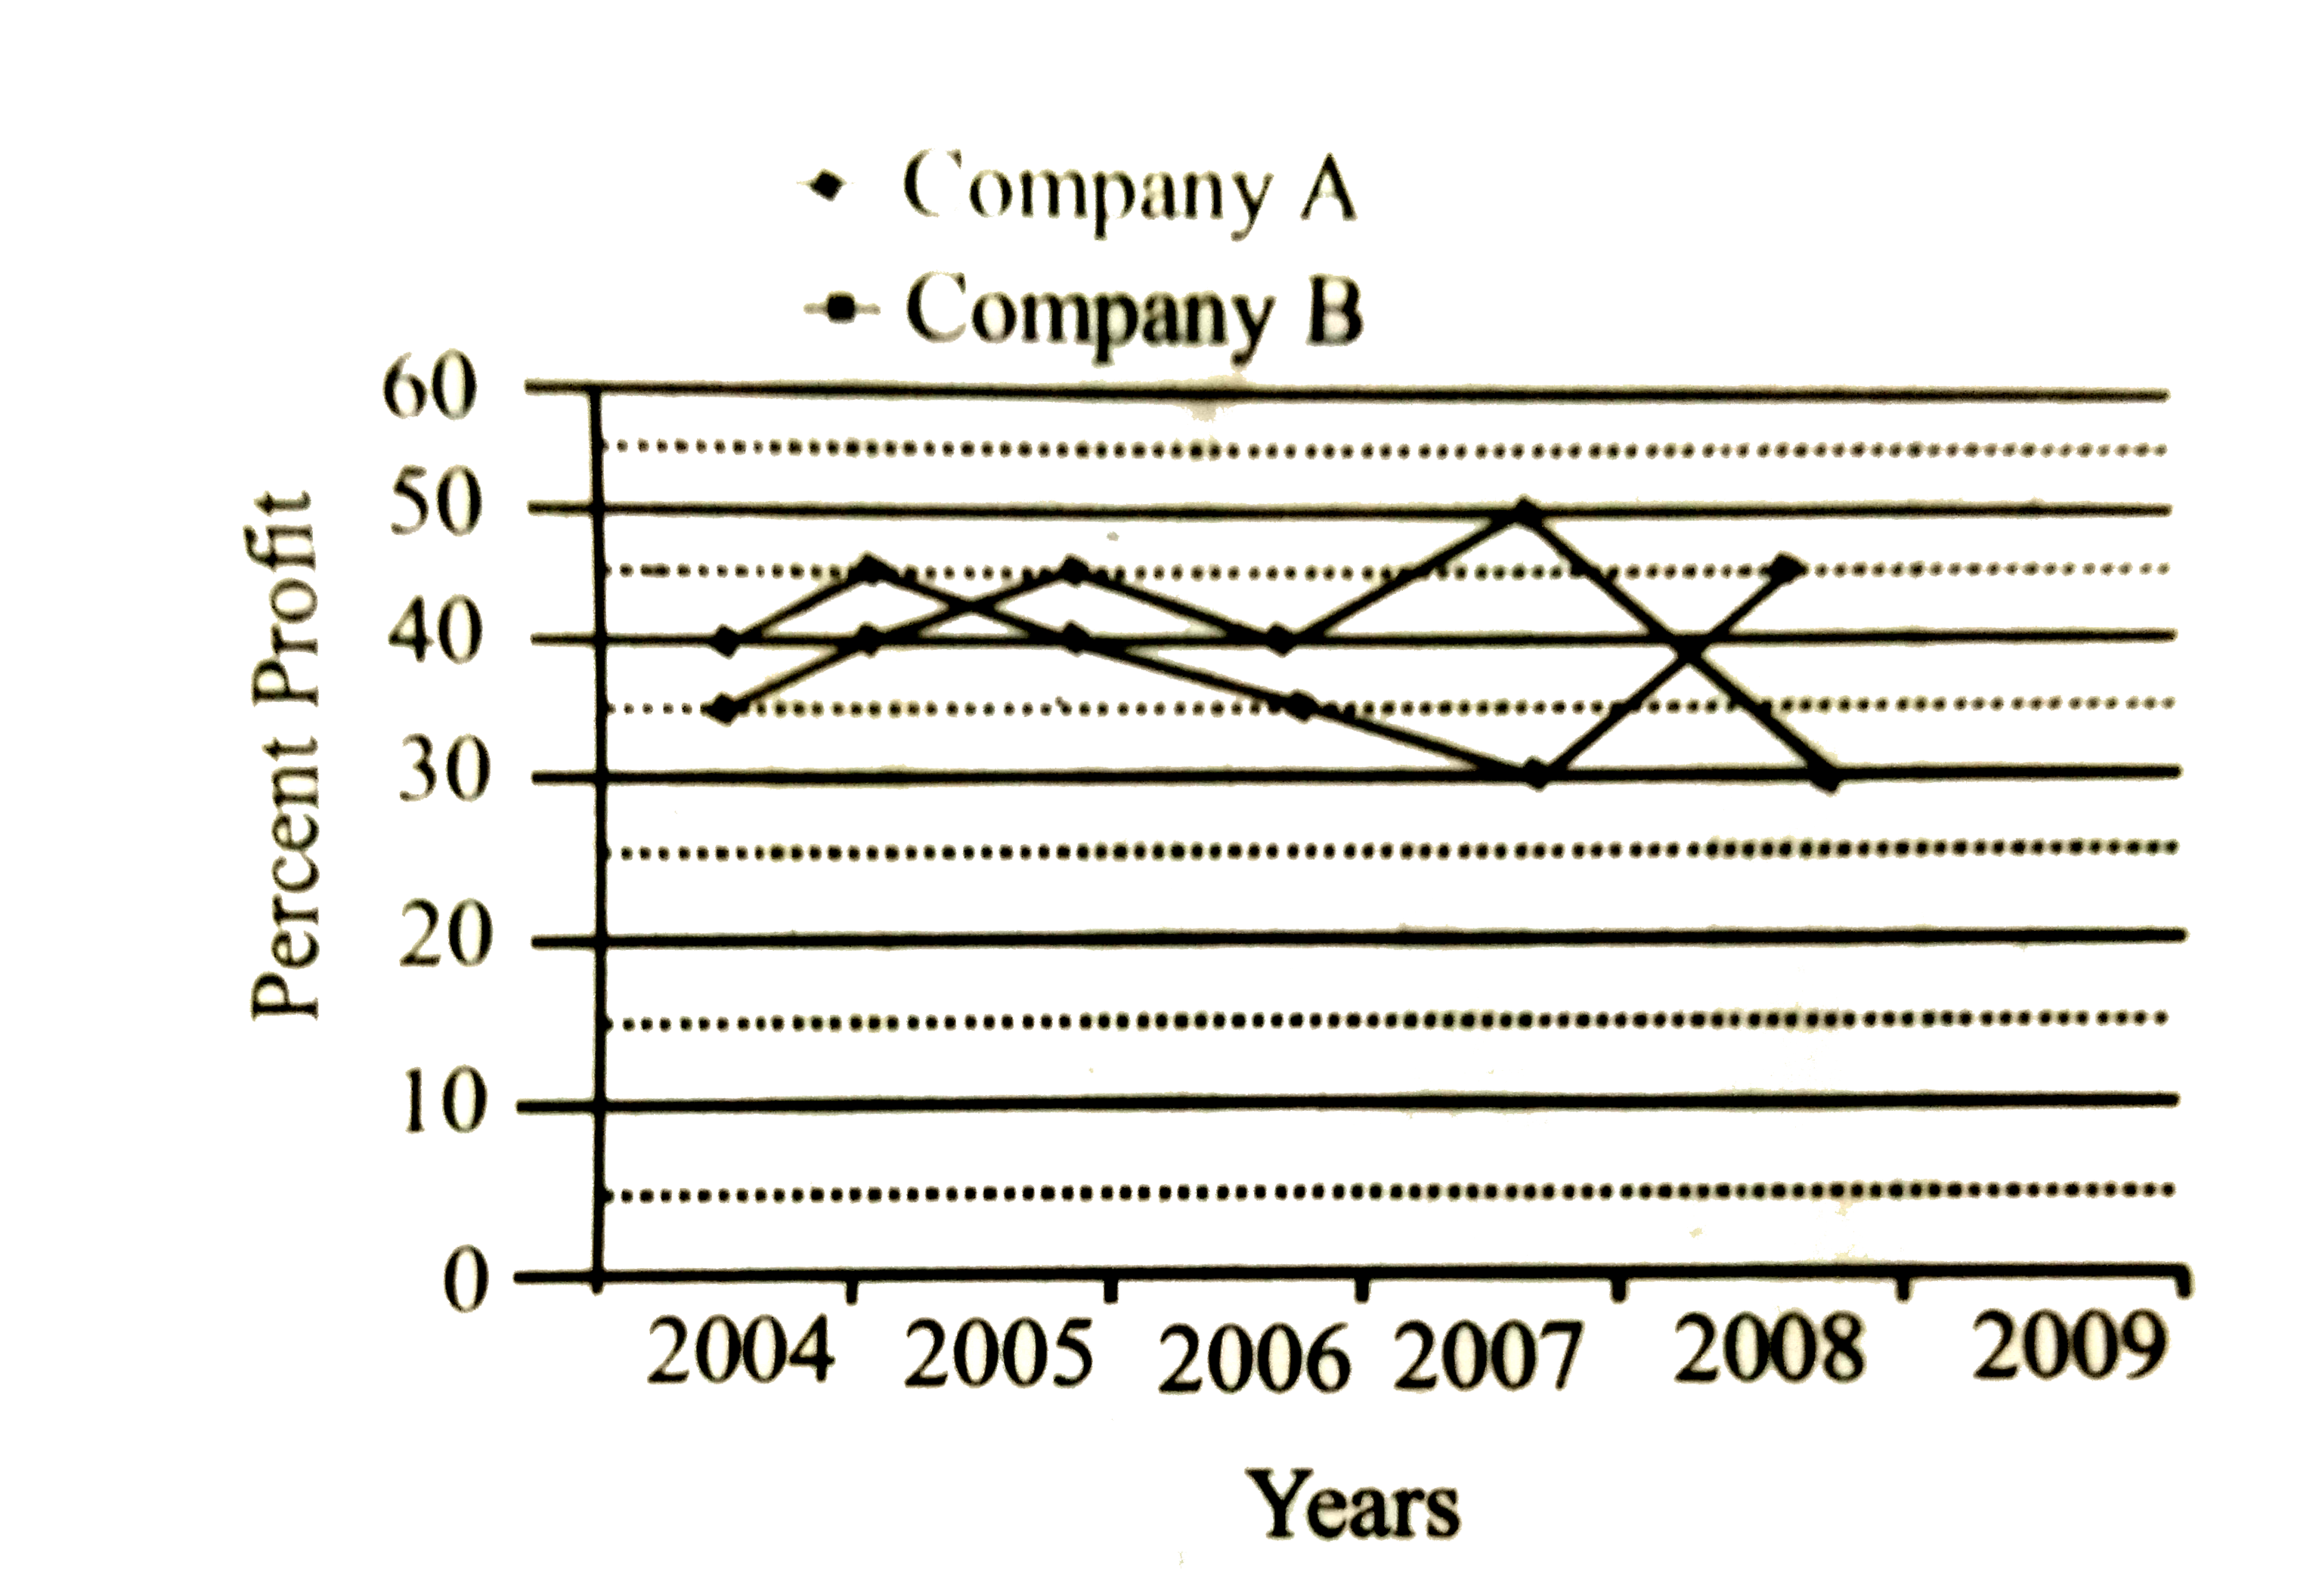
If in the year 2008, the income of both the companies A and B was the same, what was the respective ratio of expenditure of company A to te expenditure of comapny B in that year ?
View Solution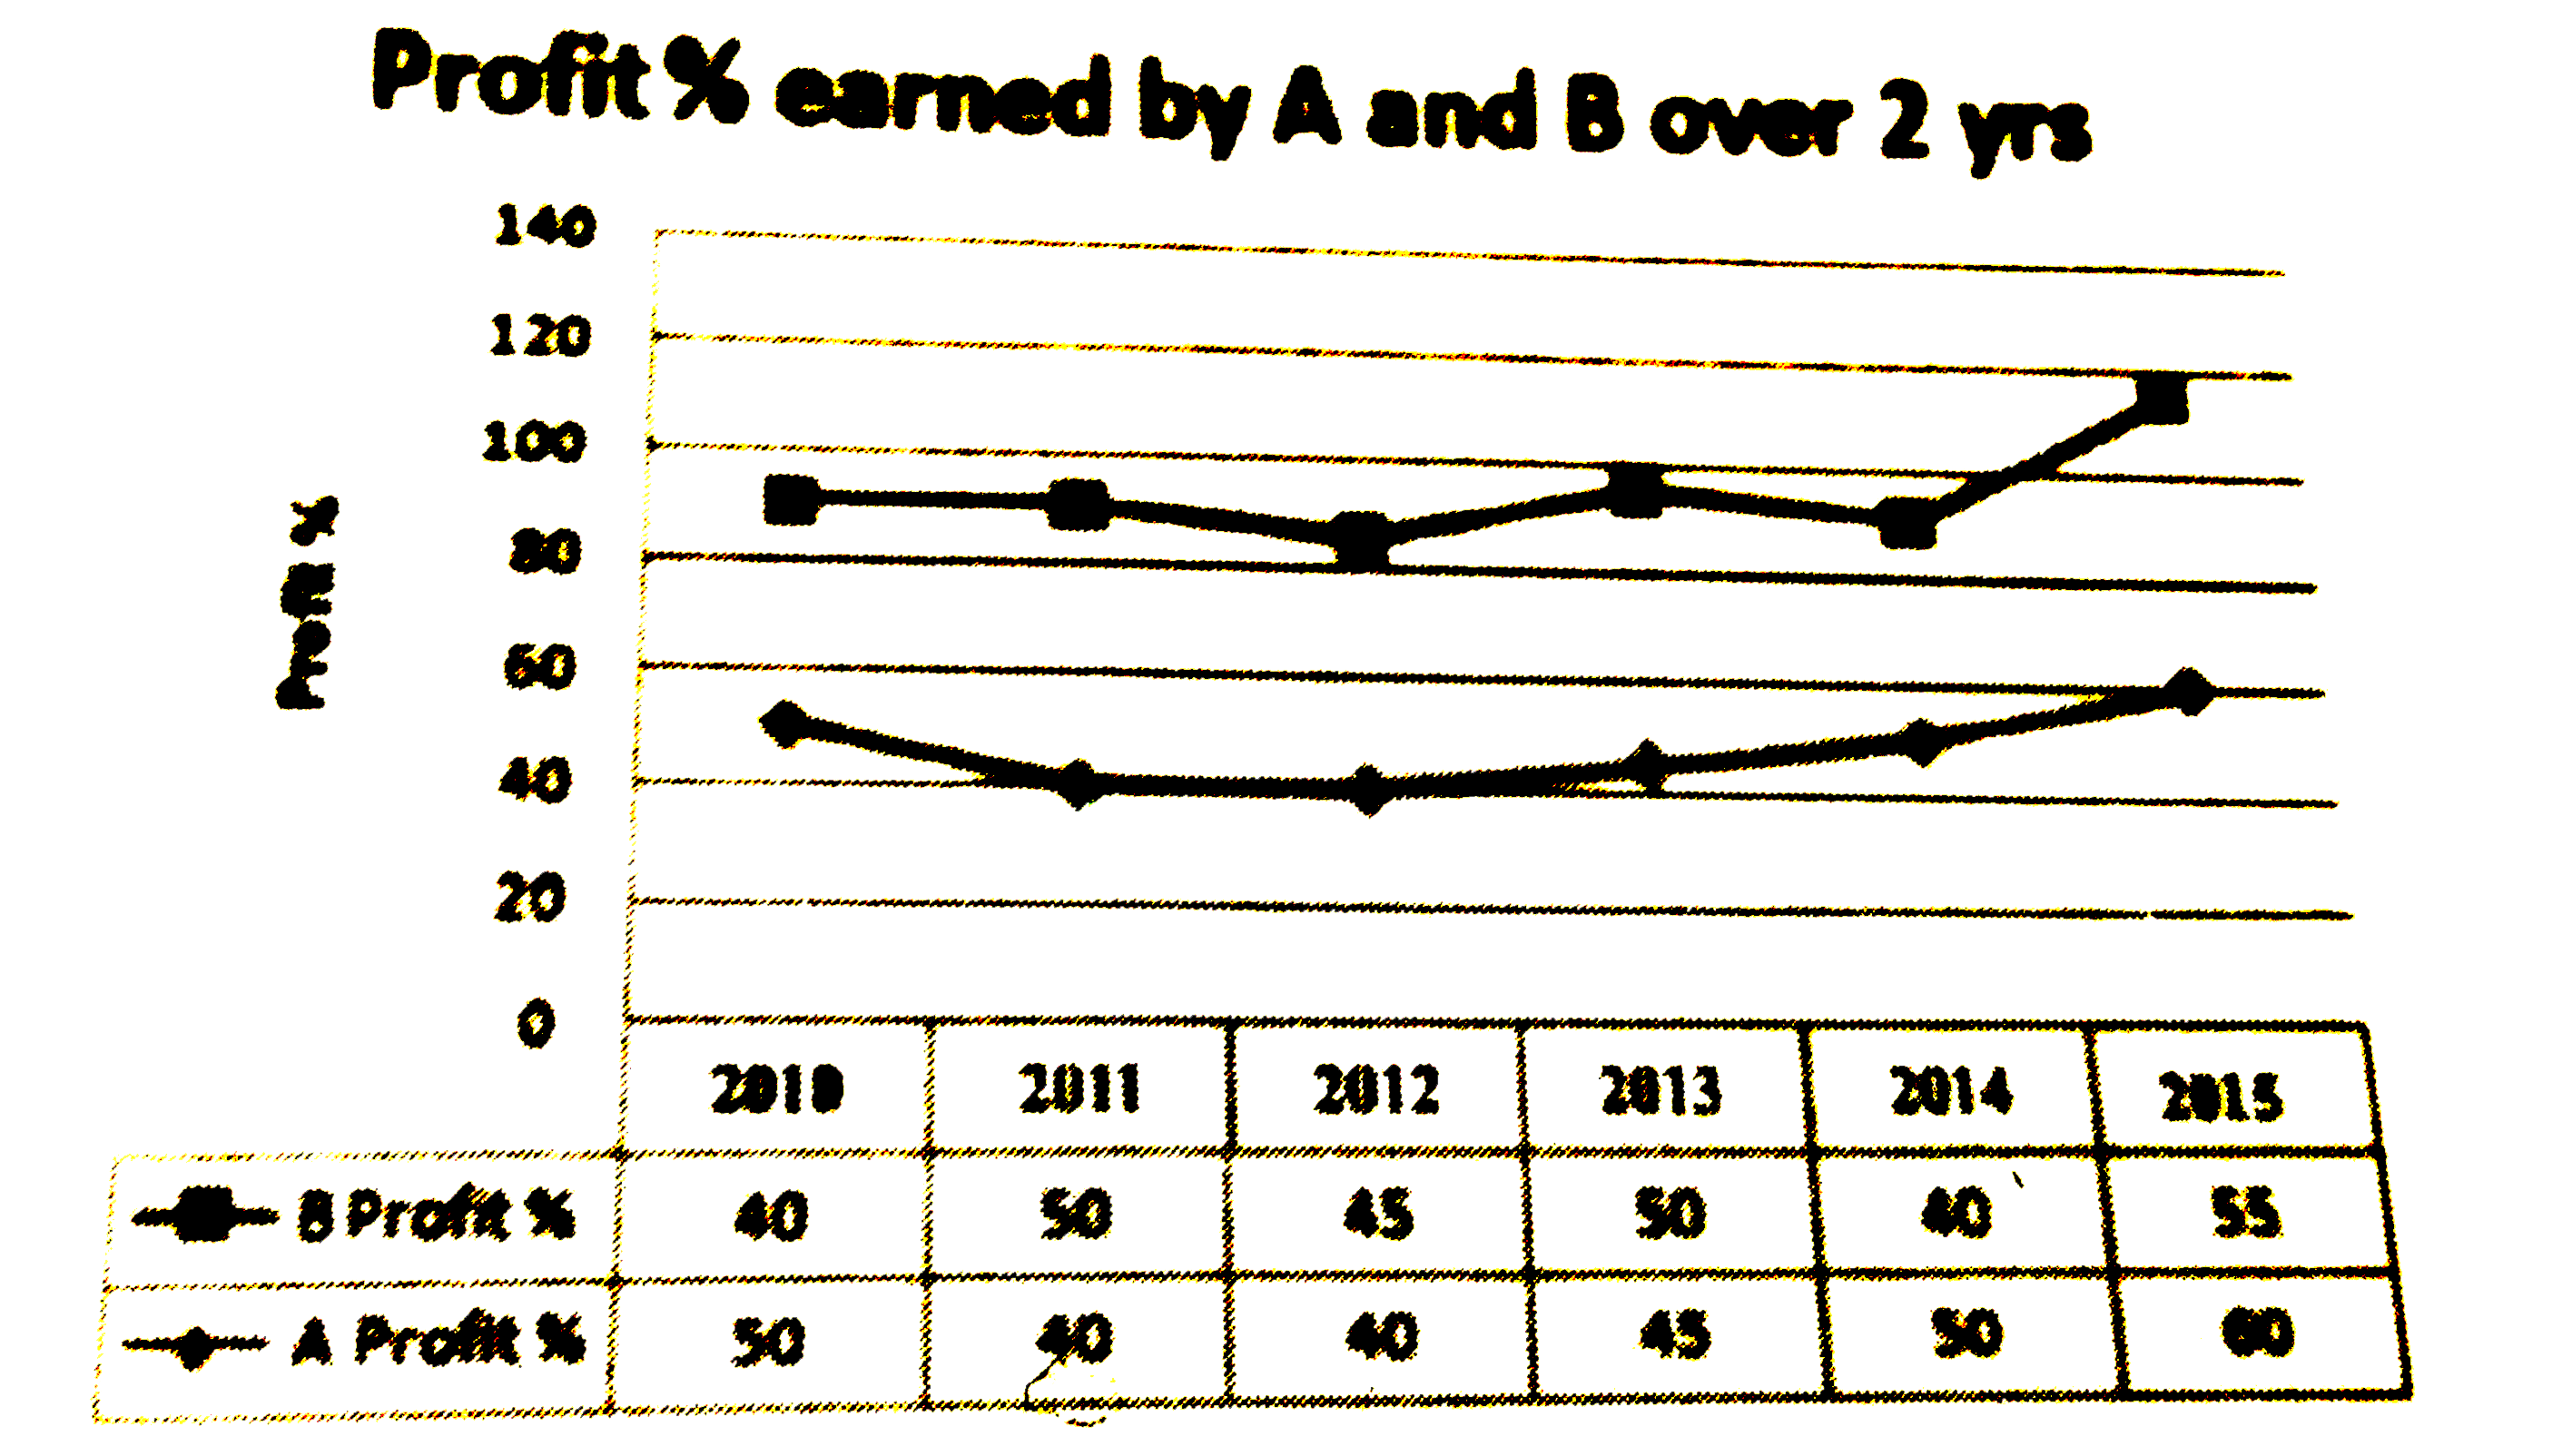
If the incomes of the B in 2012 and 2013 were in the ratio 3:4 Find the ratio of Expenditure of that company in theses 2 years ?
View SolutionPer cent Profit =Income-ExpenditureExpenditure×100
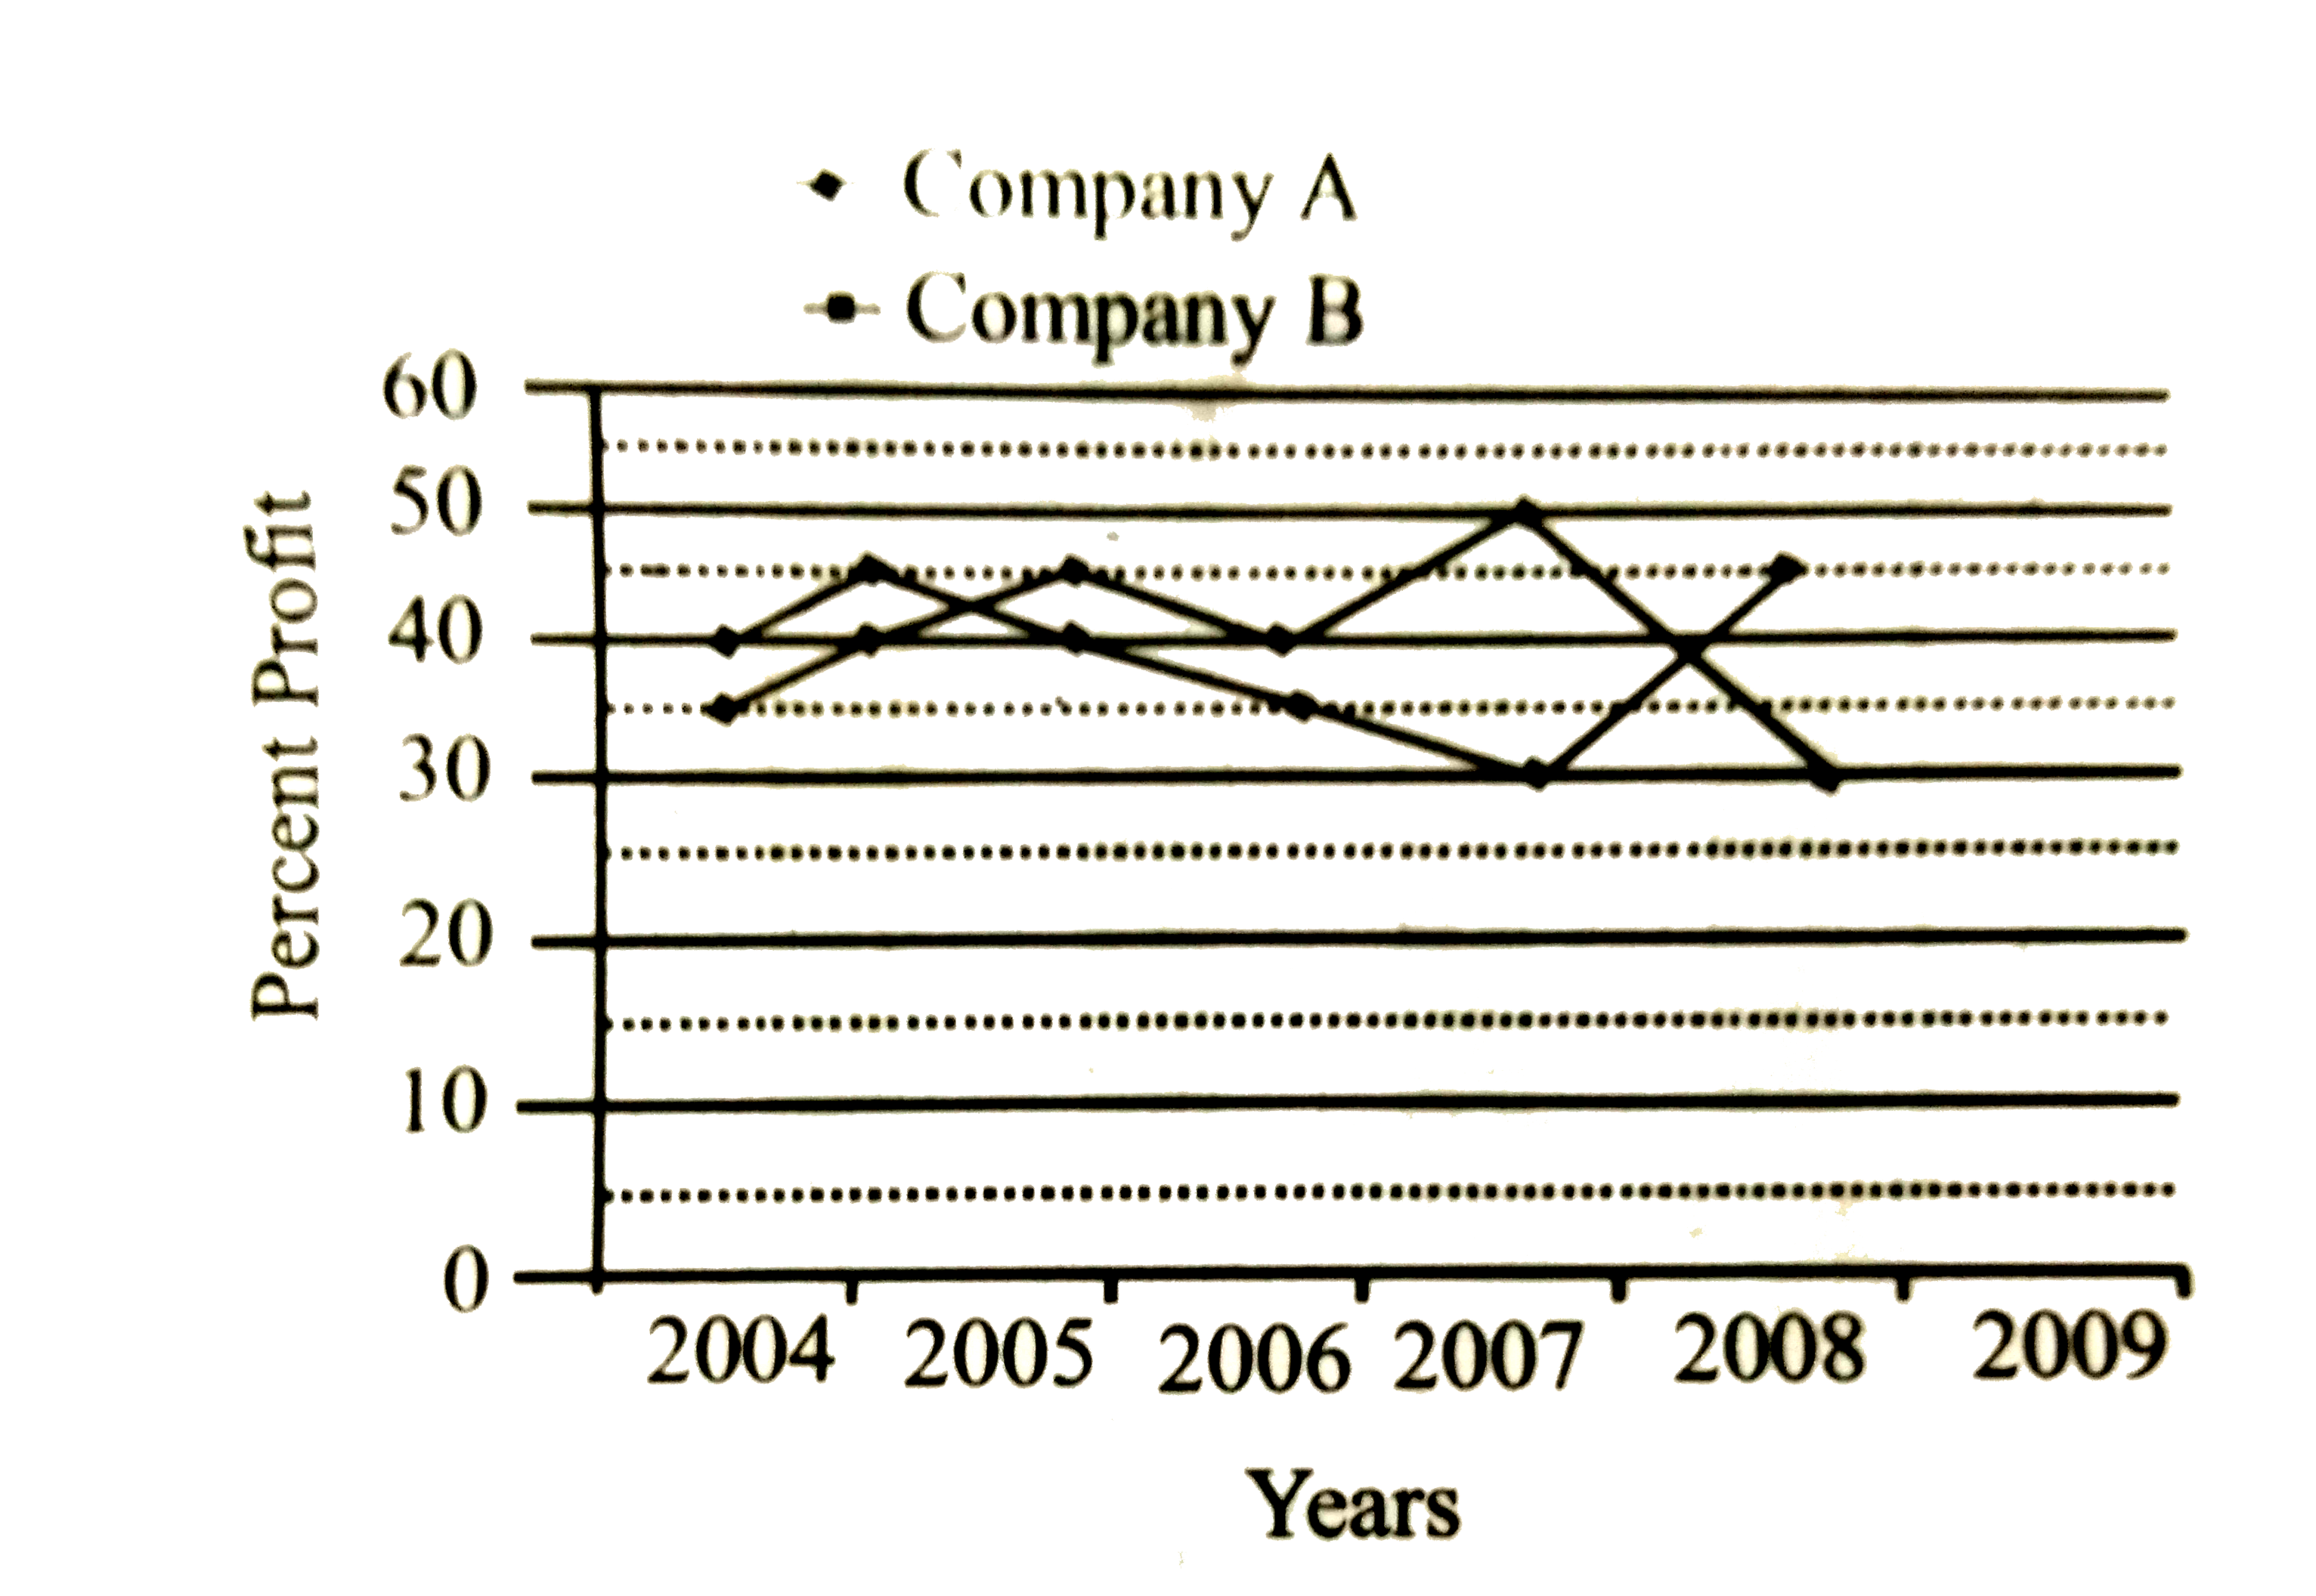
If the amount of profit earned by Company A in the year 2007 was Rs. 1.5 lakhs, what was its expenditure in that year ?
View Solution
