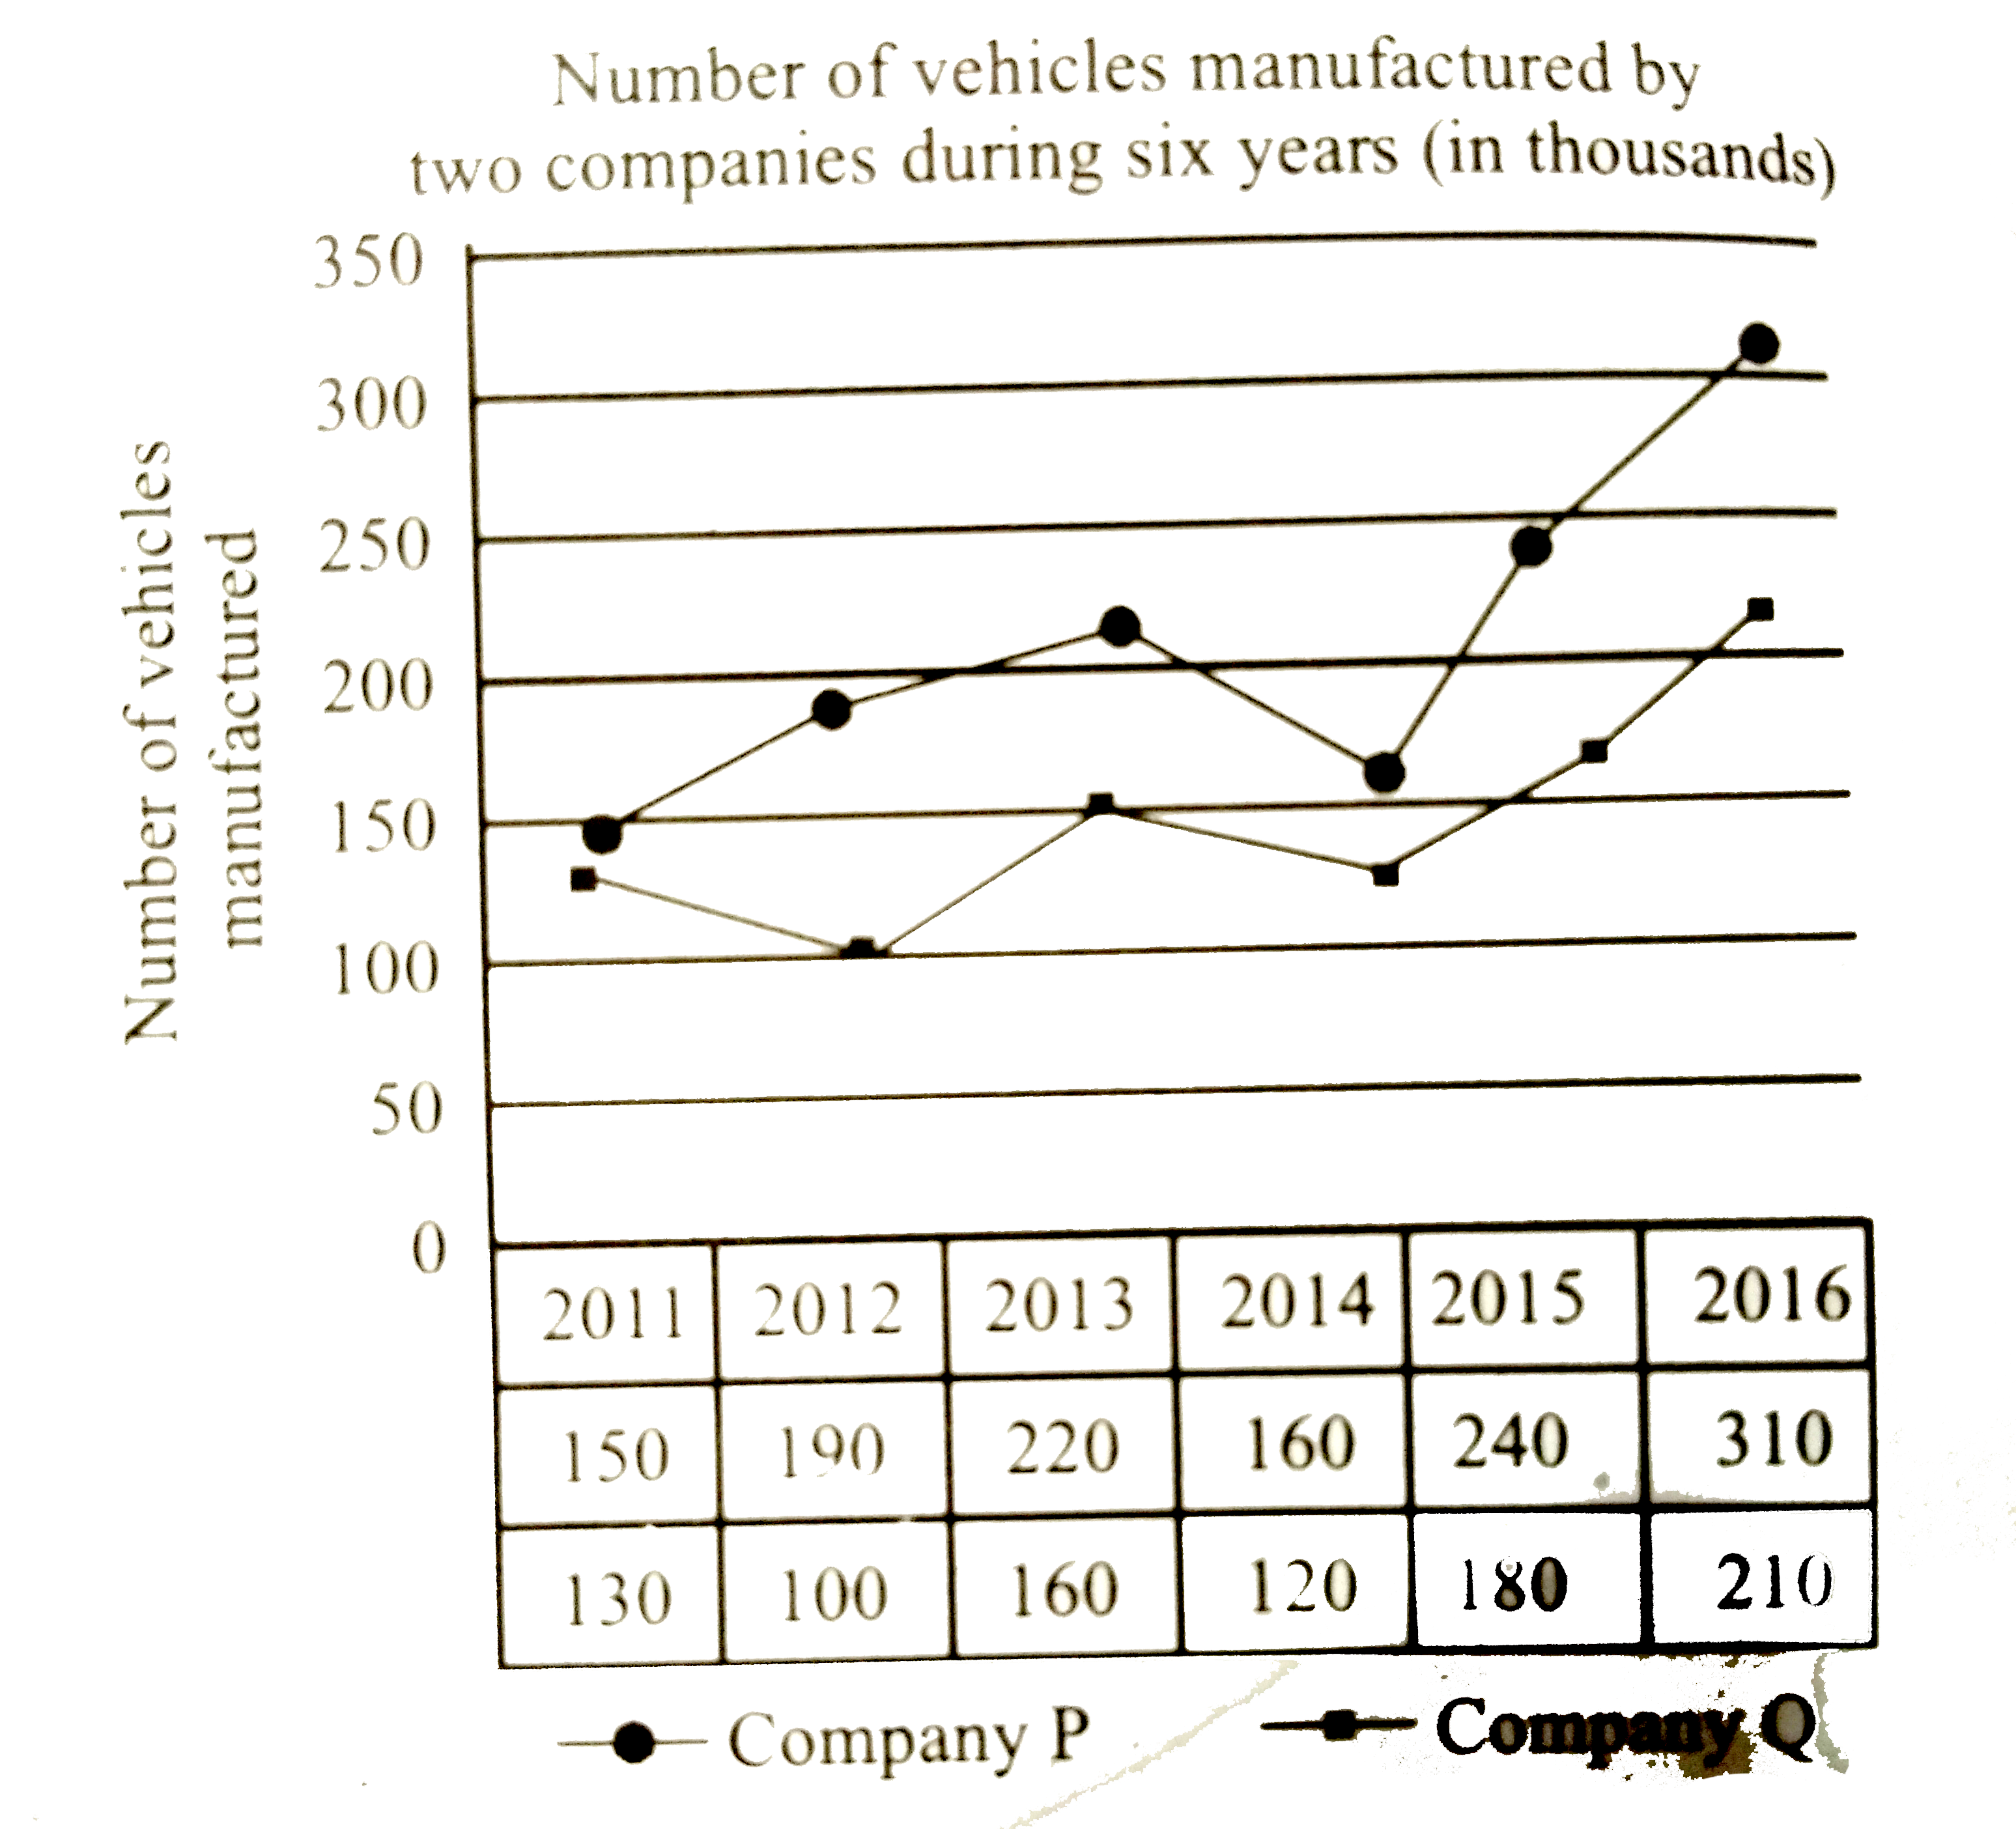
What is the difference between total number of vehicles manufactured by company P in 2013,2014 and 2016 together and company Q in 2014,2015 and 2016 together ? (In thousands)
a) 120
b) 210
c) 100
d) 180
Tota number of vehicles produced by P in 2013, 2014 and 2016=690
Produced by Q in year 2014,2015 and 2016=510
∴ Difference =690-510=180 thousands
Topper's Solved these Questions
Similar Questions
Knowledge Check
A book has been co-authored by X and Y. the prices of the book in India and abroad are ₹800 and ₹1000 respectively. The royalties earned on sale in India and abroad are 10% and 16% respectively. the royalty amount is distributed among X and Y in the ratio 5:3. The given bar graph presents the number of copies of the book sold in India (A) and abroad (B) during 2012-16.
एक पुस्तक का सह-लेखन X और Yद्वारा किया गया है| भारत में और विदेश में पुस्तक का मूल्य क्रमशः ₹800 और ₹1000 है| भारत और विदेश में बिक्री पर अर्जित स्वत्व शुल्क (रॉयल्टी] क्रमशः 10% और 16% है| स्वत्व शुल्क[ रॉयल्टी] की धनराशि को X और Y के बीच 5:3 के अनुपात में वितरित किया जाता है| दिया गया स्तम्भ आलेख (बार ग्राफ] 2012-16 के दौरान भारत (A) और विदेश (B) में बिक्री पुस्तक की संख्या को दर्शाता है|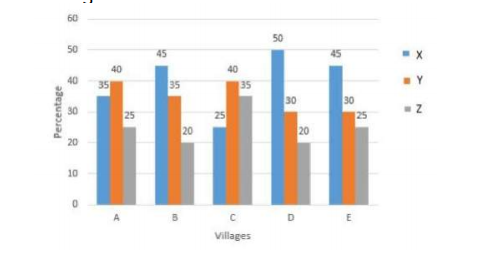
What is the difference between the royalties earned by X and Y (in ₹) during the years 2014 and 2015 taken together?
वर्ष 2014 और 2015 को मिलाकर X तथा Y द्वारा अर्जित स्वत्व शुल्क (रॉयल्टी) में कितना अंतर (₹ में) है?A41340B41250C57550D57000Study the table carefully to answer the following questions ----
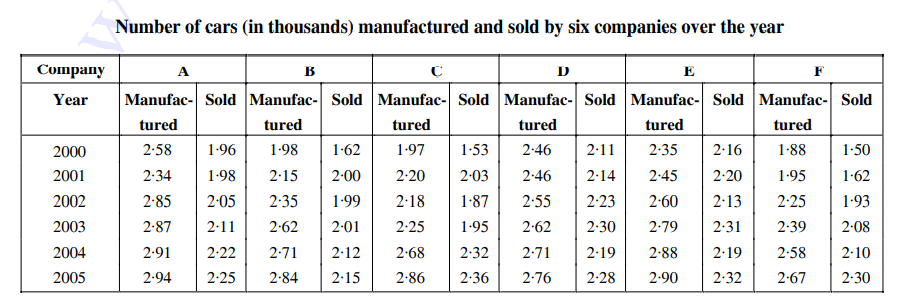
What is respective ratio of total number of cars manufactured by companies A, B and C together in the year 2001 to those manufactured by companies D, E and F together in the year 2003 ?A164 : 217B223 : 260C260 : 223D217 : 164the given bar graph presents income and Expenditure of a company for the five years, 2014 to 2018
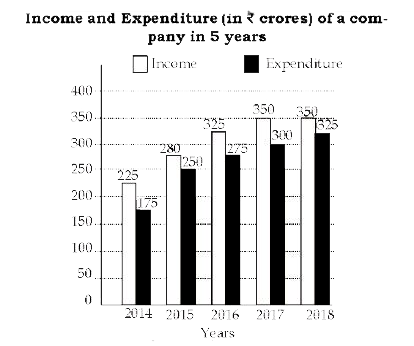
What is the ratio of total expenditure to total income of the company in 2014,2016 and 2017?A13:18B3:4C15:16D5:6
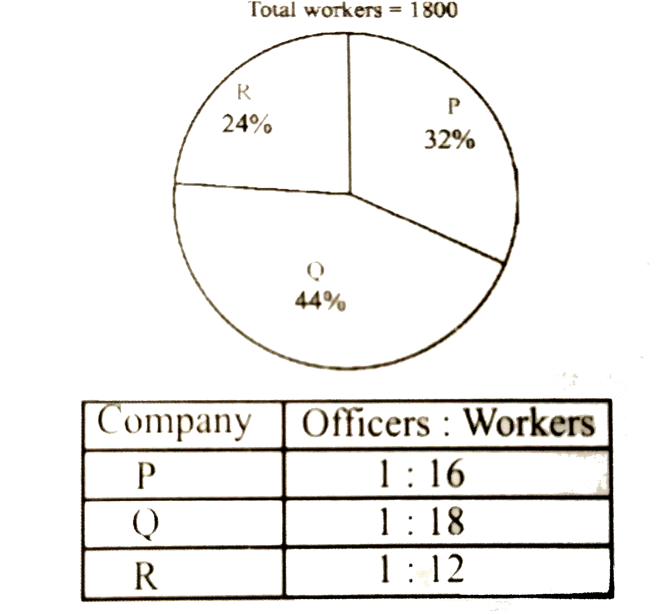
Find the difference between total number of workers in company 'P' and total number of workers in company 'Q' and 'R' together ?
View SolutionThere are two car manufacturing companies (Company X and Company Y). The sale of cars by these two different companies is given in different years.
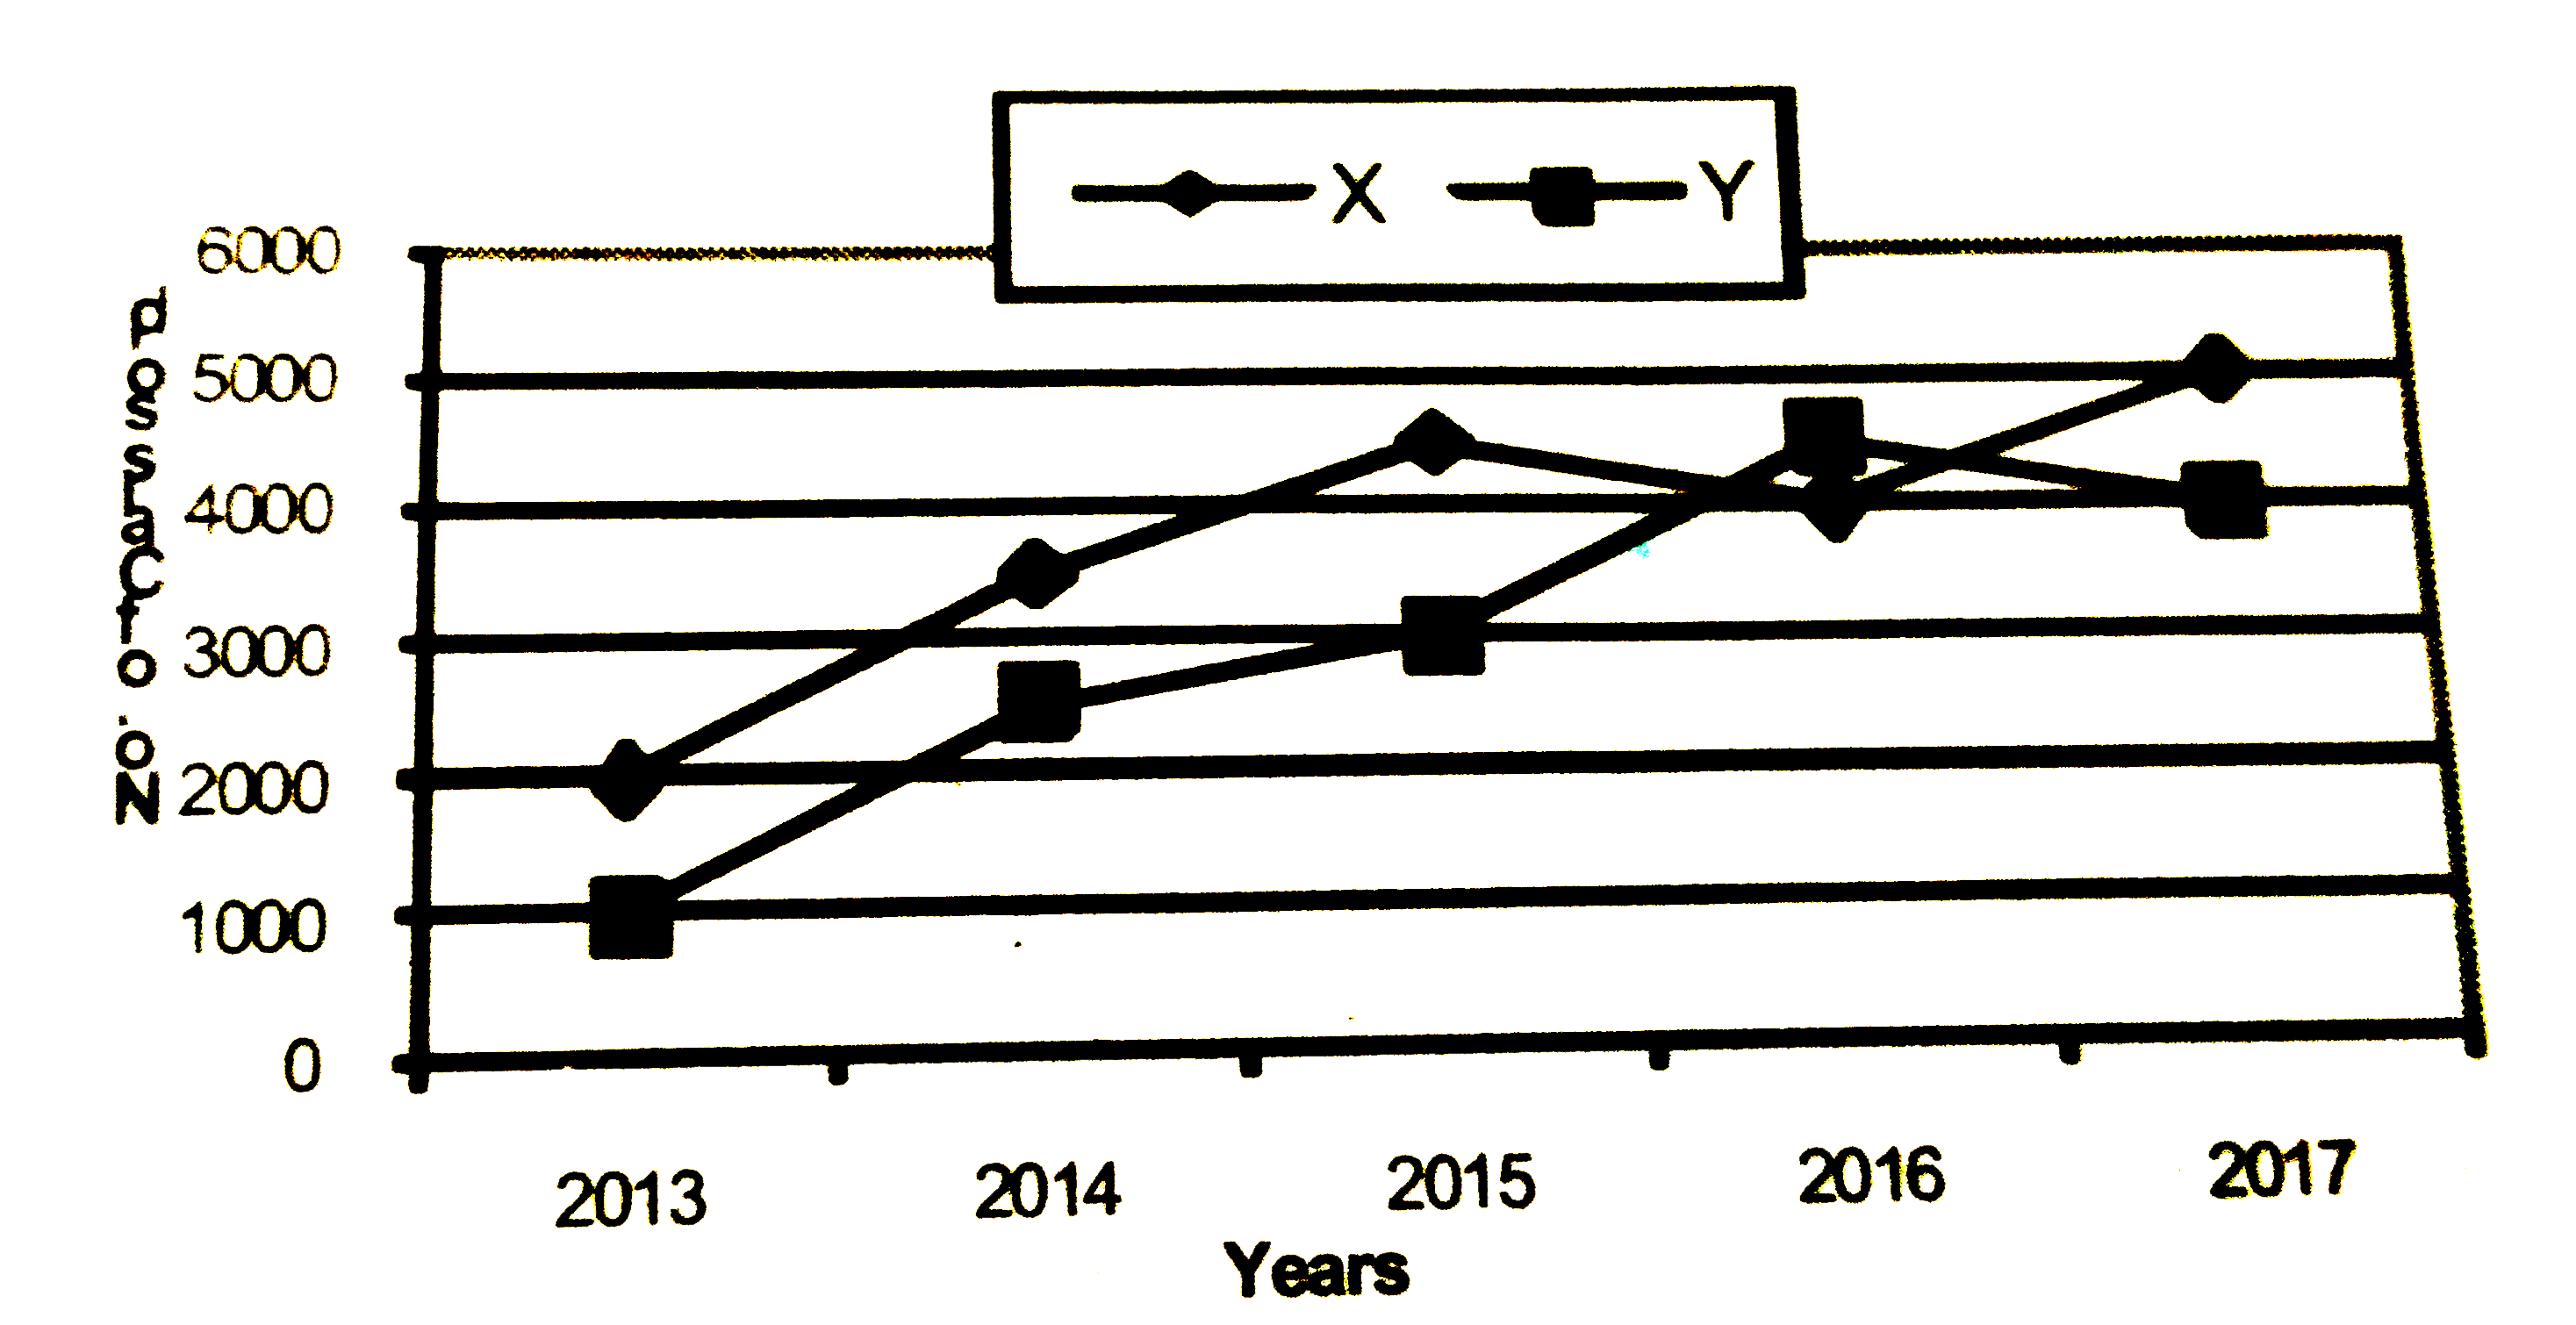
Find the ratio of the sales of company X in years 2013, 2015 and 2017 together to the total sale of company Y in year 2014 and 2016 ? together ?
View Solution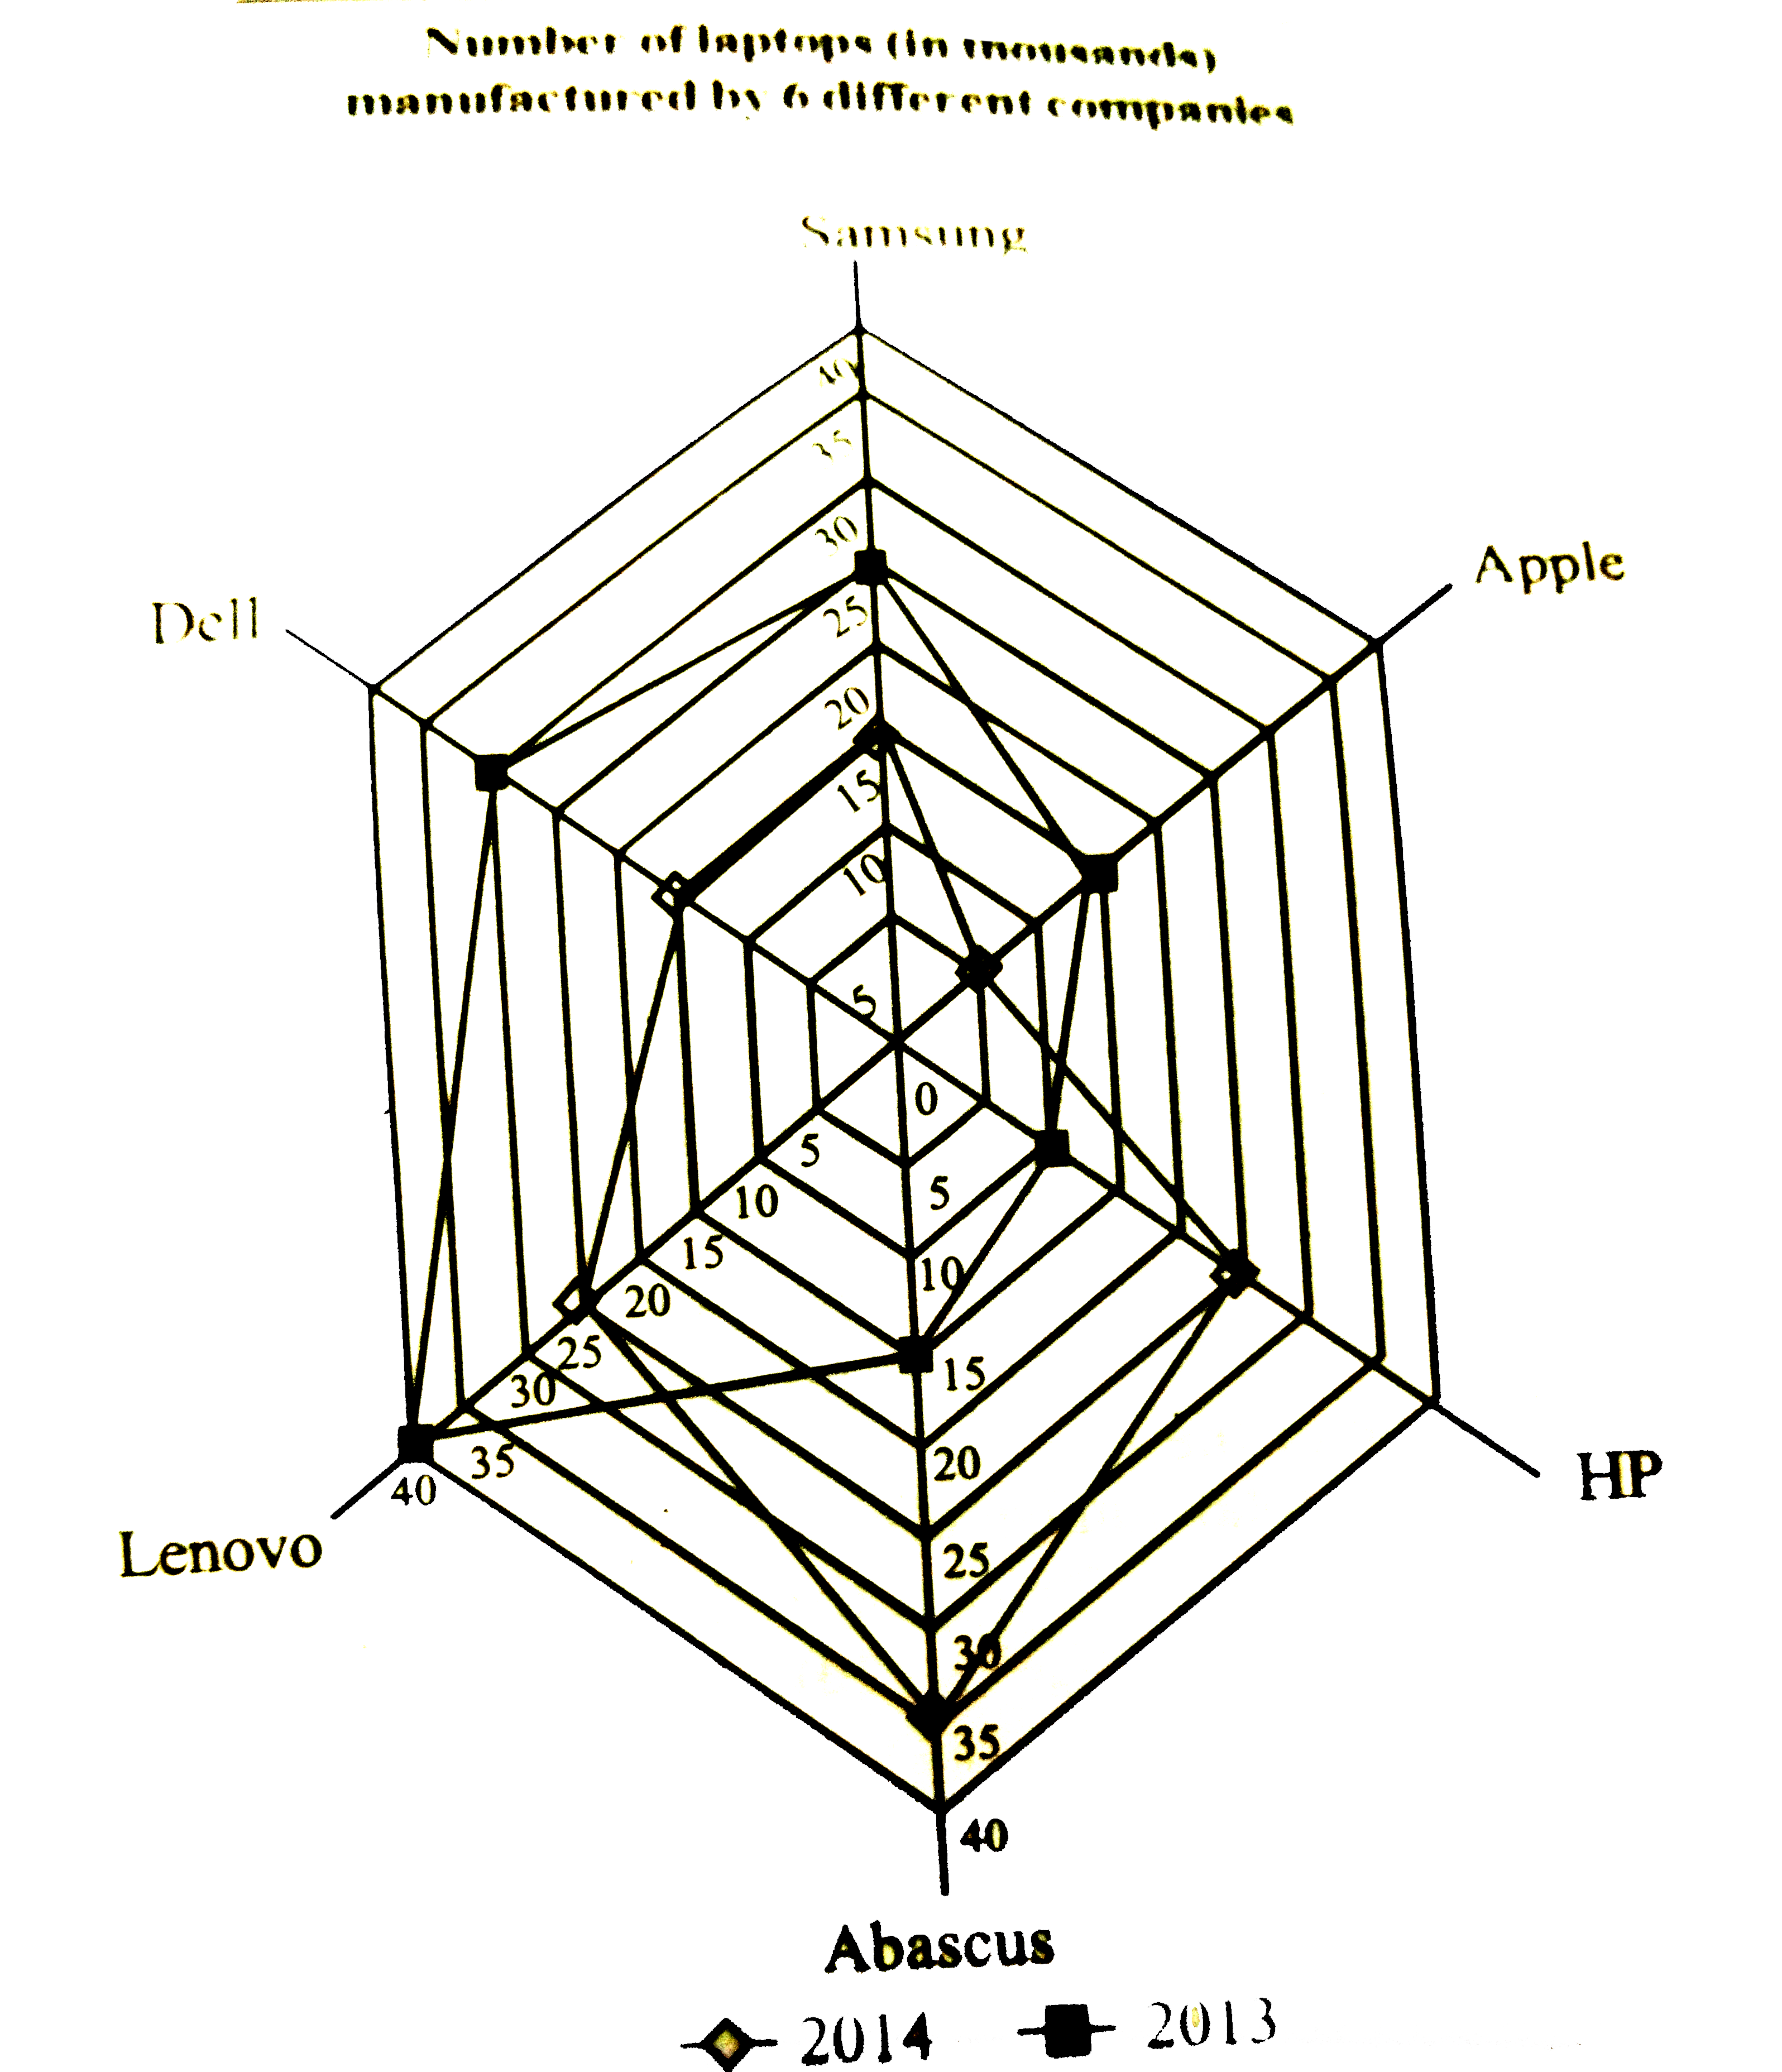
The respective ratio between the number of laptops manufactured by Lenovo in 2013 and that by Abascus in 2014 is
View Solution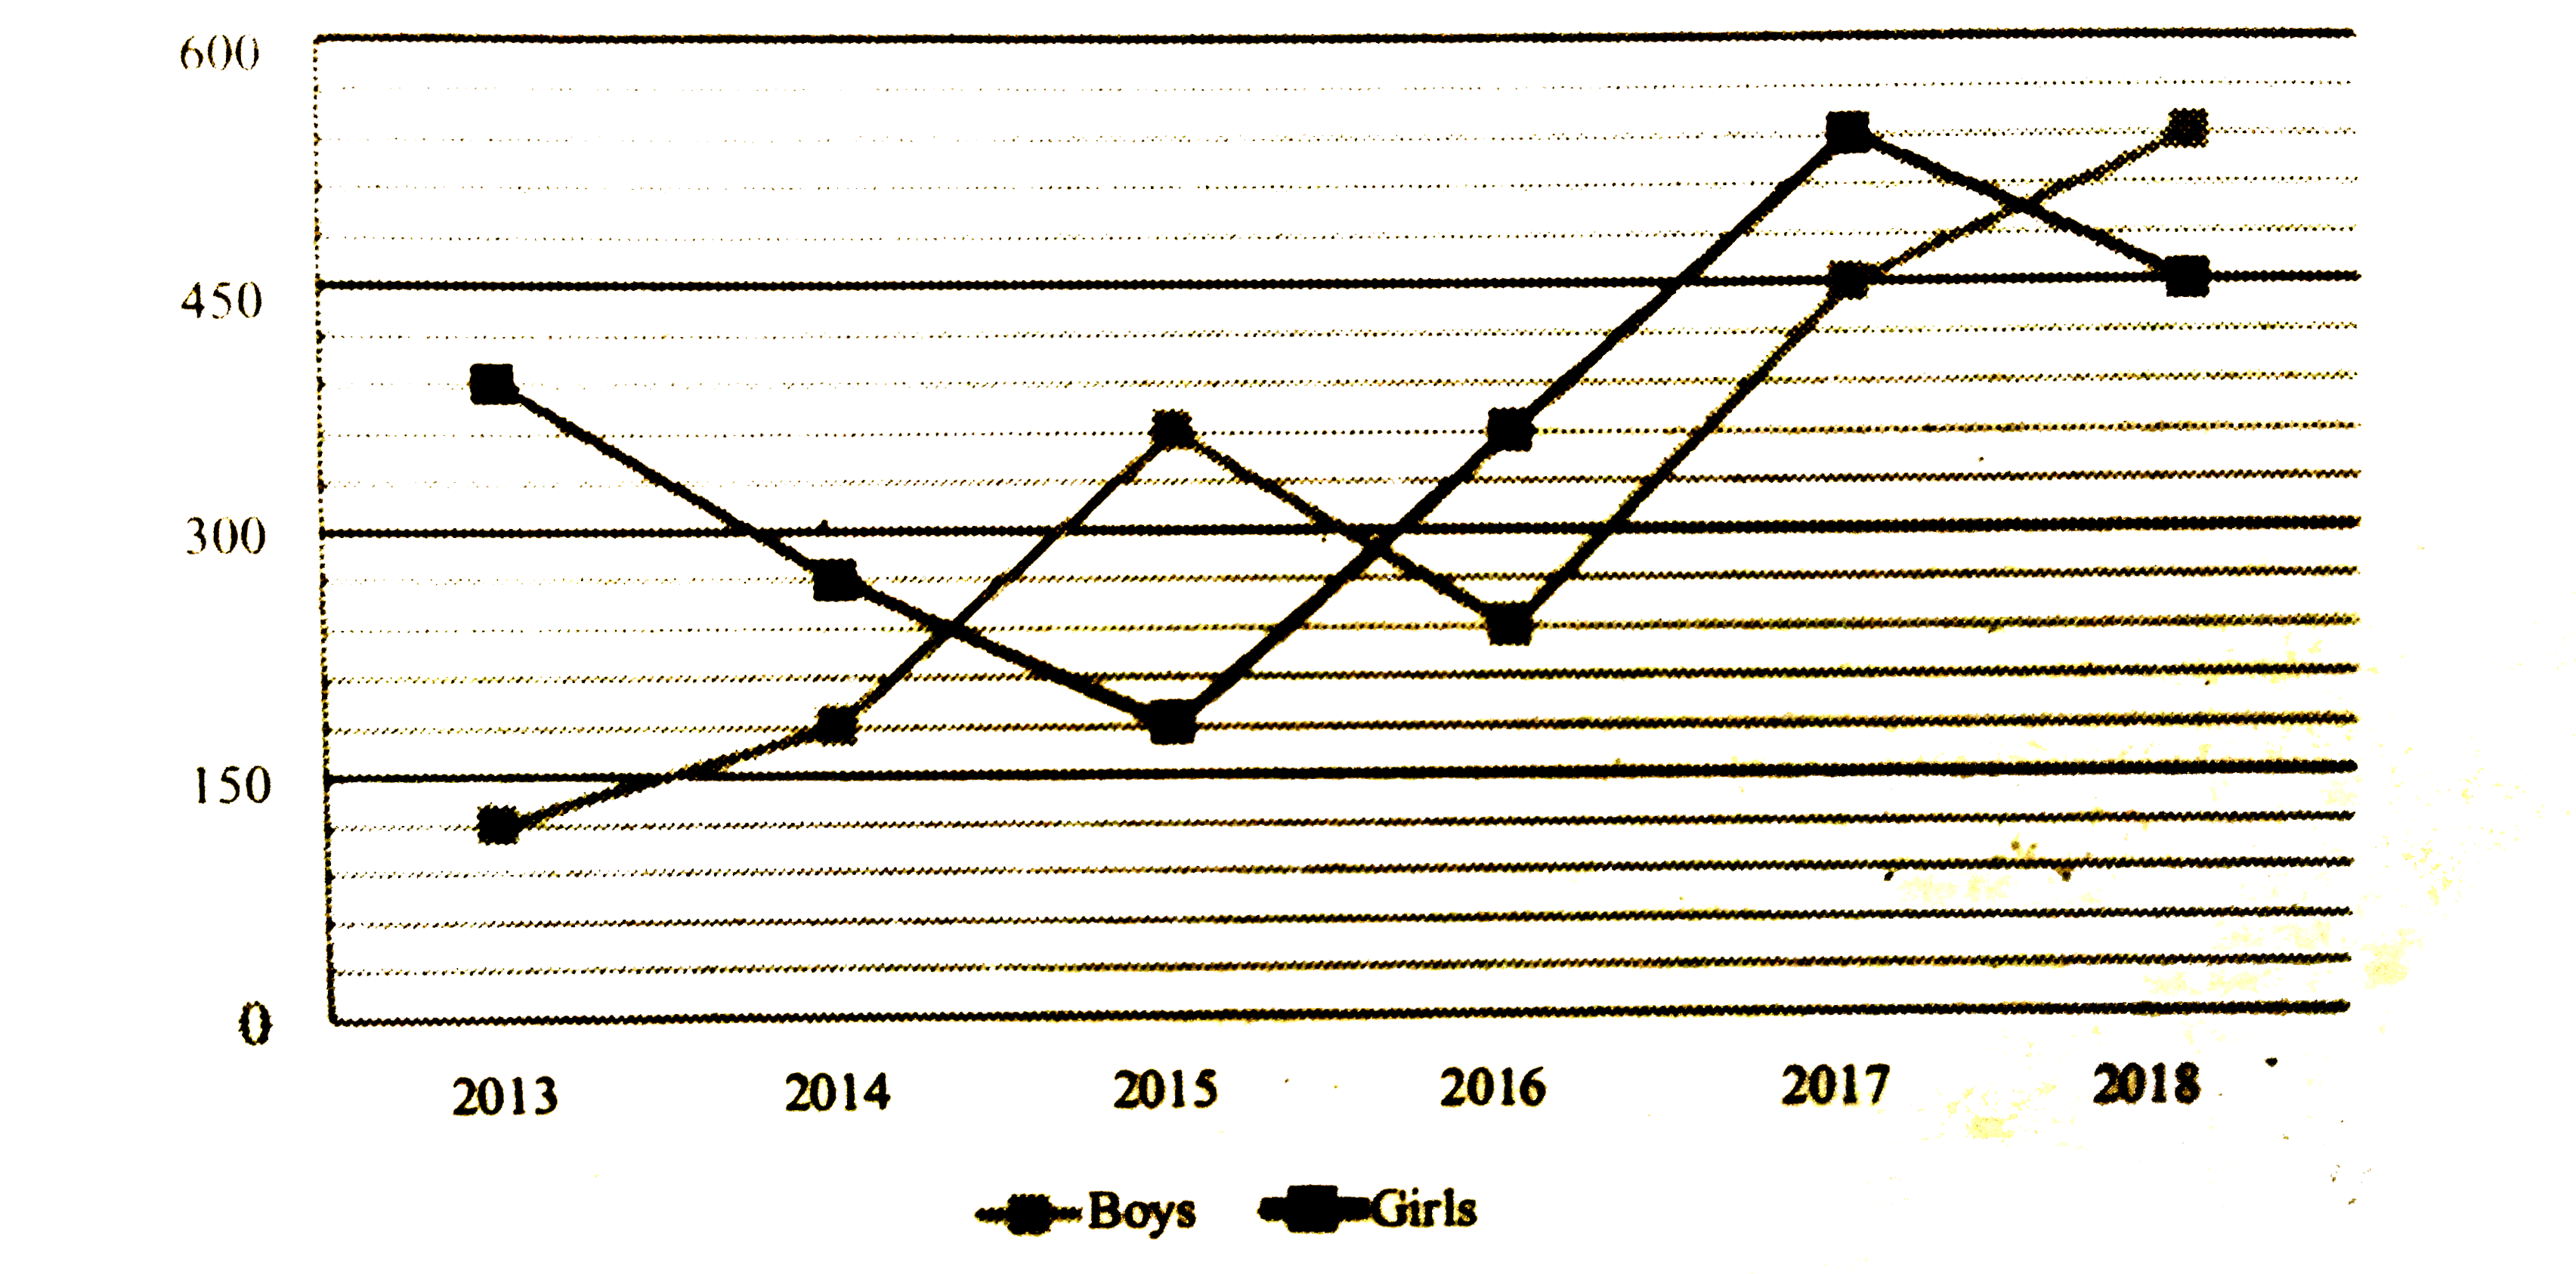
Find the ratio between total number total number of boys and Girls working in 2014 and 2015 together to total number of Boys and Girls working in 2017 and 2018 together ?
View SolutionStudy the following graph which shows the production (in thousands)of different items, and answer these questions
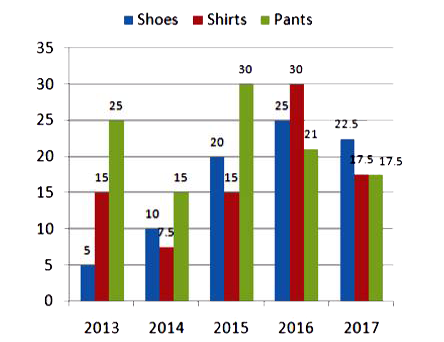
The difference between the total number of Shoes and Shirts produced by the company in the year 2016 and the number of Pants produced by the company in the year 2014 is:
View Solution

