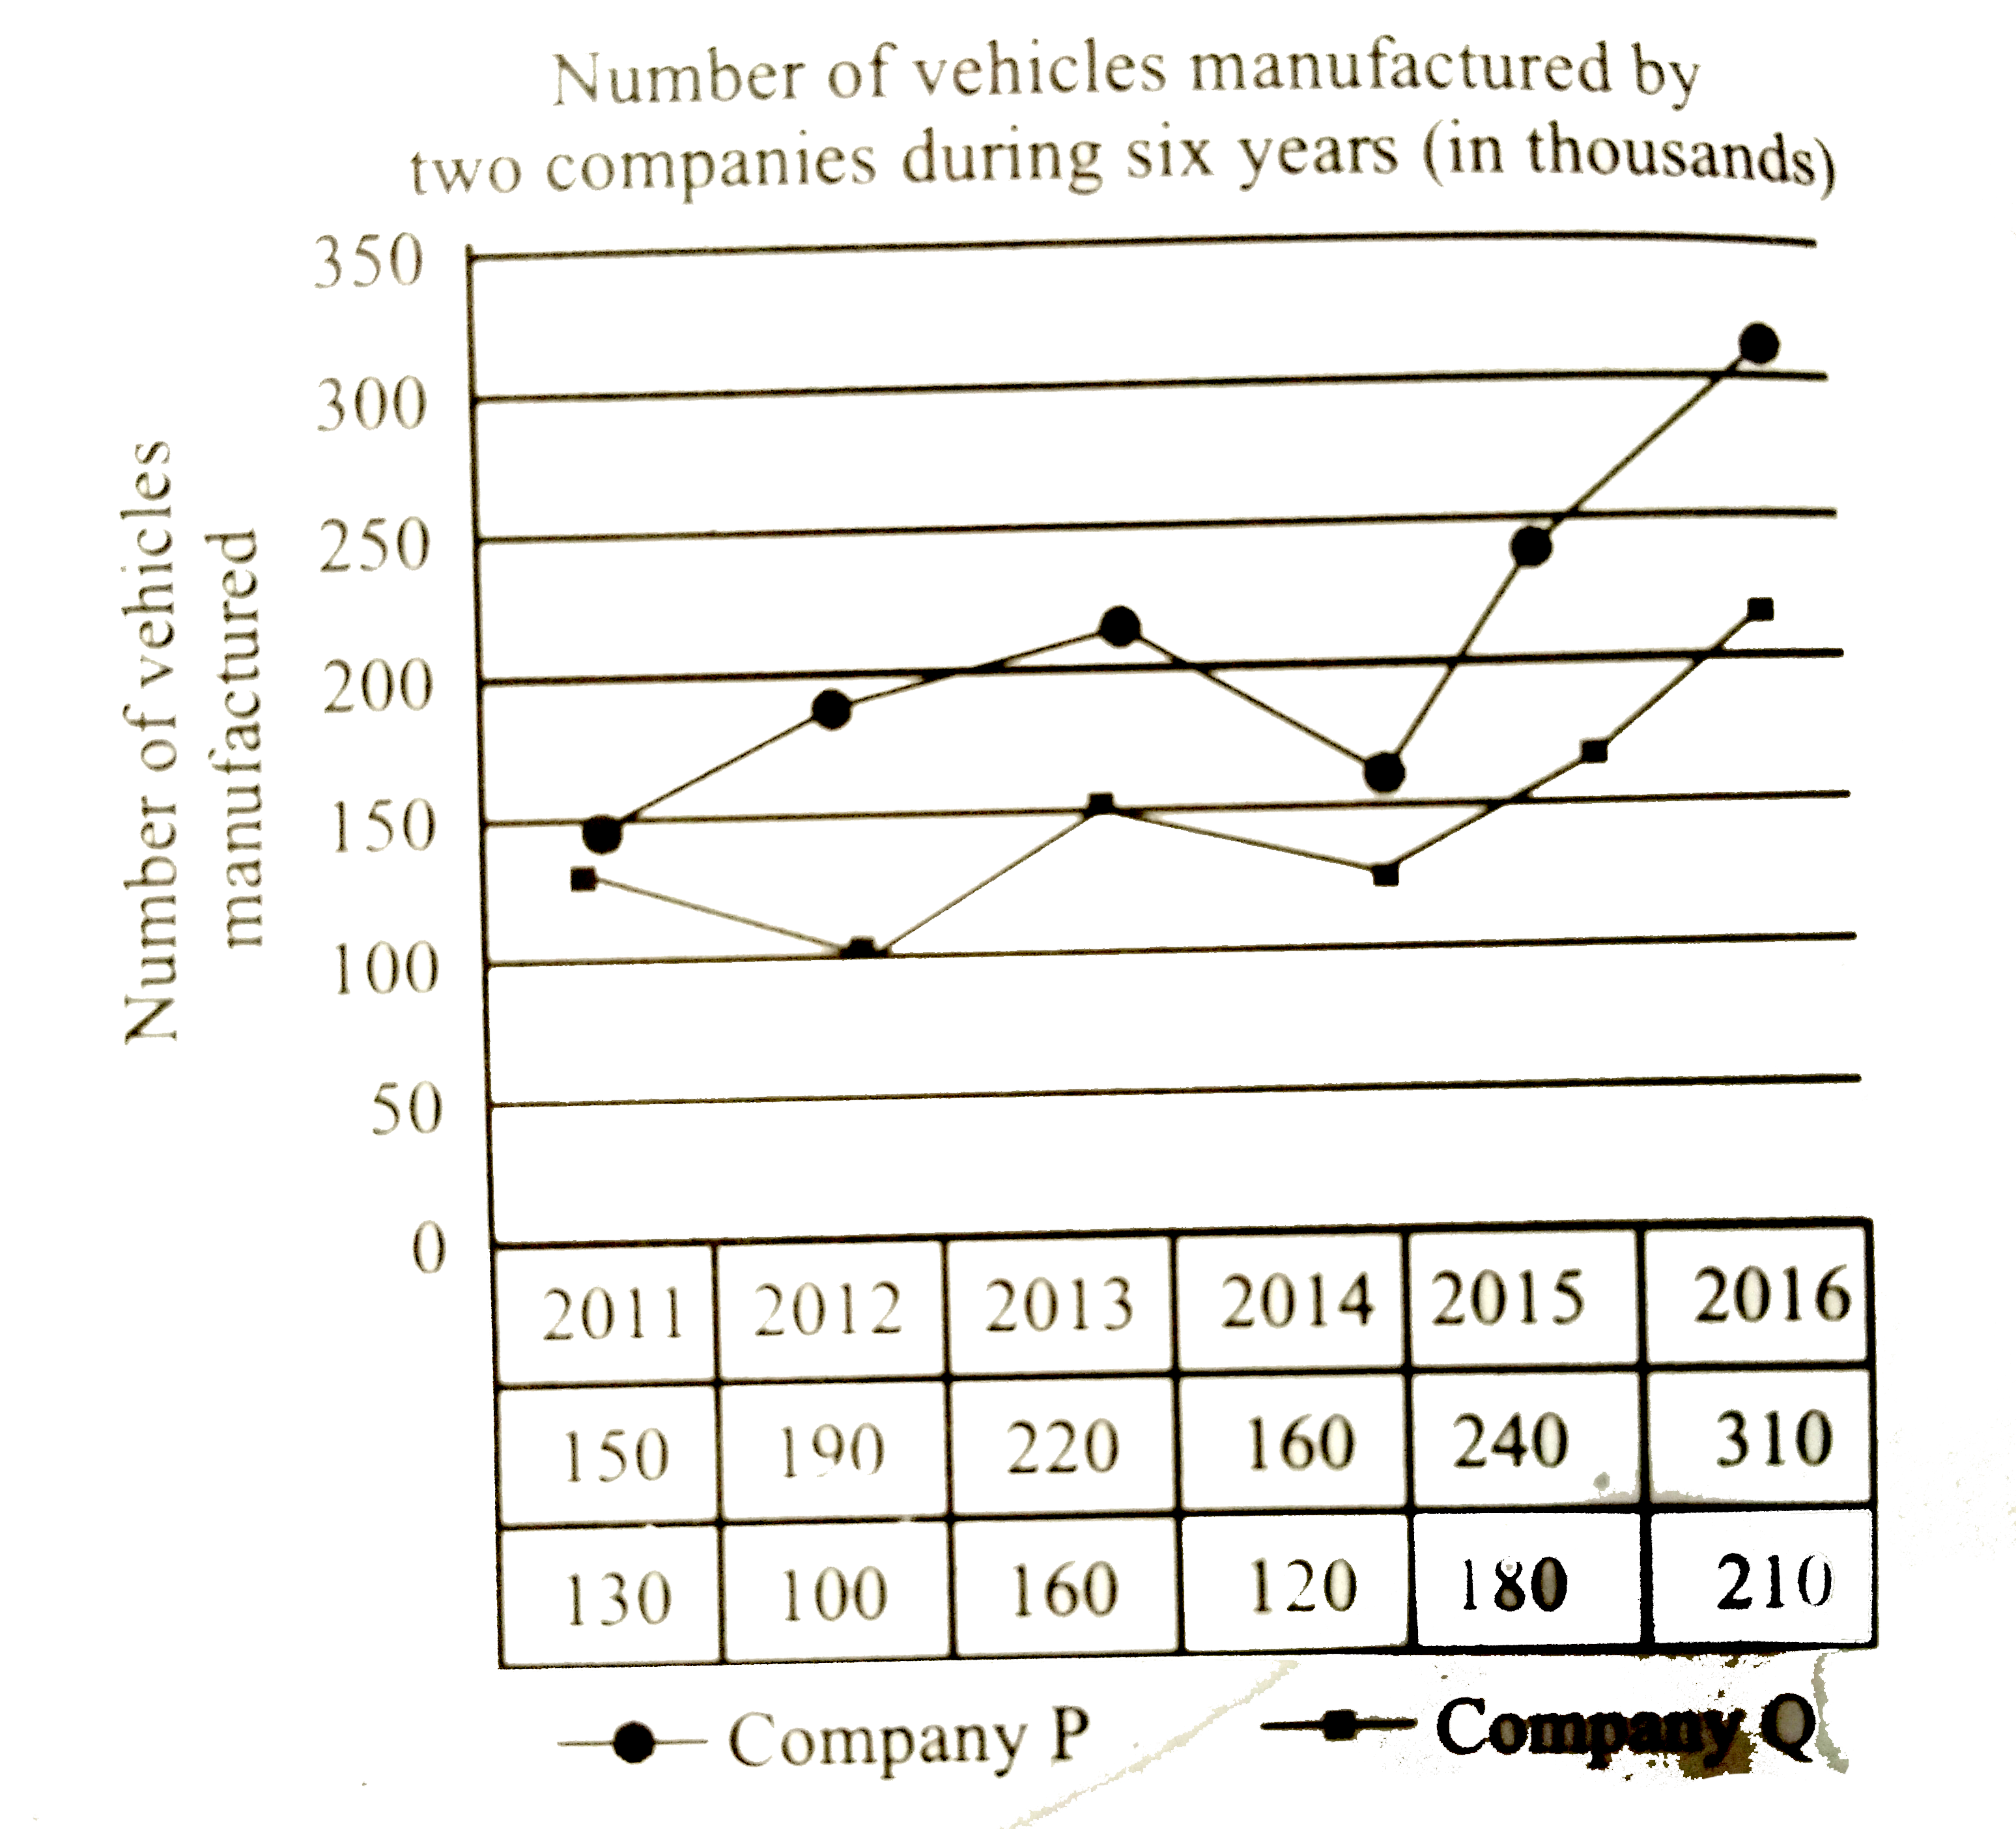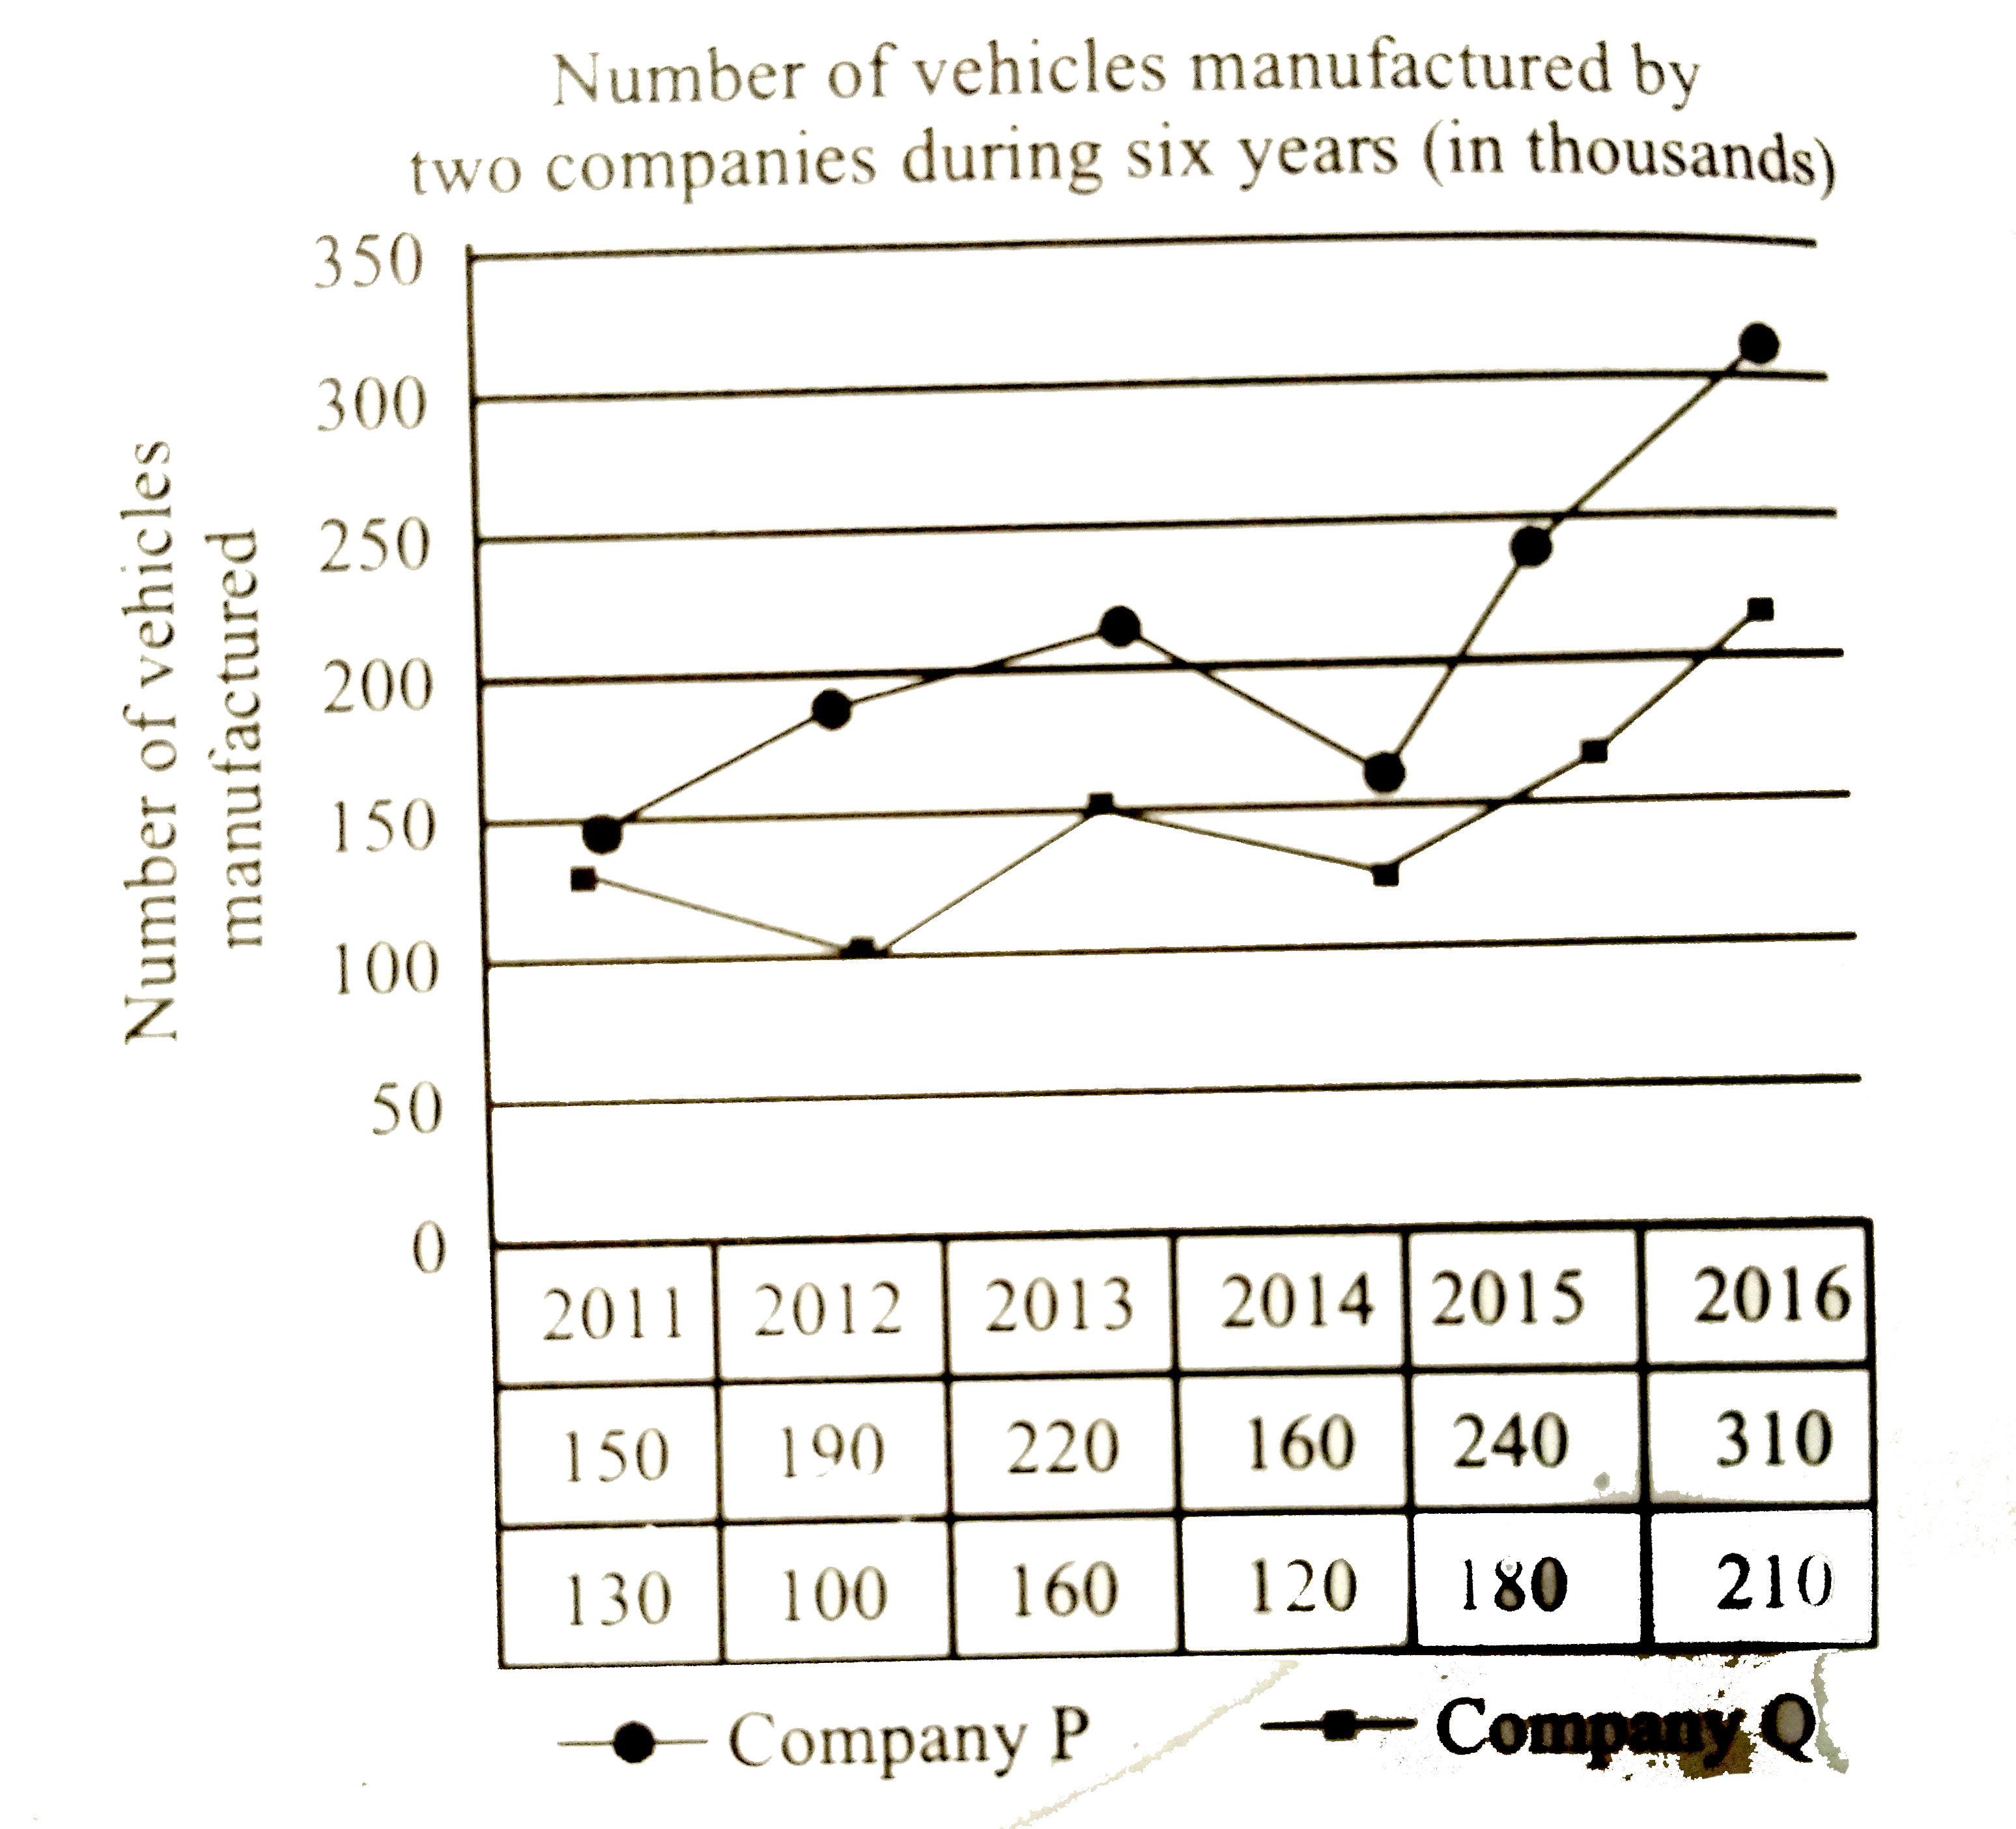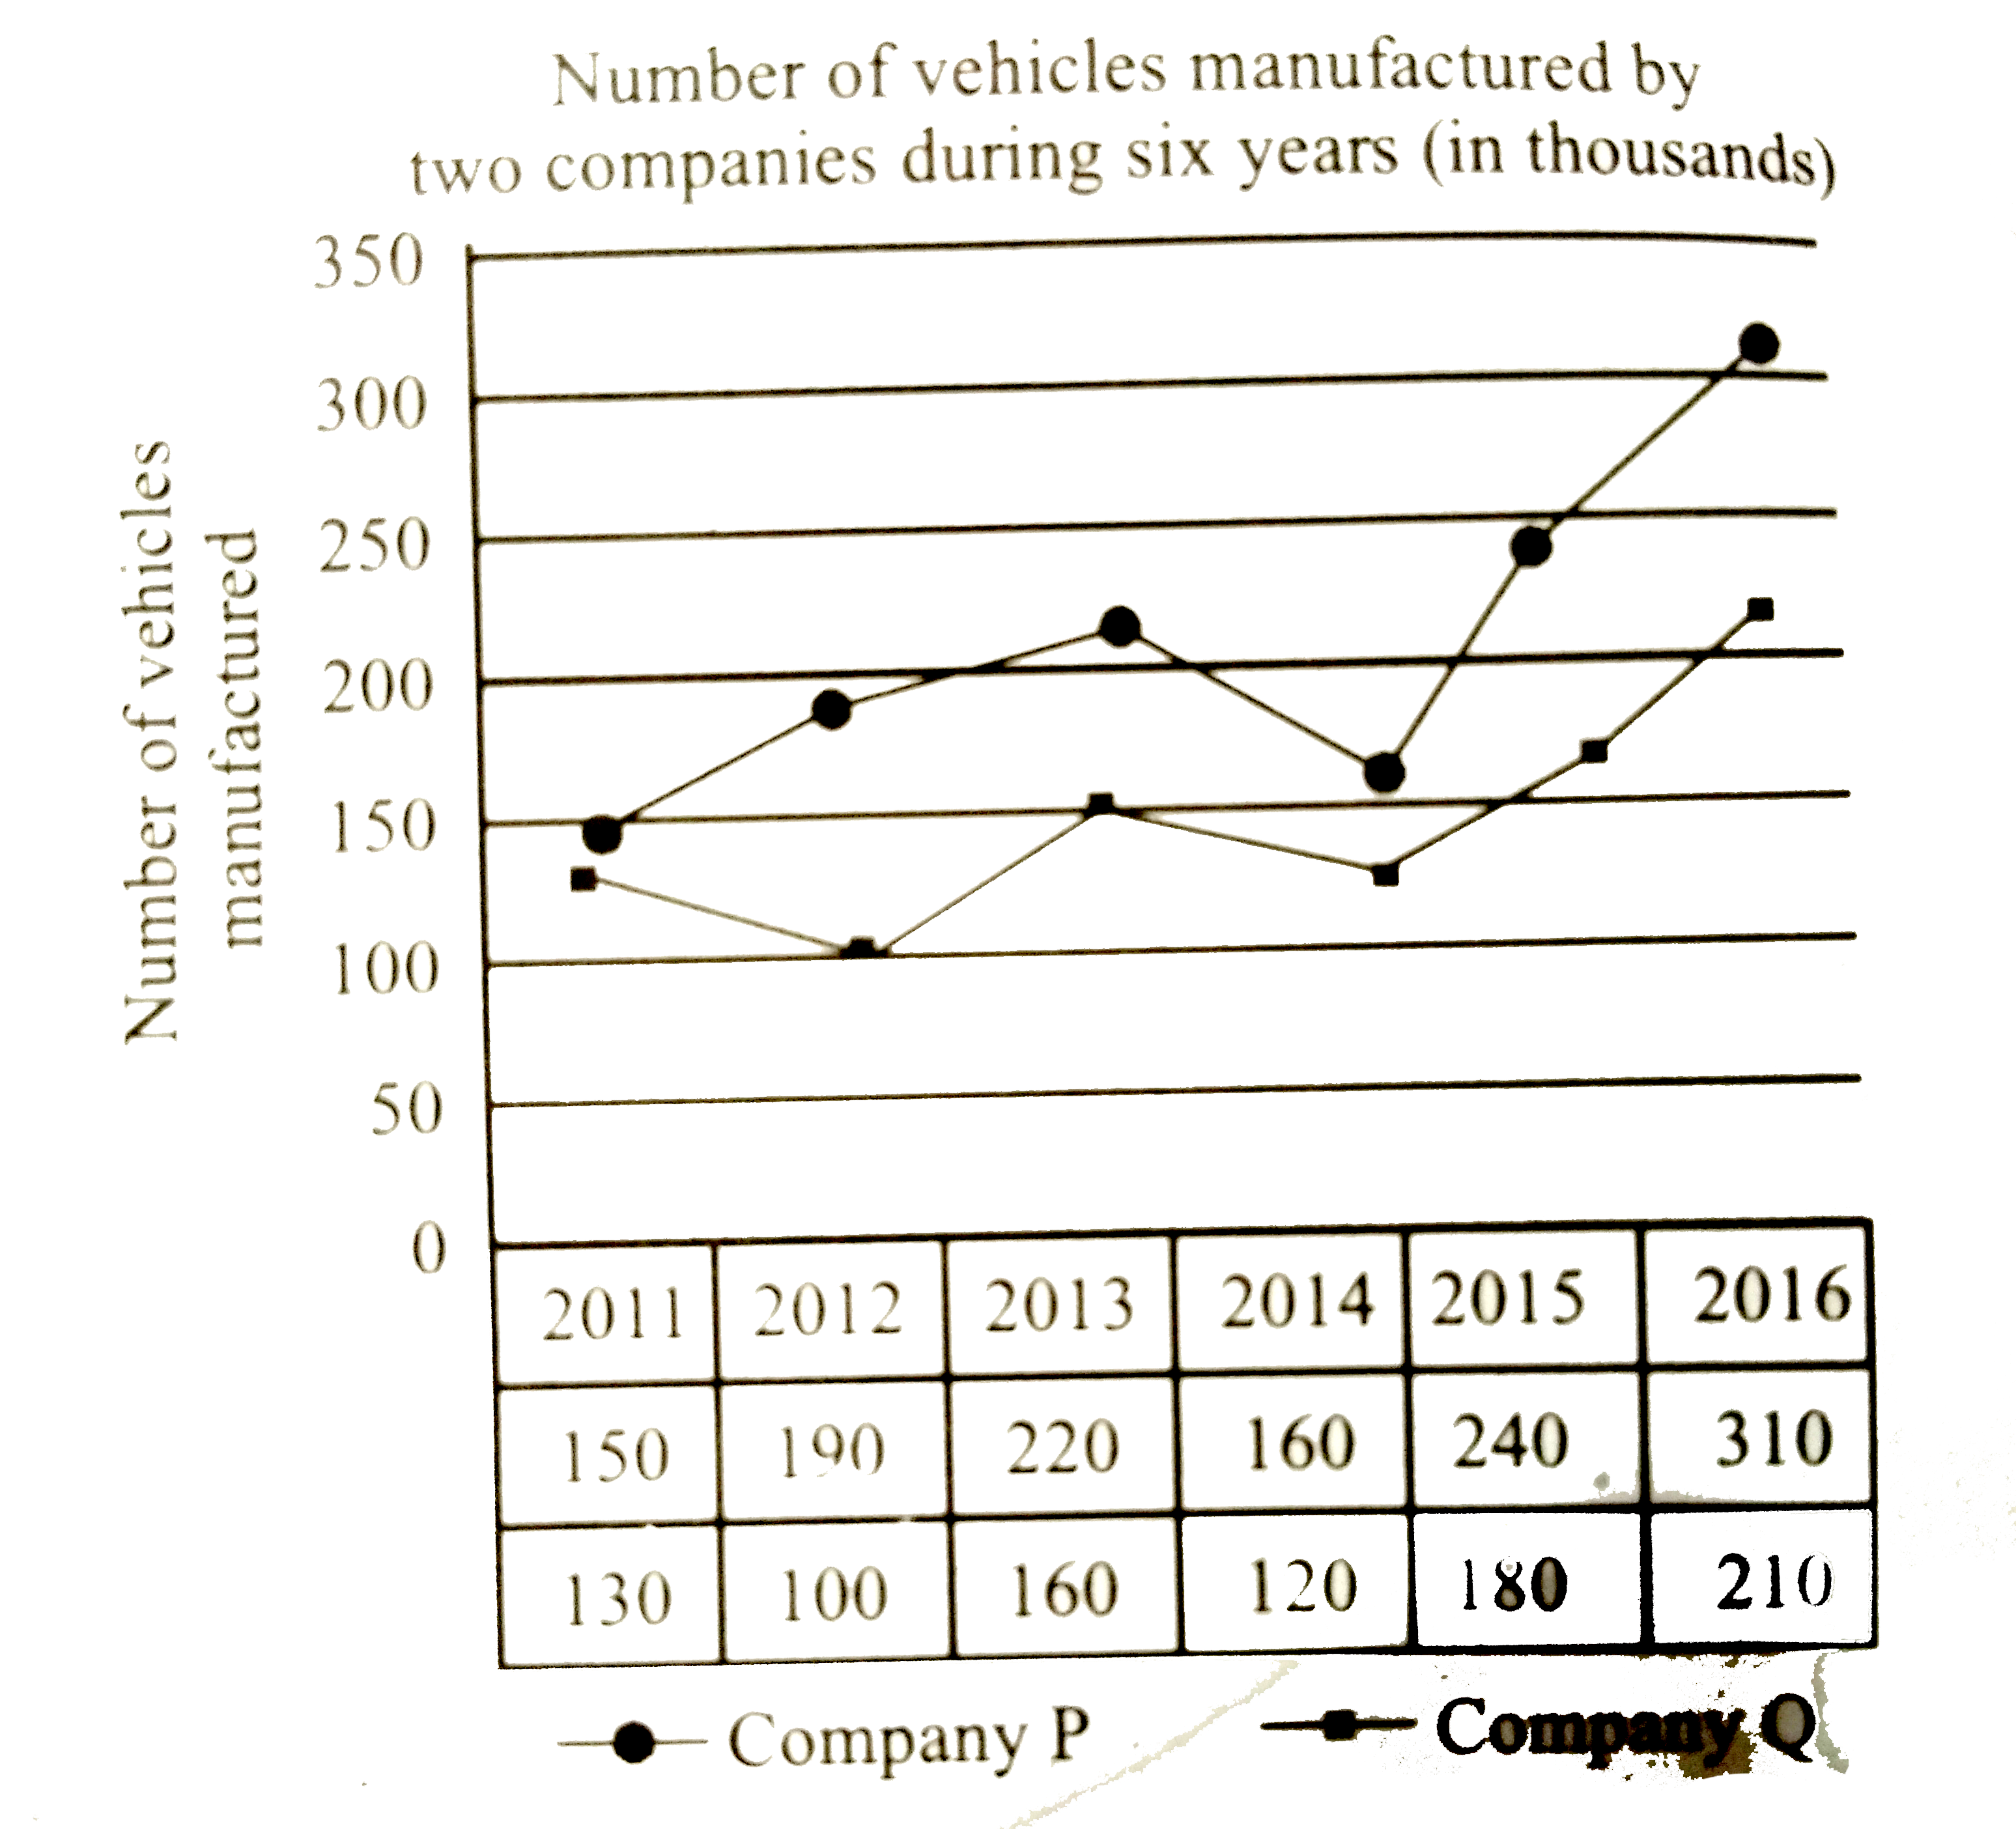
What is the percentage decrease in number of vehicles manufacture by both companies from 2013 to 2014 ?
a) 45311%
b) 33311%
c) 26619%
d) 27311%
The correct Answer is:C
Total number of vehicles in 2013=380
Total number of vehicles porduced in 2014=280
Percentage Decrease
=100380×100=50019=26619%
Topper's Solved these Questions
Similar Questions
Knowledge Check
The Table shows the Number of Laptops and Desktops manufactured by a company.

What is the average number of laptops manufactured by a company from 2008 to 2012 ?A13550B16540C14260D16140The bar chart given below shows the number of cars sold by brand A and B for the year for 2008 to 2016
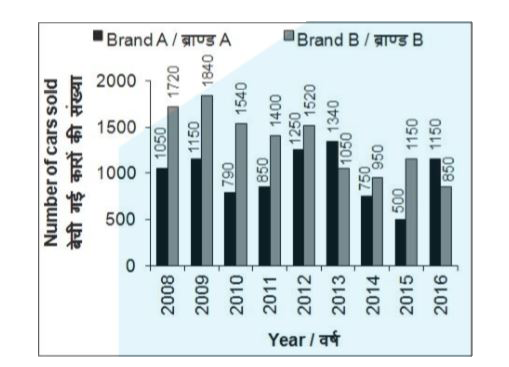
What is the percentage decrease in the number of car sold in year 2015 from year 2014 for brand A?A50B20C25D33.33The line chart given blow shows the number of cars manufactured (in 000') by company X in year 2015 from the month of July to December.
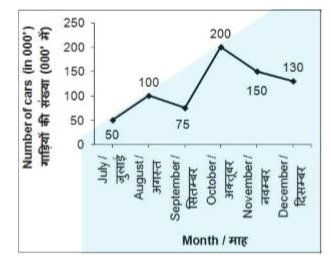
What is the percentage change in the number of cars manufactured in December to that in July?A130B80C160D140
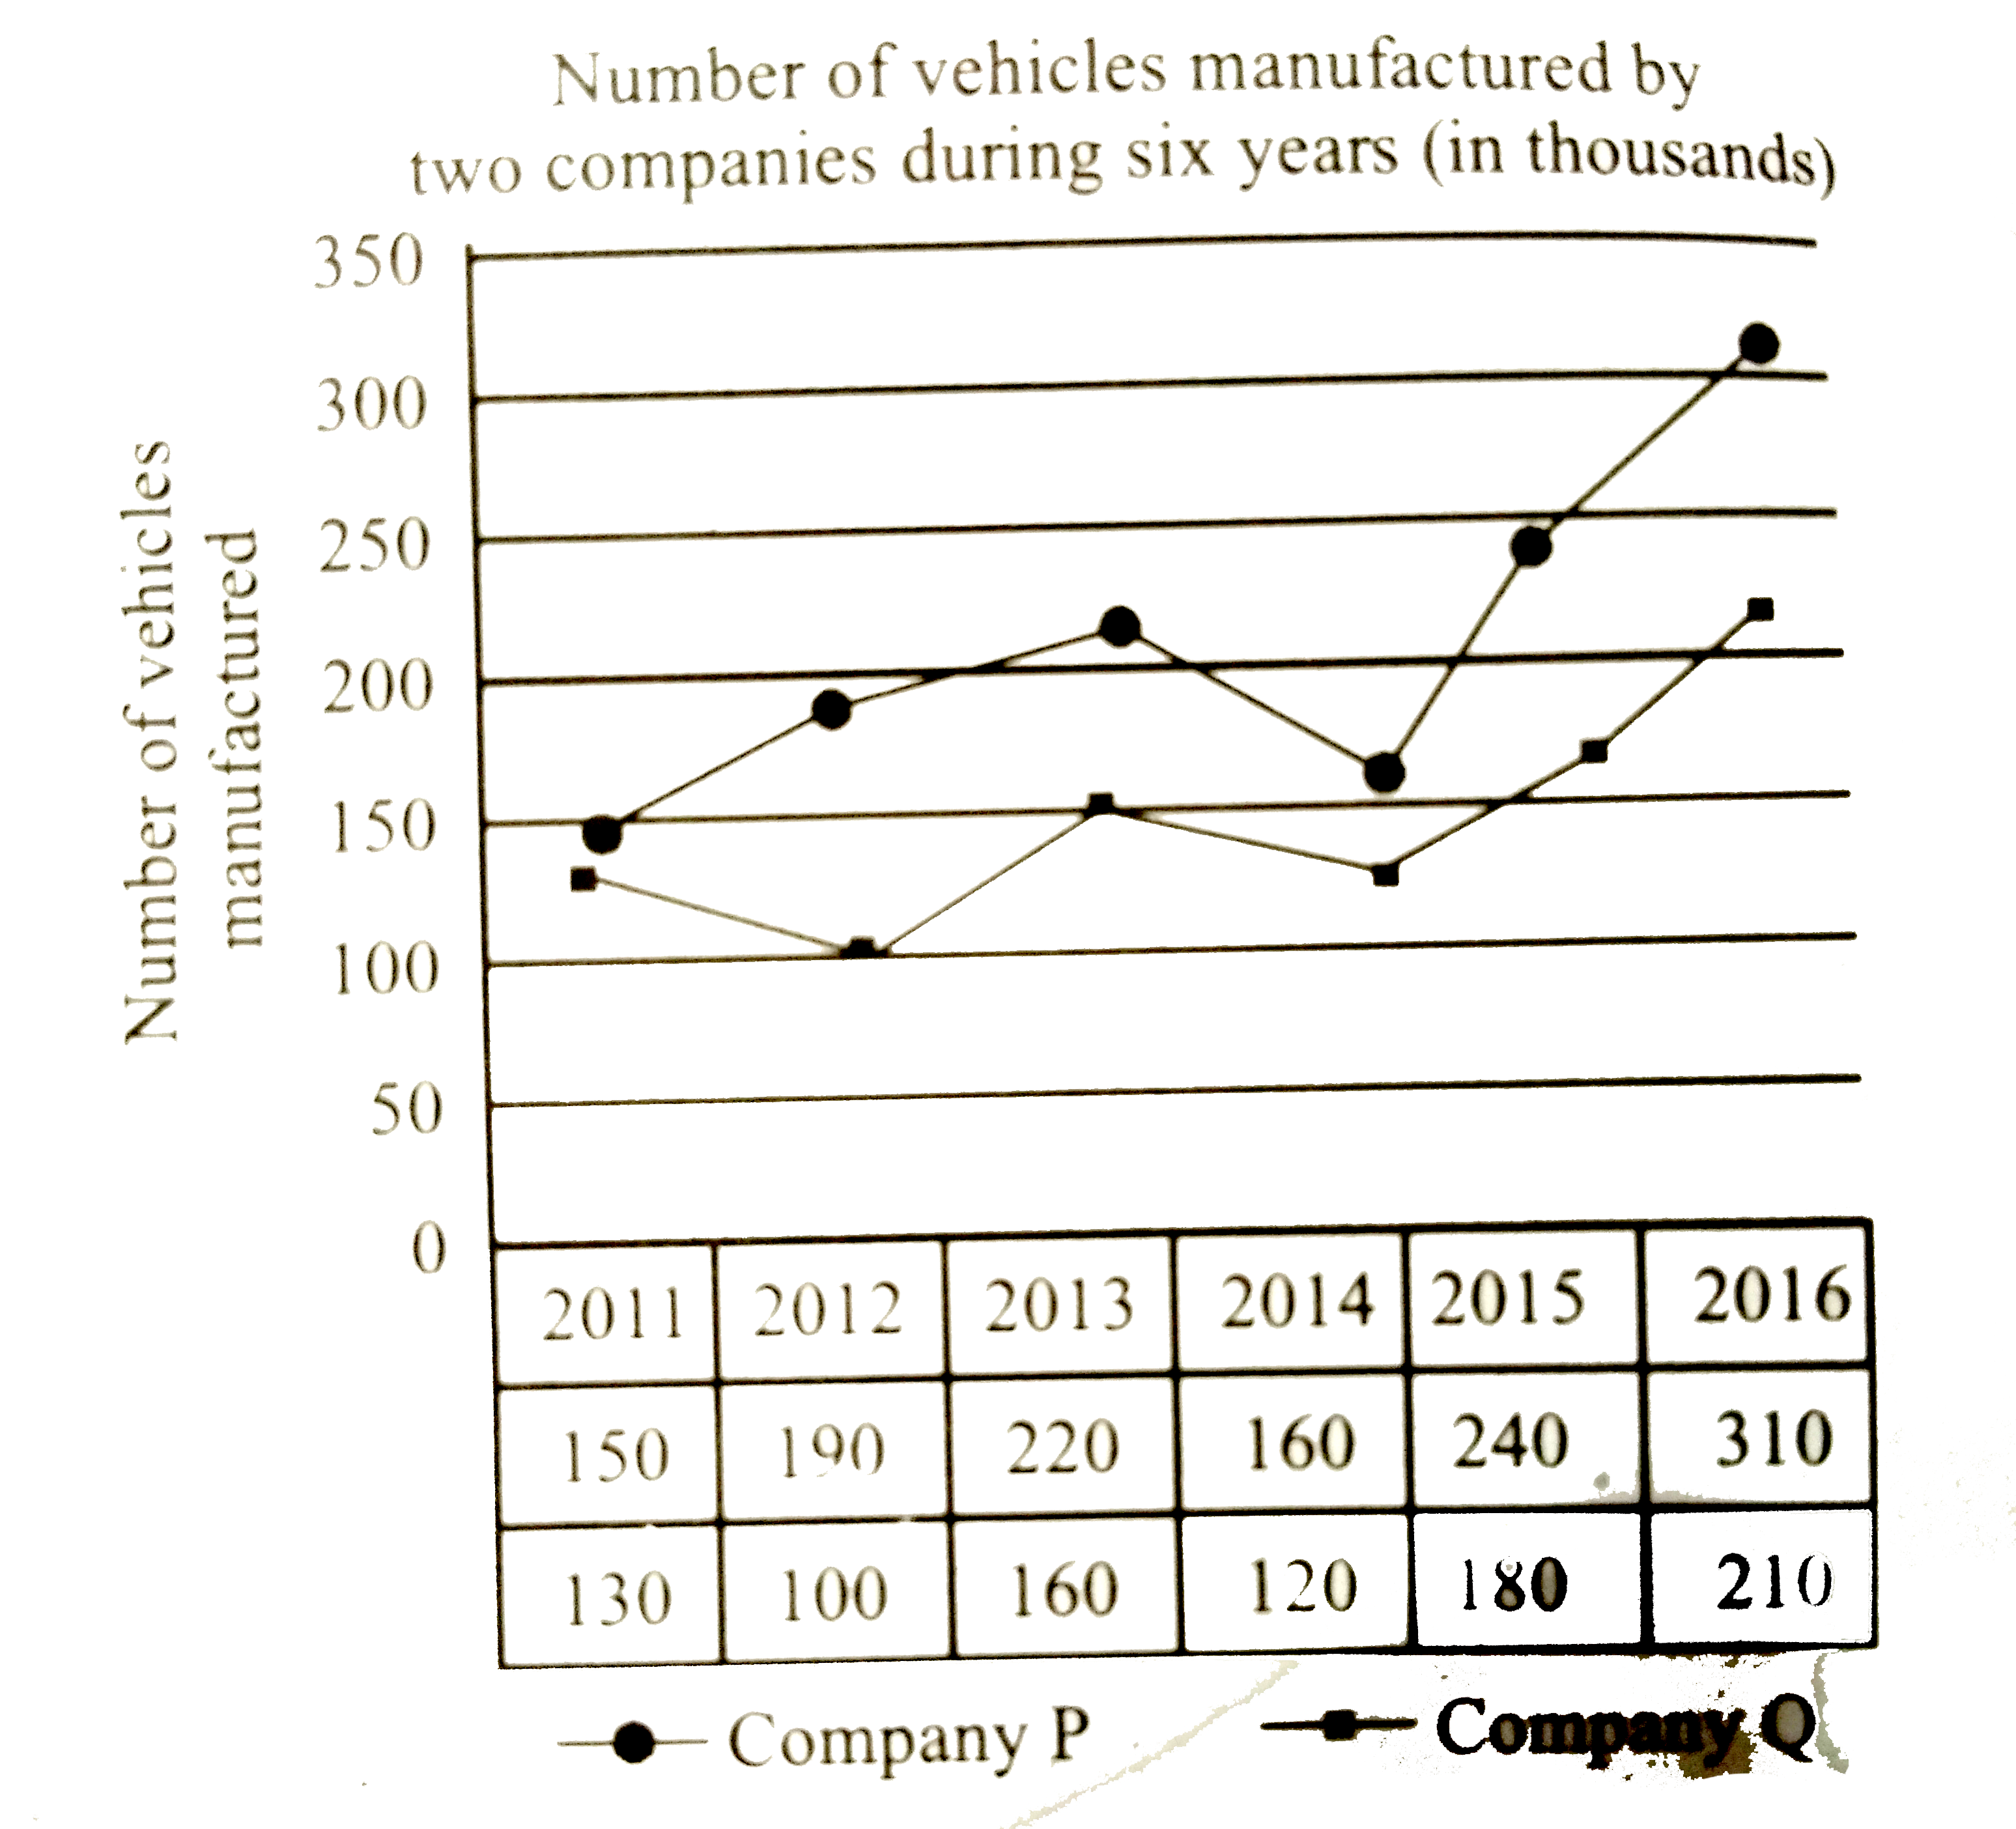
In year 2017, there was in increases of 30% in number of vehicles manufactured by company P as compared to vehicles manufactured by same company in the year 2012. What is the total number of vehicles manufactured by the same company in the year 2017 ?
View SolutionThe bar graph given below shows the data of the production of paper (in lakh tonnes) by three different companies P, Q and R over the years.
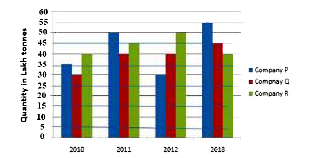
What is the percentage increase in the productionby company Q from 2010 to 2013?
View SolutionThere are two car manufacturing companies (Company X and Company Y). The sale of cars by these two different companies is given in different years.
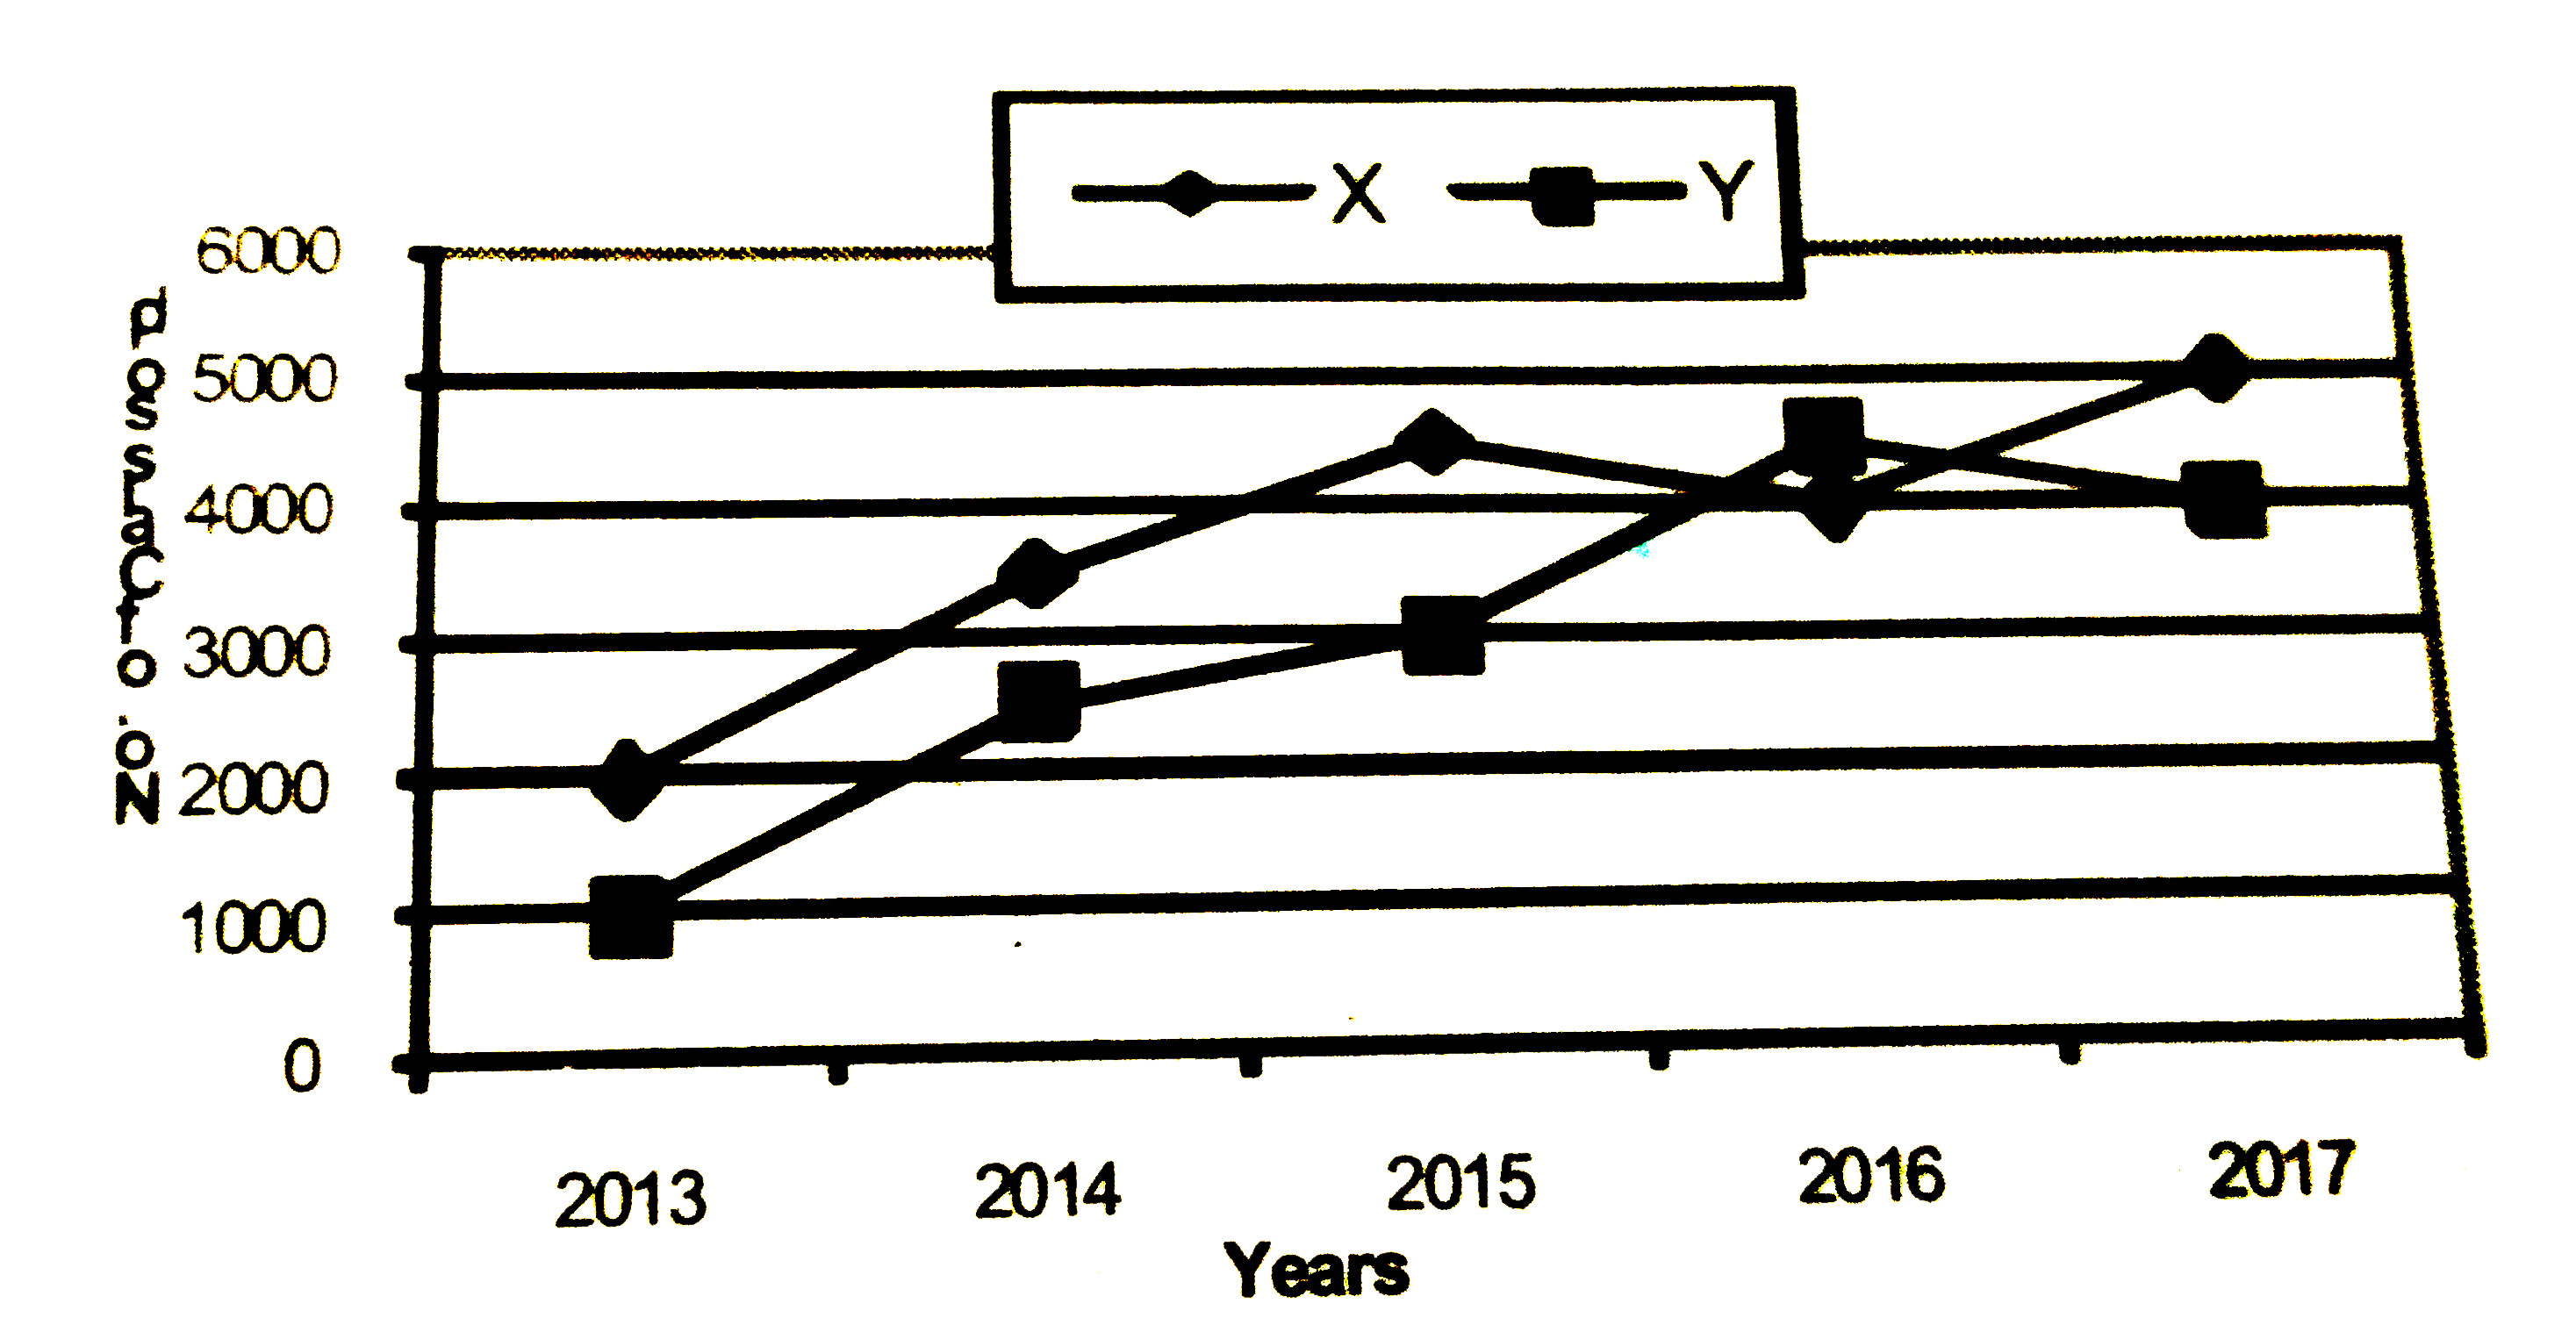
Find the total number of cars sold by both companies from year 2014 to 2016 ?
View Solution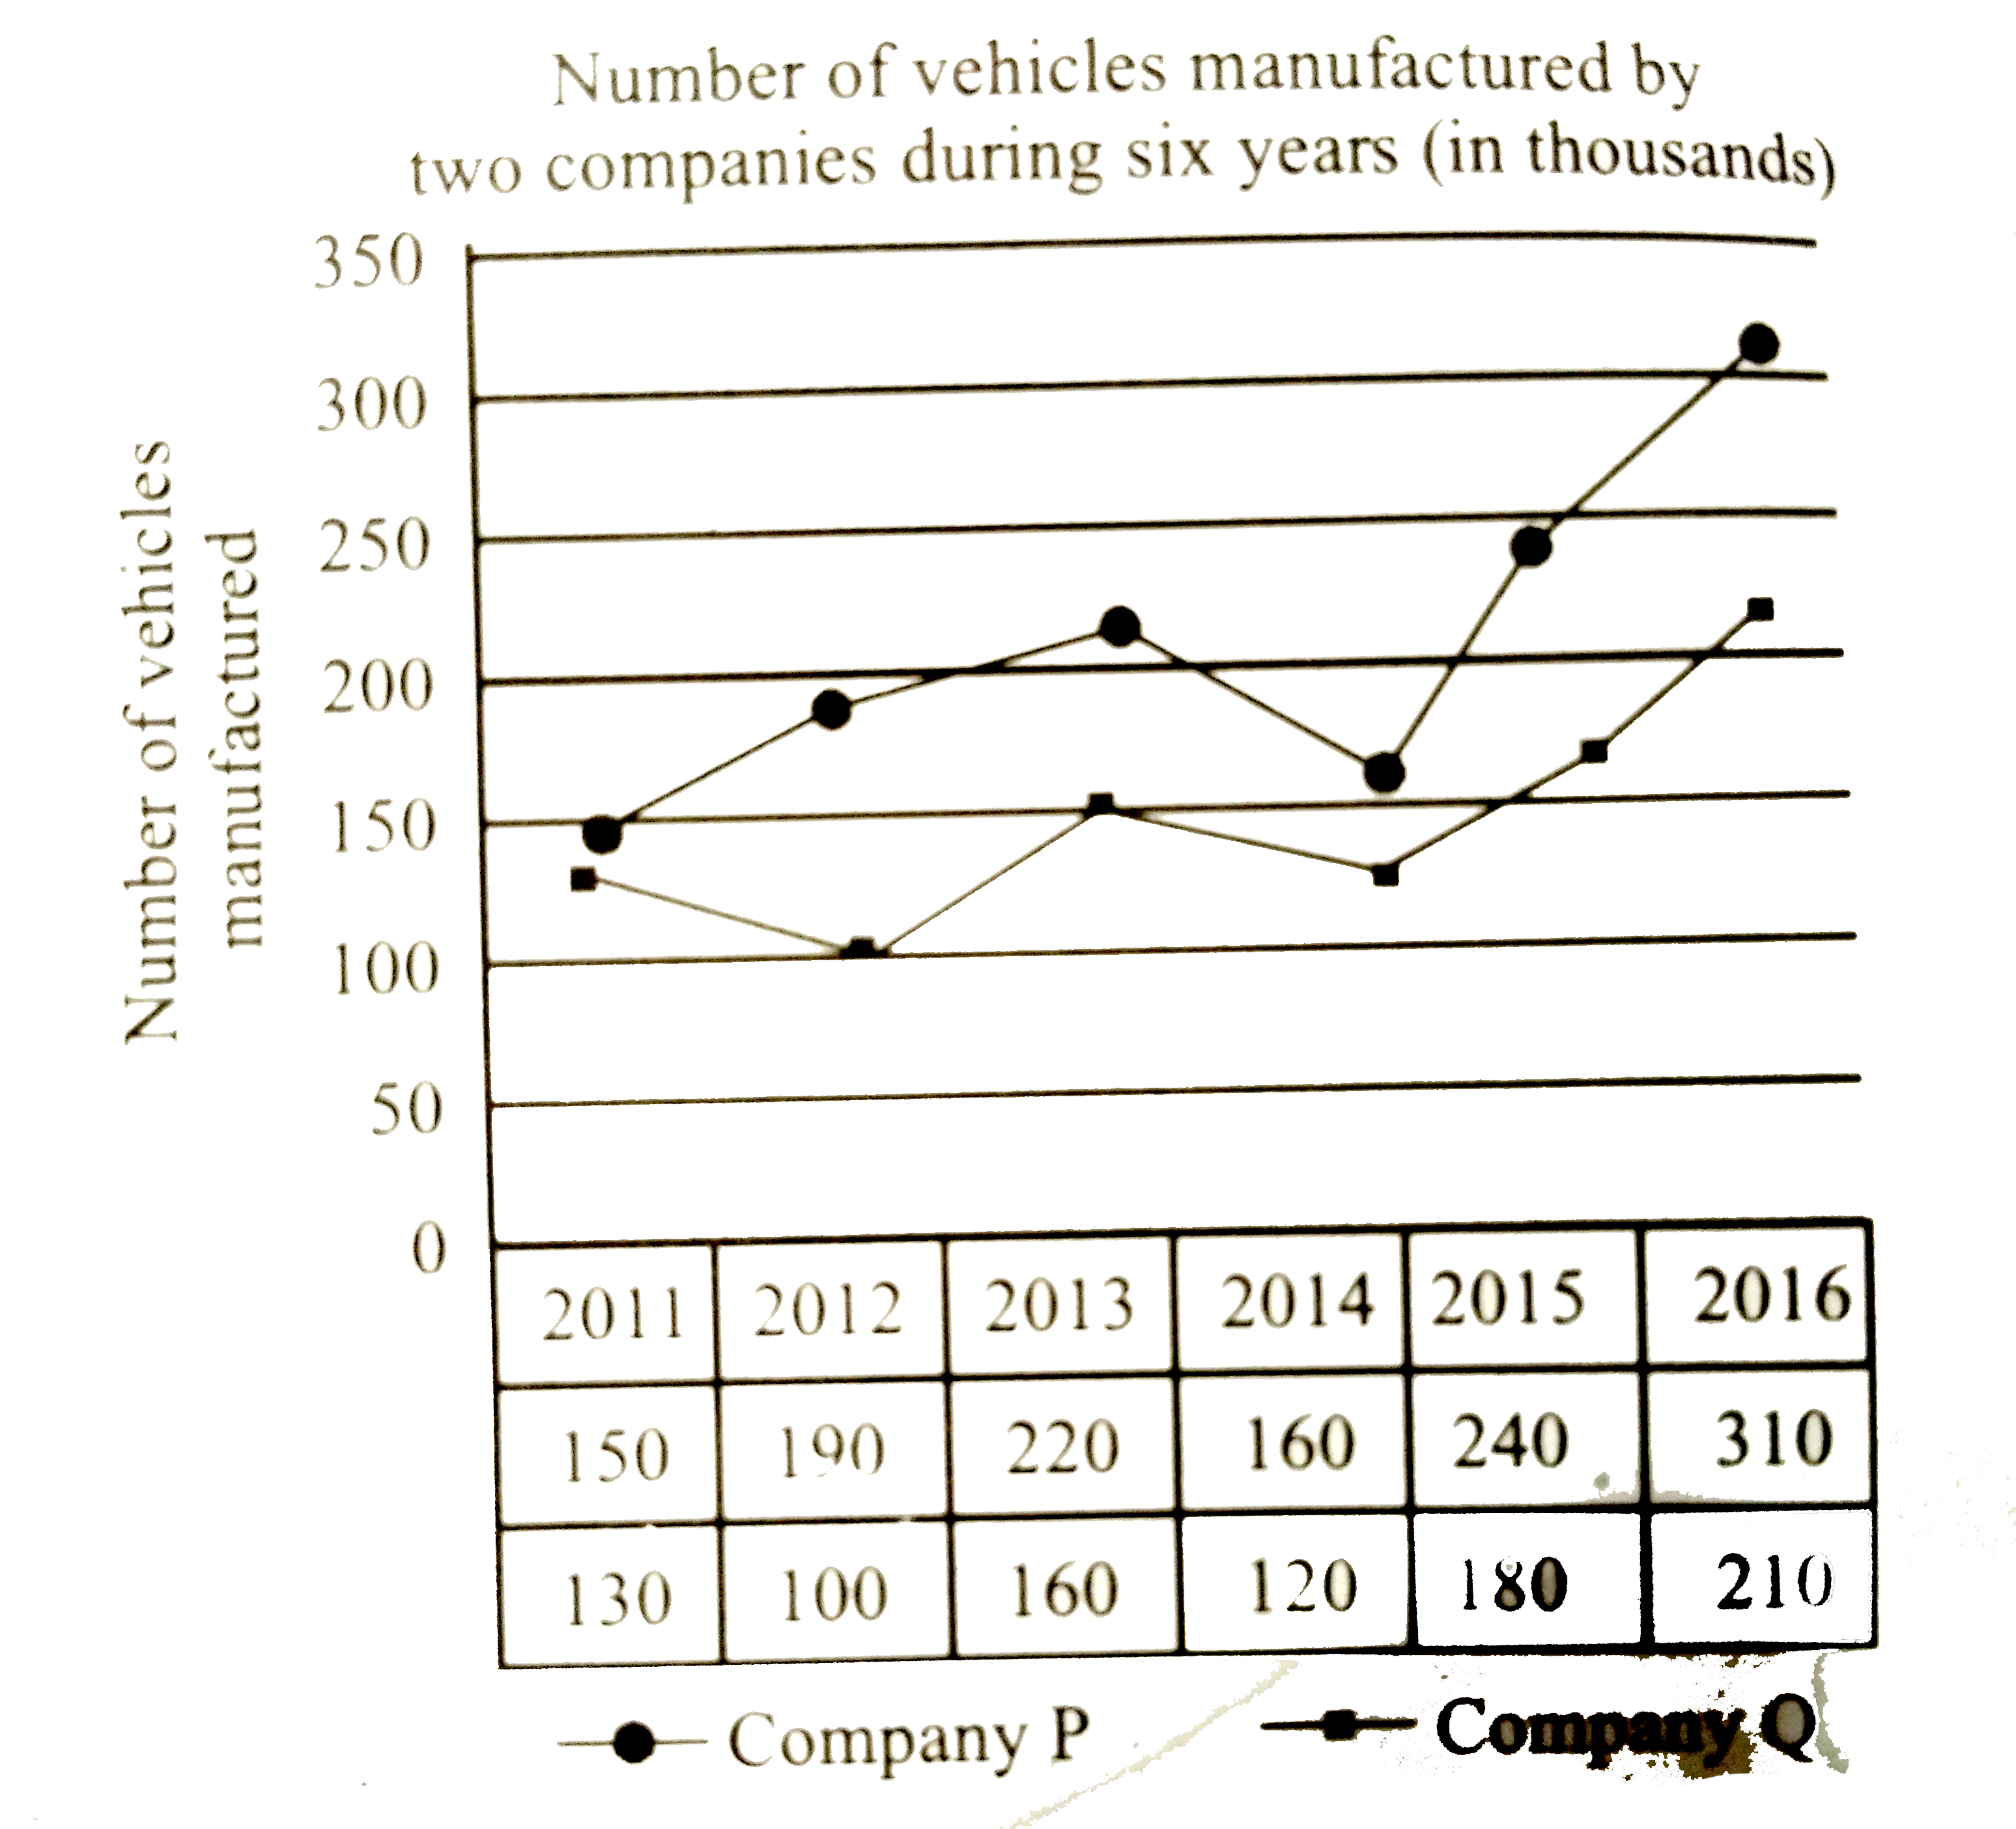
Out of the number of vehicles manufactured by company P in 2015,1500 pieces were found defective and out of the number of vehicles manufactured by company Q in 2016, 10000 pieces were found defective. Wha is the respective ratio of non-defectiv vehicles manufactured by comapny P in 2015 and Q in the 2016 ?
View SolutionThe line chart given blow shows the number of cars manufactured (in 000') by company X in year 2015 from the month of July to December.
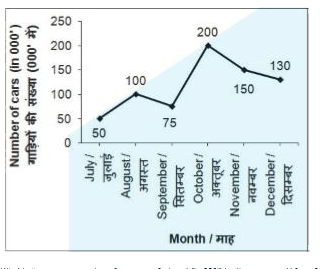
What is the average number of cars manufactured (in 000') by the company X from July to November?
View Solution

