The bar graph below shows the percentage break-up of the number of student who visited various touris spots on new Year evening.
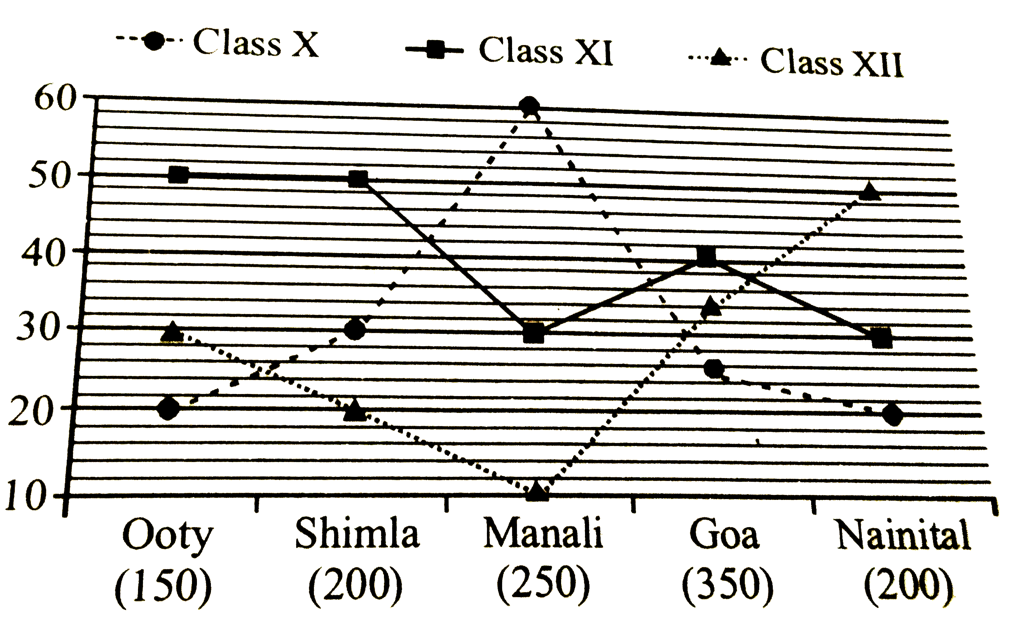
The table shows the total numbers of students om classes X,XI and XII .
Find the total number of students who didn't visite any tourist spot ?
1.52
165
105
150
The correct Answer is:D
From Class X :
Topper's Solved these Questions
Similar Questions
The bar graph below shows the percentage break-up of the number of student who visited various touris spots on new Year evening.
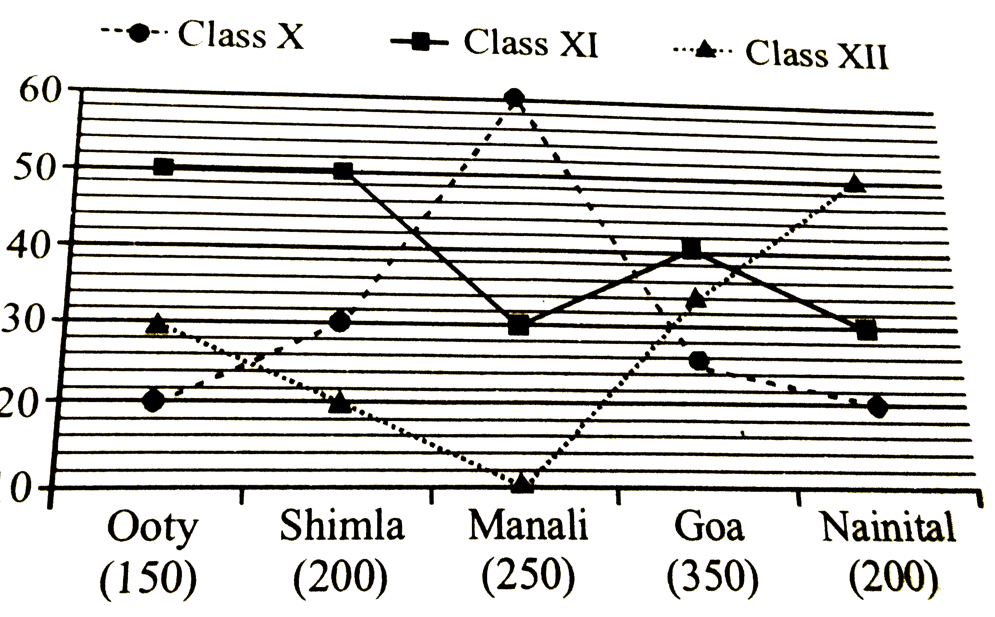
The table shows the total numbers of students om classes X,XI and XII .
ClassNo. of studentsX420XI480XII400
What is the difference between the number of students who did not got to any tourist spotfrom class XI and that from class XII ?
View SolutionThe bar graph below shows the percentage break-up of the number of student who visited various tourist spots on new Year evening.
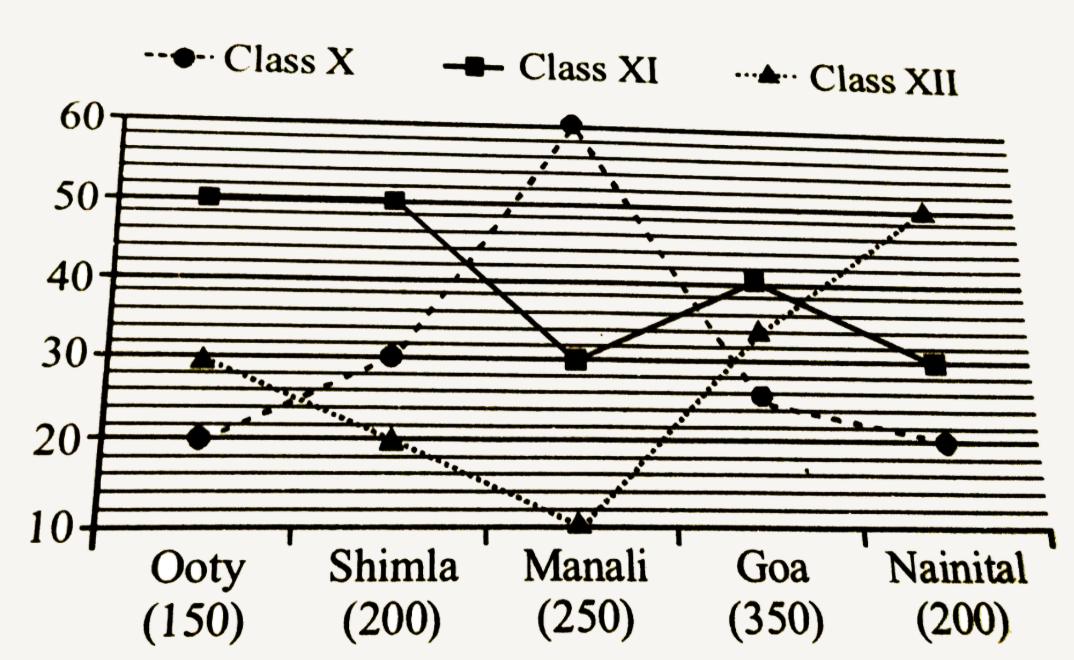
The table shows the total numbers of students om classes X,XI and XII .
ClassNo. of studentsX420XI480XII400
The number of students from class XI and XII together who visited Manali is what percent of the number of students from class X who visited Shimla, Ooty and Nainital together ? (approximate)
View Solution
Knowledge Check
The bar chart given below shows the number of students (in '00) in a schoool from year 2000 to year 2004.
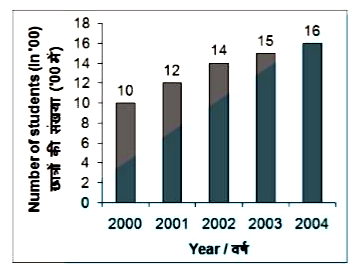
What is the total number of students in year 2002 and 2003?AA)2900BB)2700CC)3100DD)2800The pie-chart given below shows the number of students who like the five beverages Pepsi, Coke, Fanta, Frooti and Dew. The total number of students is 540.
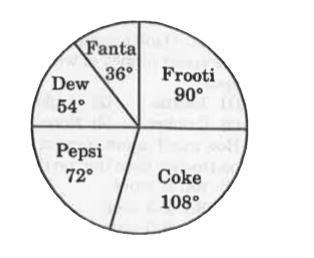
What is the total number of students who like Frooti and Pepsi?A135B108C288D243The following bar graph shows the number of students in a particular class of school. Then, answer the following questions.
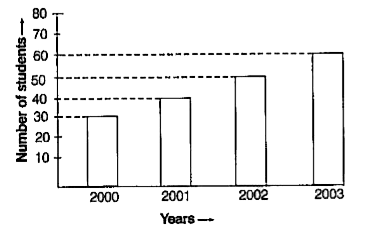
What is the number of students in the year 2003?A10B25C45D60
The bar graph below shows the percentage break-up of the number of student who visited various touris spots on new Year evening.
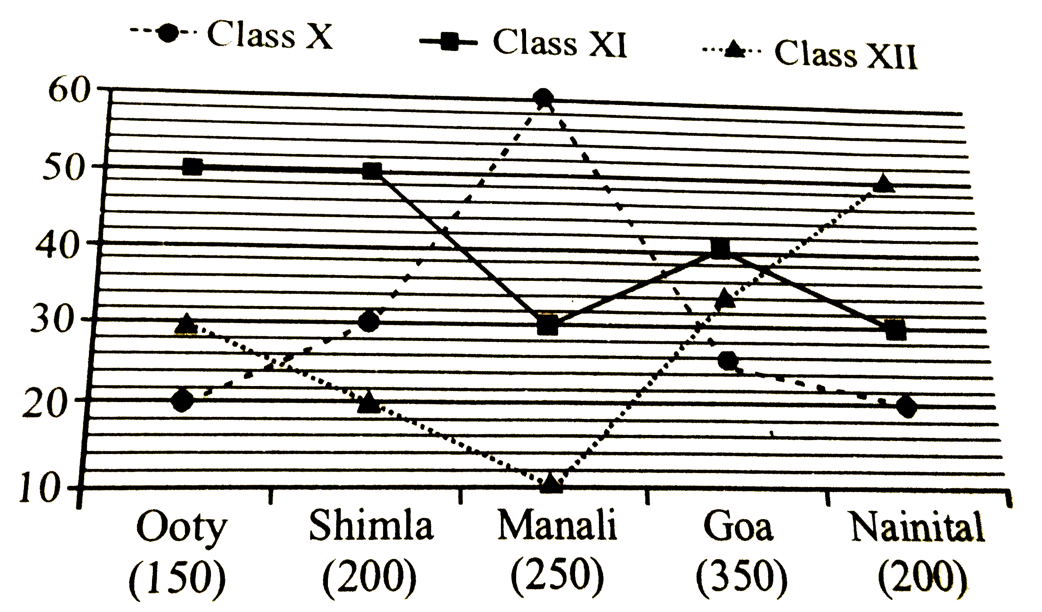
The table shows the total numbers of students om classes X,XI and XII .
ClassNo. of studentsX420XI480XII400
If the ratio of girls and boys, who went to Manali from class X, was 7:8 , then what percent of the total number of students from class X who went to a turist spot is the number of girls who went to Manali ? (approximate)
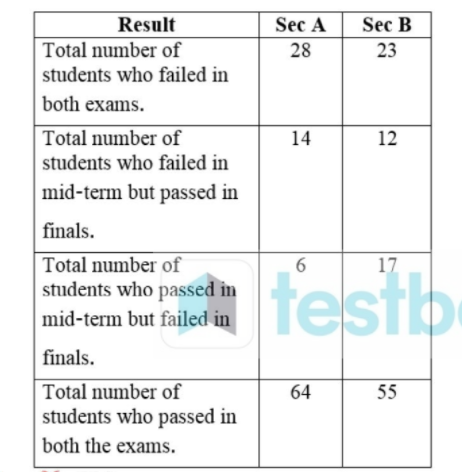
View SolutionThe below table gives the details of the number of students in Class 10, section A and B who had taken mid-term and final exam. What is the total number of students in both, section A and B?
View SolutionThe given bar graph, shows the number of students in different classes.
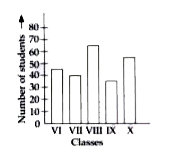
Find the total number of students in the classes VIII to X.
View SolutionThe given pie chart shows the percentage of students enrolled for the courses A, B, C, D and E in a university and the table shows the percentage of students that passed, out of the enrolled students.
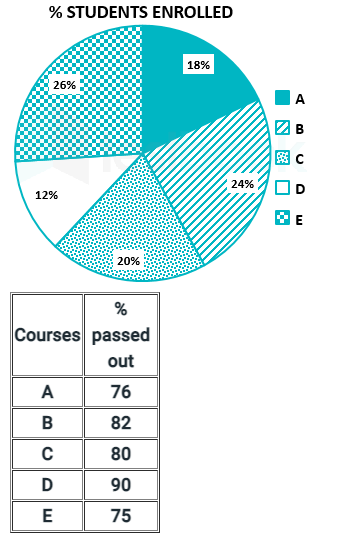
If the total number of students is 60000, then the total number of students who did not pass in the courses A, C is:
View SolutionThe following piechart shows the number of students who failed in different subjects in an examination. Examine the chart and answer the questions 5 to the total number of students who have failed is 500.

Number of students who failed in Mathema tics is less than the students who did not qualify in language is -
View Solution
