The following piechart shows the number of students who failed in different subjects in an examination. Examine the chart and answer the questions 5 to the total number of students who have failed is 500.

Number of students who failed in Mathema tics is less than the students who did not qualify in language is -
40
30
50
20
The correct Answer is:B
Step by step video & image solution for The following piechart shows the number of students who failed in different subjects in an examination. Examine the chart and answer the questions 5 to the total number of students who have failed is 500. Number of students who failed in Mathema tics is less than the students who did not qualify in language is - by Maths experts to help you in doubts & scoring excellent marks in Class 14 exams.
Updated on:21/07/2023Topper's Solved these Questions
Similar Questions
The following piechart shows the number of students who failed in different subjects in an examination. Examine the chart and answer the questions 5 to the total number of students who have failed is 500.
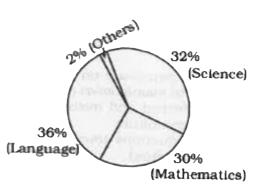
Total number of students who did not qualify in Mathematics or Language or Science, is
View SolutionThe following pie-chart shows the number of students who failed in different subjects in an examination. Examine the chart and answer the following questions. The total number of students who have failed is 500.
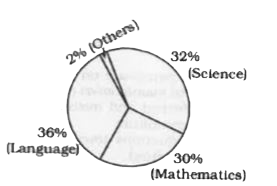
The number of students failed in science is less than the number of students failed in all other subjects by :
View Solution
Knowledge Check
Study the given histogram that shows the marks obtained by students in an examination and answer the question that follows .
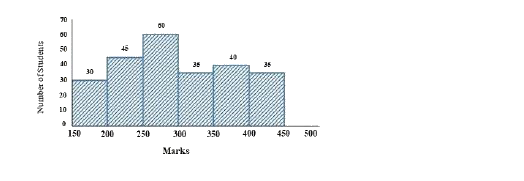
The number of students who obtained less than 250 marks is :A135B75C30D45In each of the following questions, the following histogram shows the relationship between the marks obtained by the students and the number of students in an examination. Study the histogram and answer the questions.
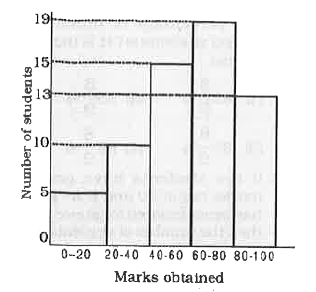
The ratio of the number of students who obtained 60 or more marks to that of students who obtained 60 or less marks isA15:16B15:19C14:17D16:15
Direction :- The following pie-chart shows the number of students who failed in different subjects in an examination. Examine the chart and answer the following questions. The total number of students who have failed is 500.
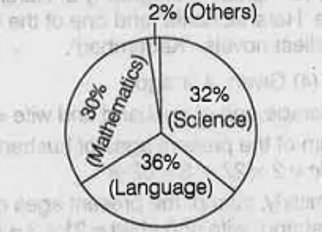
The number of students failed in Science is less than the number of student failed in all other subects by
View SolutionThe following pie-chart shows the number of students who failed in different subjects in an examination. Examine the chart and answer the following questions. The total number of students who have failed is 500.

The central angle of the sector for the students who have failed in mathematics is :
View Solution100 students appeared in annual exami-nation. 60 students passed. The ratio of the number of students who failed to the total number of students is
View SolutionFind the error in the given sentence I am sorry for the students who failed in the examination .
View Solution1700 students took an exam 85% students passsed it. Find the number of students who failed in the exam.
View SolutionThe pie chart given below show the number of students who like the five beverages Pepsi, coke Fanta , Frooti and Dew . The total number of students is 540 .
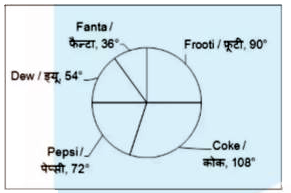
What is the average number of students who likes Coke and Pepsi?
View Solution