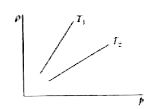
Identify the graph which correctly represents the spectral intensity versus wavelength graph at two temperatures T and T (T≤T)
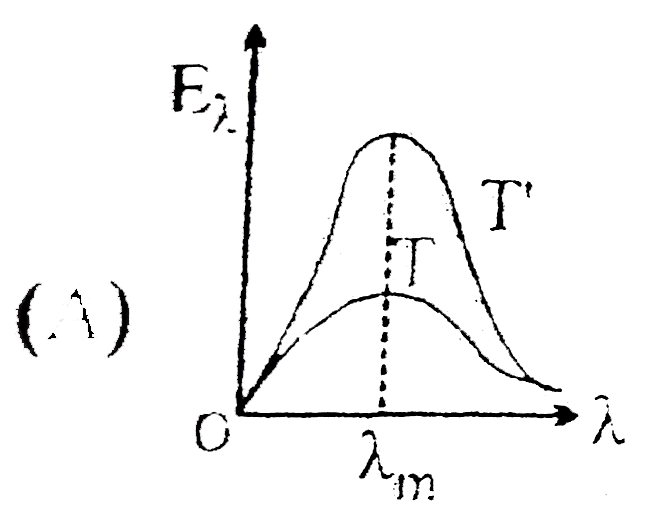
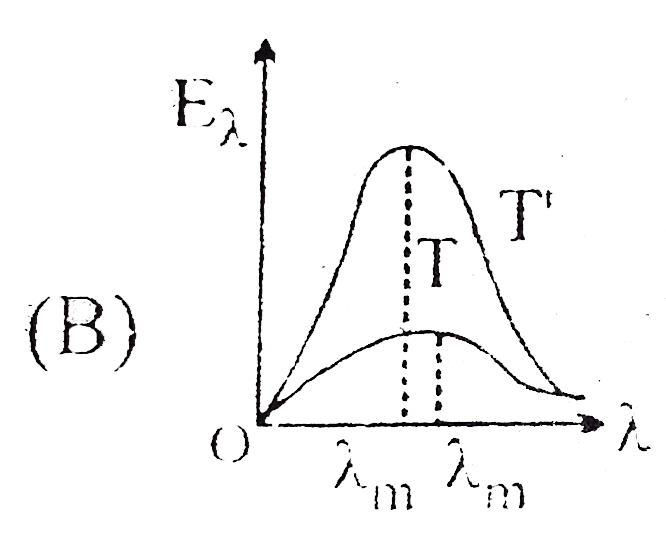
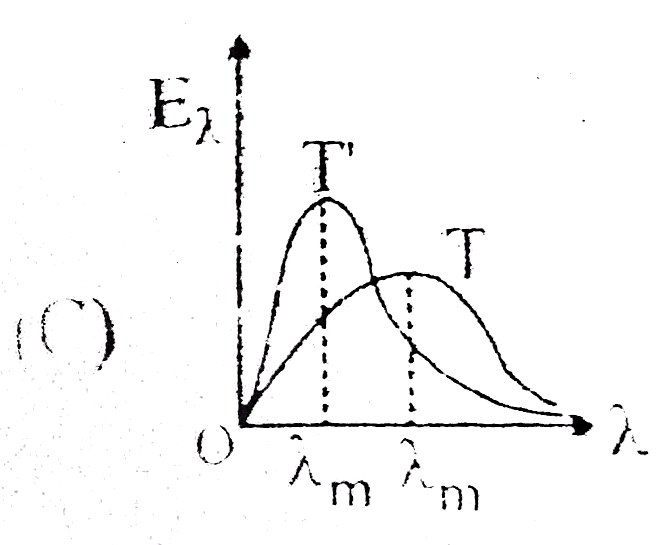
none of these
The correct Answer is:B
As timeperature increases spectral intensity corresponding to all wavelengths increases but the wavelength with maximum spectral intensity decreases according to wein displacement law
Topper's Solved these Questions
- BOOK - BANSALCHAPTER - MASTER PRACTICE PROBLEMEXERCISE - Comphrehension134videos
MASTER PRACTICE PROBLEM
- BOOK - BANSALCHAPTER - MASTER PRACTICE PROBLEMEXERCISE - Reasoning75videos
MASTER PRACTICE PROBLEM
- BOOK - BANSALCHAPTER - FLUID MECHANICSEXERCISE - PYQS AIEEE10videos
FLUID MECHANICS
- BOOK - BANSALCHAPTER - SEMICONDUCTORSEXERCISE - CBSE Question32videos
SEMICONDUCTORS
Similar Questions
Knowledge Check
- Question 1 - Select One
Identify the graph which correctly represent the Moseley's law-
A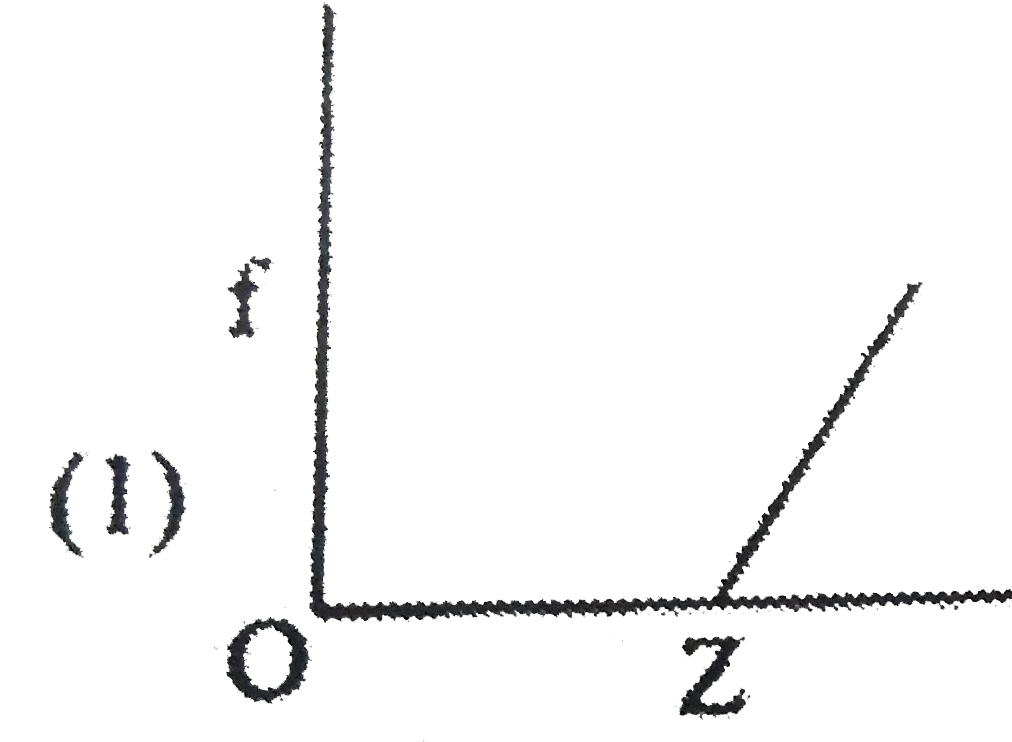 B
B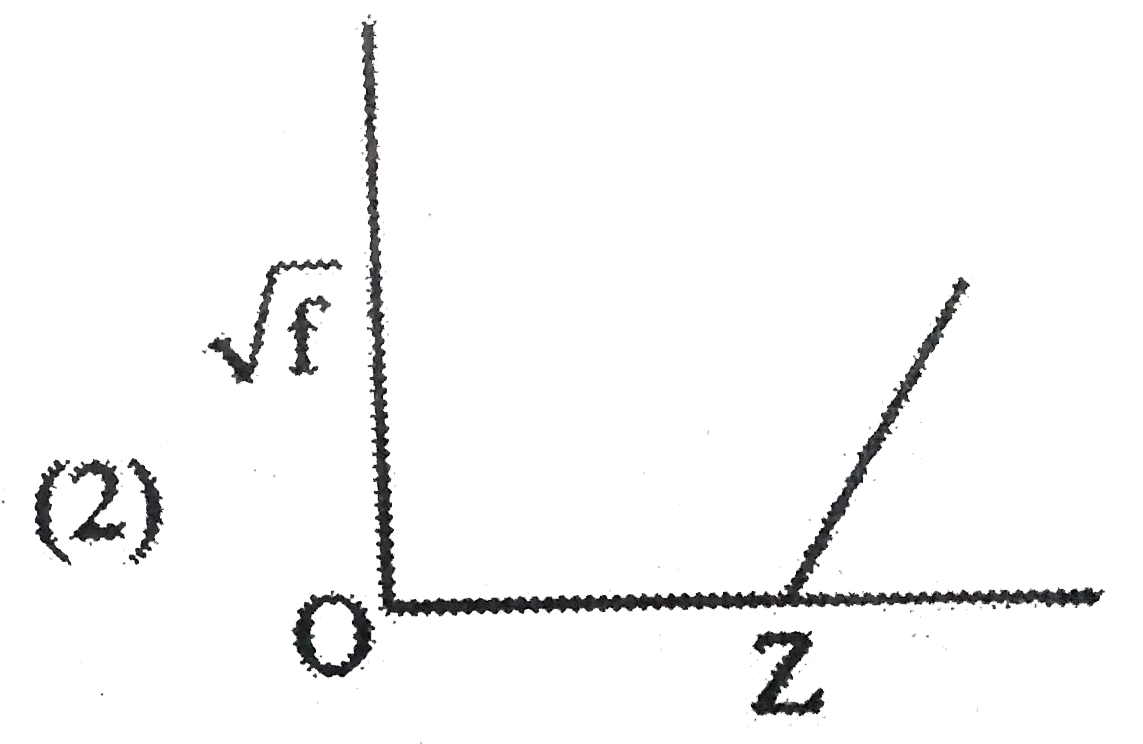 C
C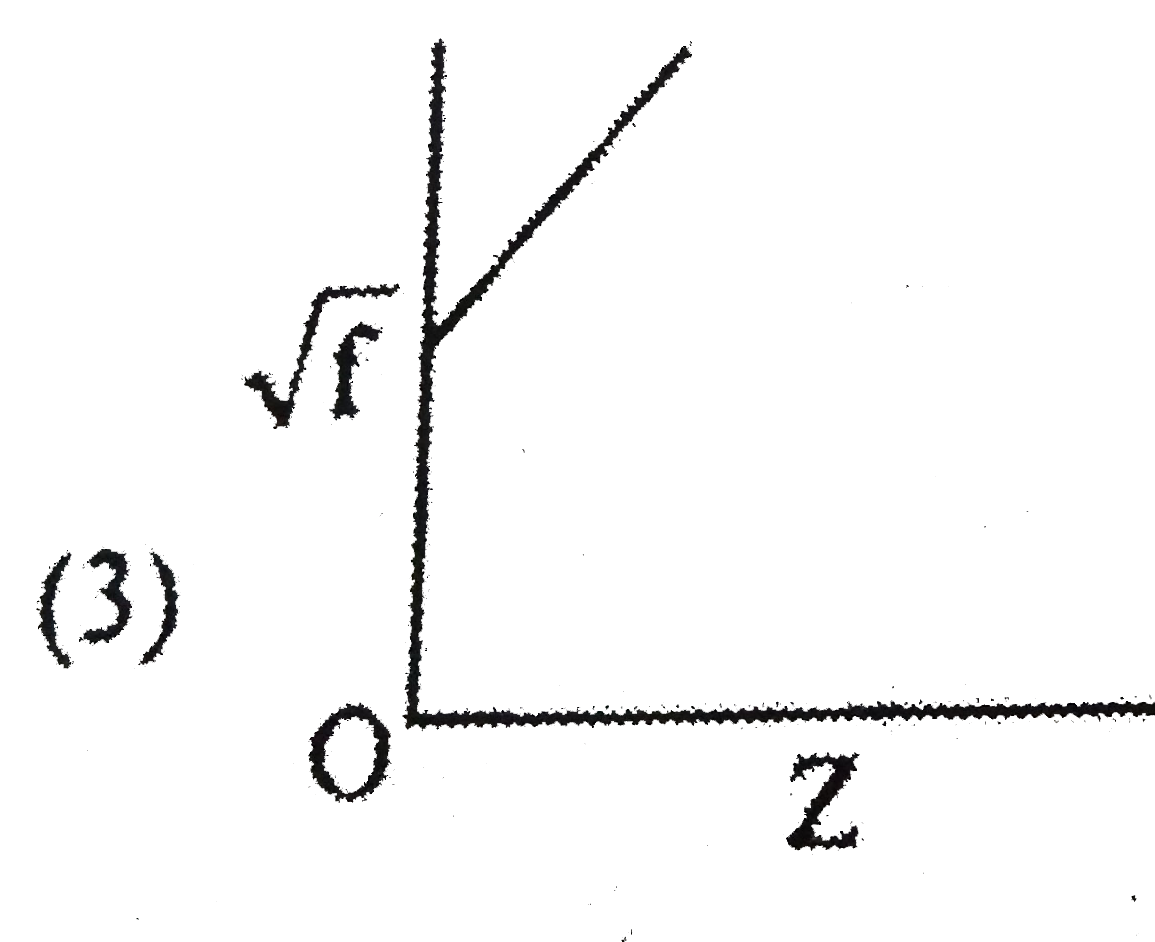 D
D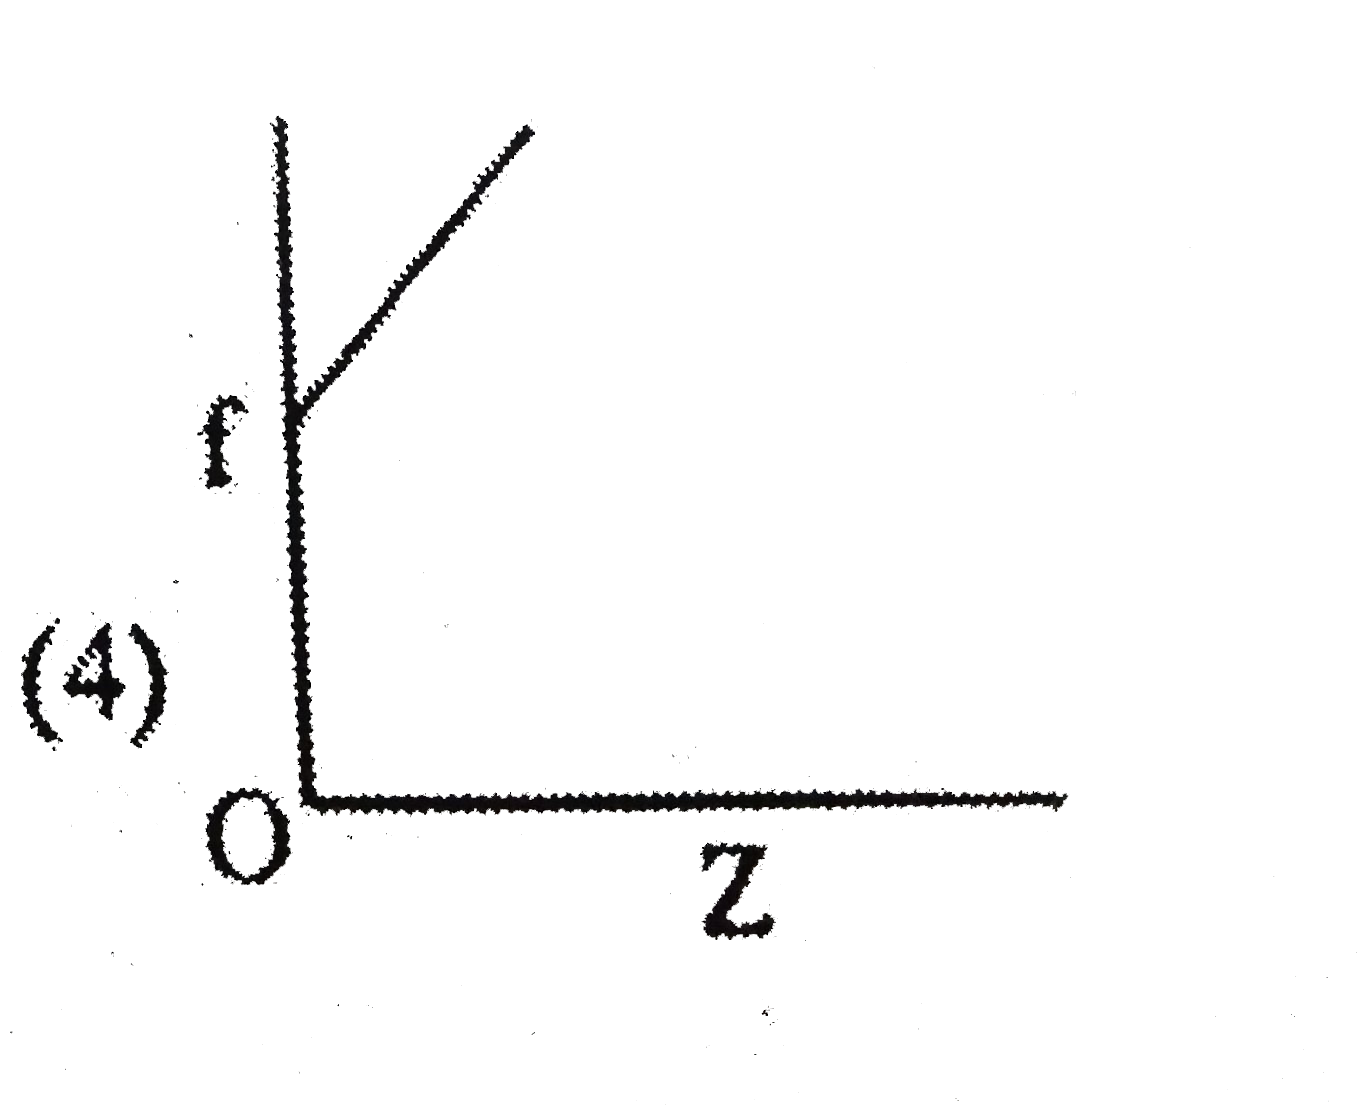
- Question 2 - Select One
Which graph correctly represents variation between relaxation time (t) of gas molecules with absolute temperature of gas T.
A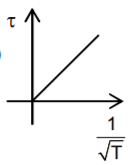 B
B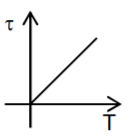 C
C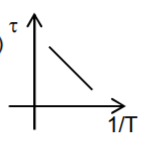 D
D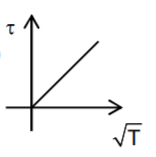
- Question 3 - Select One
Figure shows graphs of pressure versus density for an ideal gas at two temperatures T1 and T2 Which is correct ?
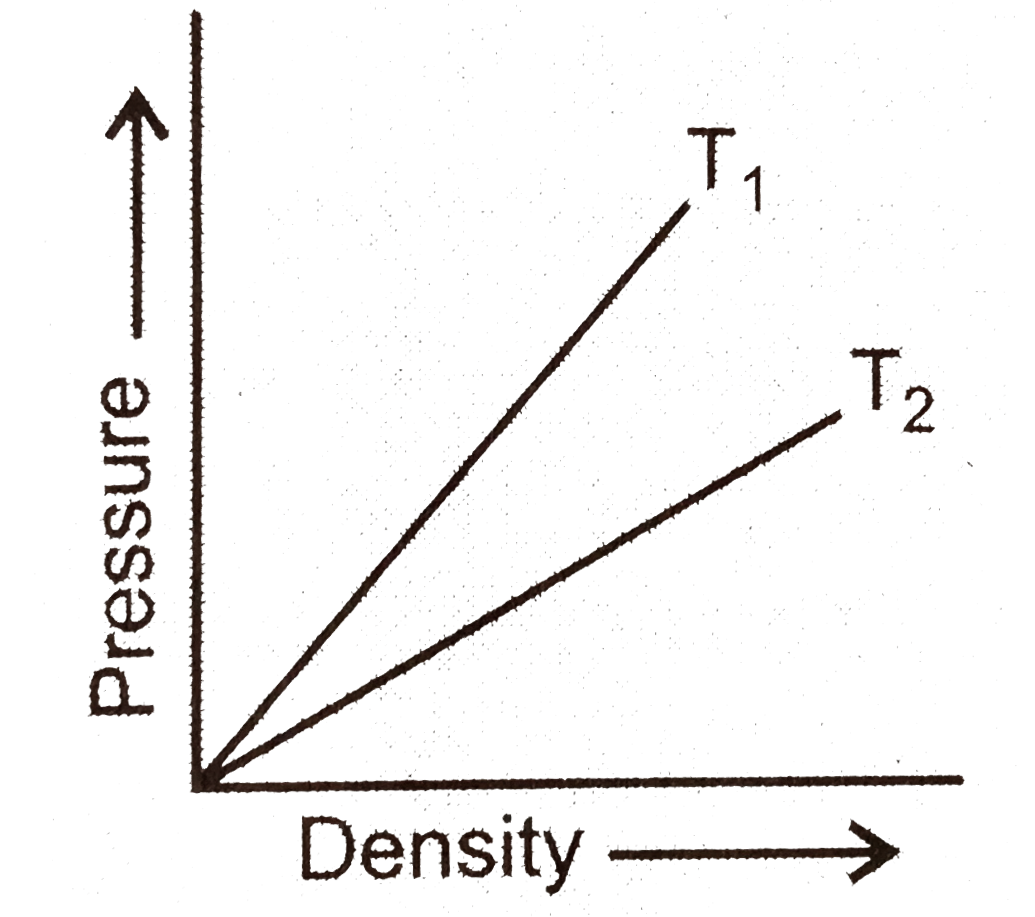 .AT1>T2BT2>T1CBothDNone of these
Which graph correctly represents variation between relaxation time (t) of gas molecules with absolute temperature of gas T.
View SolutionFigure shows graphs of pressure versus density for an ideal gas at two temperatures T1 and T2 Which is correct ?
 .View Solution
which of the following graph represents the variation of resistivity (ρ) with temperature (T) for copper?
View SolutionThe graph shows the variation in radiation intensity per unit wavelength versus wavelength for a perfect black- body at temperature T. Complete the following statement: As the blackbody temperature is increased, the peak in intensity of this curve
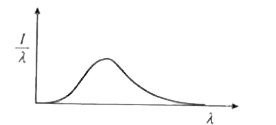 View Solution
which of the following graphs correctly represents the vatiation β=−(dVdP)T/V with P for an ideal gas at constant temperature ? .
View Solution


