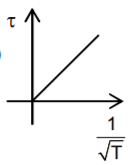
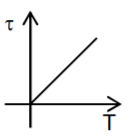
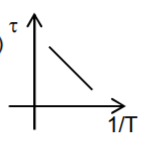
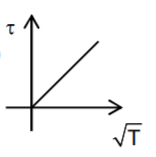
Which graph correctly represents variation between relaxation time (t) of gas molecules with absolute temperature of gas T.


The correct Answer is:A
To solve the problem of determining which graph correctly represents the variation between the relaxation time (τ) of gas molecules and the absolute temperature (T) of the gas, we can follow these steps:
1. Understand Relaxation Time:
- Relaxation time (τ) is defined as the mean free path (λ) divided by the velocity (v) of the gas molecules.
τ=λv
2. Mean Free Path Relation:
- The mean free path (λ) can be expressed as:
λ=1√2πnd2
- Here, n is the number density of gas molecules, and d is the diameter of the molecules. This equation does not directly relate λ to temperature (T).
3. Velocity Relation:
- The velocity (v) of gas molecules is related to the absolute temperature (T) by the equation:
v∝√T
- This means that as the temperature increases, the velocity of the gas molecules also increases.
4. Substituting Velocity into Relaxation Time:
- Since τ is inversely proportional to velocity, we can write:
τ∝1v
- Substituting the relation of velocity with temperature, we get:
τ∝1√T
5. Graphical Representation:
- The relationship τ∝1√T indicates that as the absolute temperature (T) increases, the relaxation time (τ) decreases. This suggests that the graph of τ versus T will be a decreasing curve.
- Specifically, if we plot τ against 1/√T, we expect a linear relationship.
6. Conclusion:
- Based on the analysis, the graph that correctly represents the variation of relaxation time (τ) with absolute temperature (T) is the one where τ decreases as T increases, which corresponds to the graph labeled as A.
Final Answer:
The correct graph is Graph A, which represents the variation between relaxation time (τ) of gas molecules and absolute temperature (T) of the gas.
- Relaxation time (τ) is defined as the mean free path (λ) divided by the velocity (v) of the gas molecules.
τ=λv
- The mean free path (λ) can be expressed as:
λ=1√2πnd2
- Here, n is the number density of gas molecules, and d is the diameter of the molecules. This equation does not directly relate λ to temperature (T).
- The velocity (v) of gas molecules is related to the absolute temperature (T) by the equation:
v∝√T
- This means that as the temperature increases, the velocity of the gas molecules also increases.
- Since τ is inversely proportional to velocity, we can write:
τ∝1v
- Substituting the relation of velocity with temperature, we get:
τ∝1√T
- The relationship τ∝1√T indicates that as the absolute temperature (T) increases, the relaxation time (τ) decreases. This suggests that the graph of τ versus T will be a decreasing curve.
- Specifically, if we plot τ against 1/√T, we expect a linear relationship.
- Based on the analysis, the graph that correctly represents the variation of relaxation time (τ) with absolute temperature (T) is the one where τ decreases as T increases, which corresponds to the graph labeled as A.
The correct graph is Graph A, which represents the variation between relaxation time (τ) of gas molecules and absolute temperature (T) of the gas.
Topper's Solved these Questions
Similar Questions
Which of the following diagram correctly represents the variation of internal energy (U) of gas under expansion at constant temperature.
View SolutionWhich of the following graphs correctly represents the variation of β=−dV/dPV
with P for an ideal gas at constant temperature?
View SolutionWhich of the following graphs correctly represents the variation of β=−dV/dPV
with P for an ideal gas at constant temperature?
View SolutionWhat is the mean translation kinetic energy of a perfect gas molecule at temperature T?
View SolutionWhich of the following graphs correctly represents the variation of g on the - Earth?
View SolutionThe graph which represents the variation of mean kinetic energy of moleules with temperature ∘C is ?
View SolutionThe average kinetic energy of a molecule of a gas at absolute temperature T is proportional to
View SolutionWhich of the following graphs correctly represents the variation of β=−(dVdP)/V with P for an ideal gas at constant temperature
View SolutionWhich of the following graphs correctly represents the relation between In (E) and In (T), where E is the amount of radiation emitted per unit time from a unit area of the body and T is the absolute temperature ?
View SolutionThe mean square speed of the molecules of a gas at absolute temperature T is proportional to
View Solution
