A spherical insulator of radius R is charged uniformly with a charge Q throughout its volume and contains a point charge Q16 located at its centre. Which of the following graphs best represent quanlitatively, the variation of electric field intensity E with distance r from the centre.
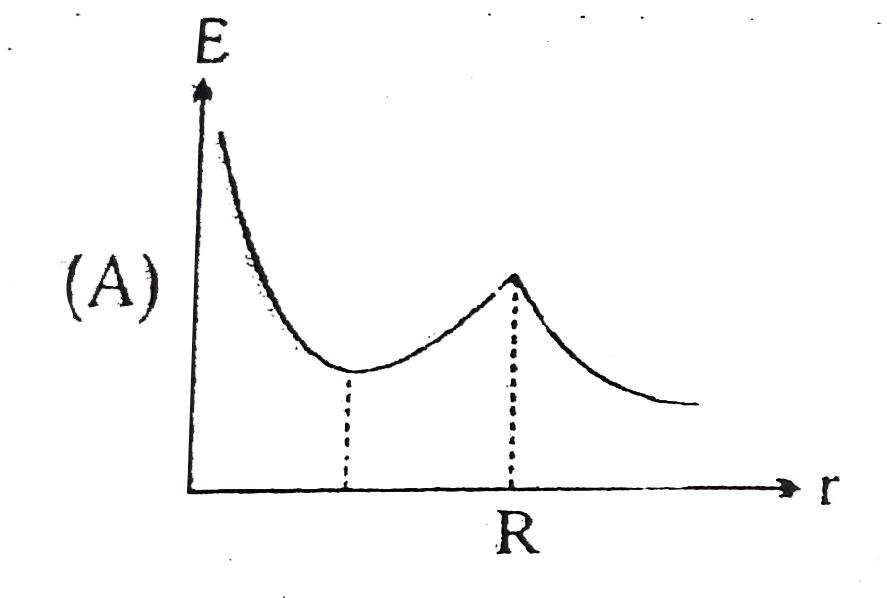
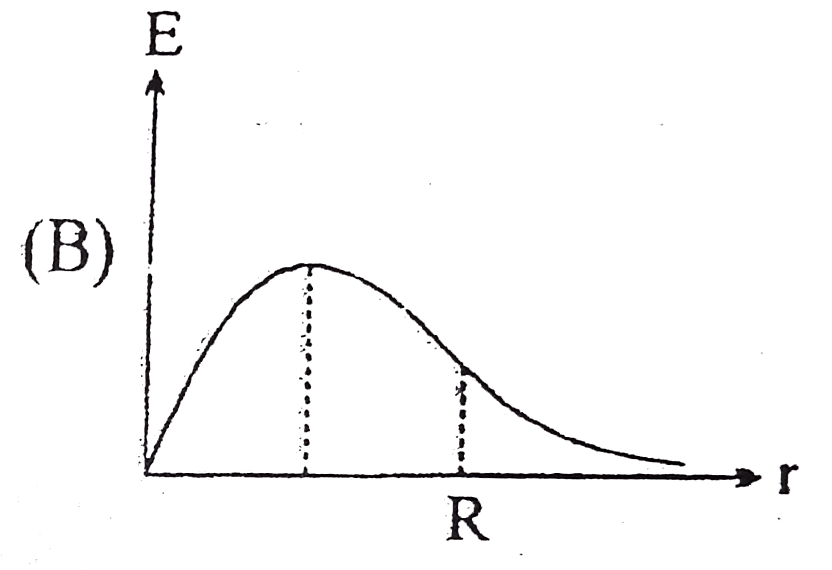
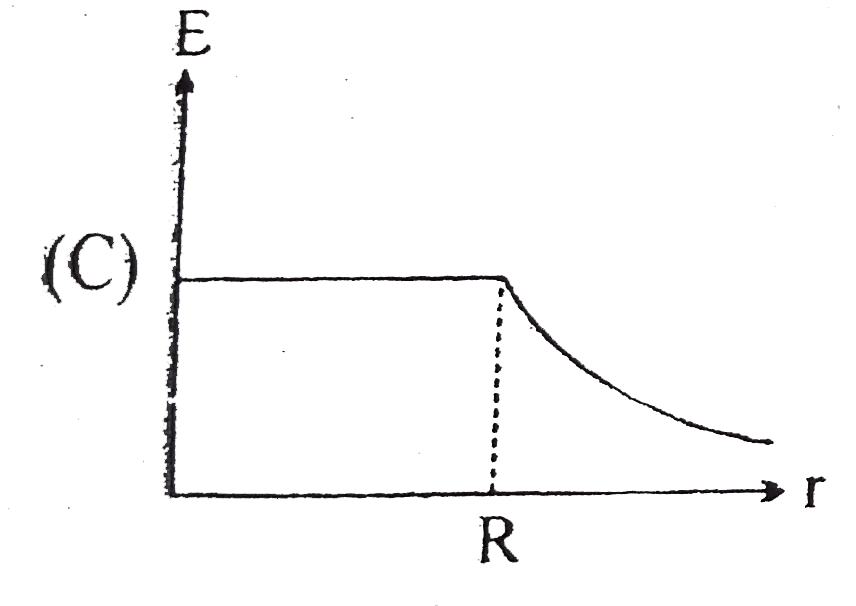
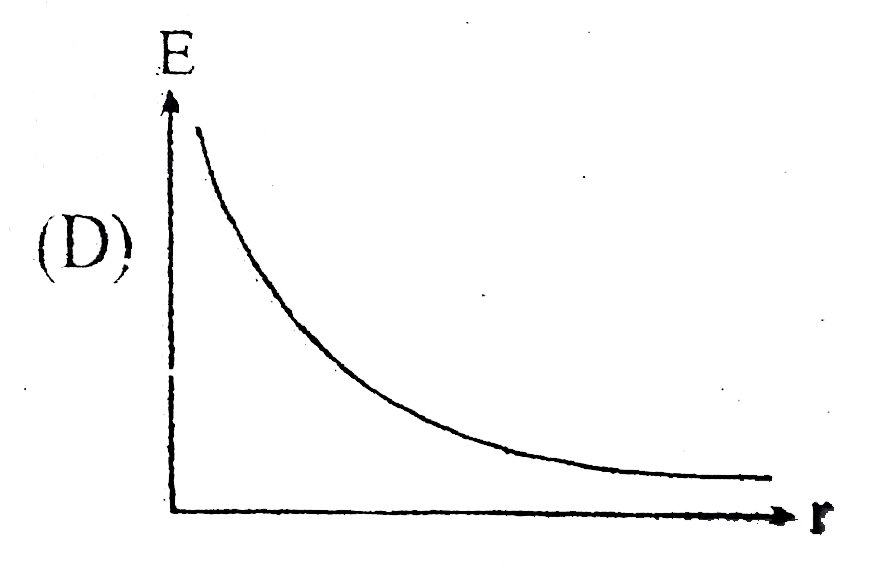
The correct Answer is:A
To solve the problem of the electric field intensity E variation with distance r from the center of a uniformly charged spherical insulator containing a point charge at its center, we can follow these steps:
Step 1: Understand the System
We have a spherical insulator of radius R uniformly charged with charge Q and a point charge Q16 at its center. The electric field E will vary based on the distance r from the center.
Step 2: Analyze the Electric Field Inside the Sphere
For a uniformly charged sphere, the electric field inside the sphere (at a distance r<R) can be calculated using Gauss's law. The electric field E at a distance r from the center is given by:
E=14πϵ0(Qencr2)
Where Qenc is the charge enclosed within the Gaussian surface of radius r. The charge enclosed is the charge due to the point charge at the center and the charge distributed in the volume of the sphere.
Step 3: Calculate the Enclosed Charge
The charge enclosed Qenc at a distance r is given by:
Qenc=QV⋅Venc+Q16
Where V is the total volume of the sphere and Venc is the volume of the sphere of radius r:
V=43πR3,Venc=43πr3
Thus,
Qenc=⎛⎝Q43πR3⋅43πr3⎞⎠+Q16=Qr3R3+Q16
Step 4: Electric Field Inside the Sphere
Substituting Qenc back into the electric field equation gives:
E=14πϵ0⎛⎜⎝Qr3R3+Q16r2⎞⎟⎠
This shows that the electric field inside the sphere will increase with r until it reaches the surface.
Step 5: Electric Field Outside the Sphere
For r>R, the entire charge Q+Q16 can be treated as a point charge at the center. Therefore, the electric field outside the sphere is given by:
E=14πϵ0⎛⎜⎝Q+Q16r2⎞⎟⎠=14πϵ0(17Q/16r2)
Step 6: Graphical Representation
1. Inside the Sphere (0 < r < R): The electric field starts from zero, increases as r increases, and reaches a maximum at r=R.
2. At the Surface (r = R): The electric field will have a maximum value.
3. Outside the Sphere (r > R): The electric field decreases as 1r2.
Conclusion
The graph that best represents the variation of electric field intensity E with distance r from the center will show an increase in E from r=0 to r=R, followed by a decrease for r>R.
We have a spherical insulator of radius R uniformly charged with charge Q and a point charge Q16 at its center. The electric field E will vary based on the distance r from the center.
For a uniformly charged sphere, the electric field inside the sphere (at a distance r<R) can be calculated using Gauss's law. The electric field E at a distance r from the center is given by:
The charge enclosed Qenc at a distance r is given by:
Substituting Qenc back into the electric field equation gives:
For r>R, the entire charge Q+Q16 can be treated as a point charge at the center. Therefore, the electric field outside the sphere is given by:
1. Inside the Sphere (0 < r < R): The electric field starts from zero, increases as r increases, and reaches a maximum at r=R.
2. At the Surface (r = R): The electric field will have a maximum value.
3. Outside the Sphere (r > R): The electric field decreases as 1r2.
The graph that best represents the variation of electric field intensity E with distance r from the center will show an increase in E from r=0 to r=R, followed by a decrease for r>R.
Topper's Solved these Questions
- BOOK - BANSALCHAPTER - MASTER PRACTICE PROBLEMEXERCISE - Comphrehension134videos
MASTER PRACTICE PROBLEM
- BOOK - BANSALCHAPTER - MASTER PRACTICE PROBLEMEXERCISE - Reasoning75videos
MASTER PRACTICE PROBLEM
- BOOK - BANSALCHAPTER - FLUID MECHANICSEXERCISE - PYQS AIEEE10videos
FLUID MECHANICS
- BOOK - BANSALCHAPTER - SEMICONDUCTORSEXERCISE - CBSE Question32videos
SEMICONDUCTORS
Similar Questions
Which one of the following graphs represents the variation of electric field with distance r from the centre of a charged spherical conductor of radius R?
View SolutionFor a uniformly charged non conducting sphere of radius R which of following shows a correct graph between the electric field intensity and the distance from the centre of sphere –
View Solution
Knowledge Check
- Question 1 - Select One
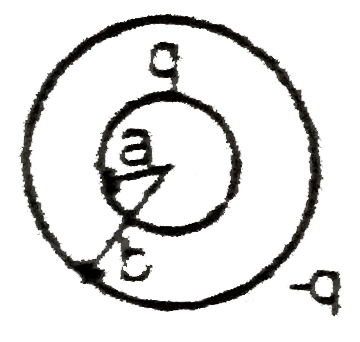
Figure shows two concentric shells of radii a and b uniformly distributed charges q and -q. Which of the following graphs gives correct variation of electric field intensity E with the distance r from the centre?
 A
A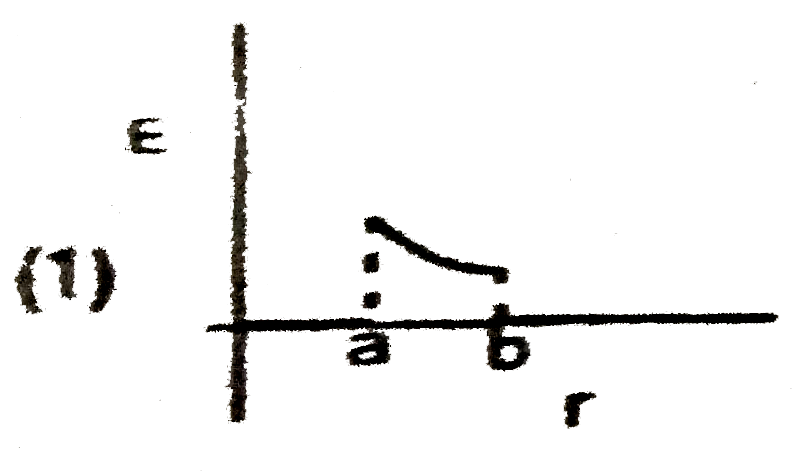 B
B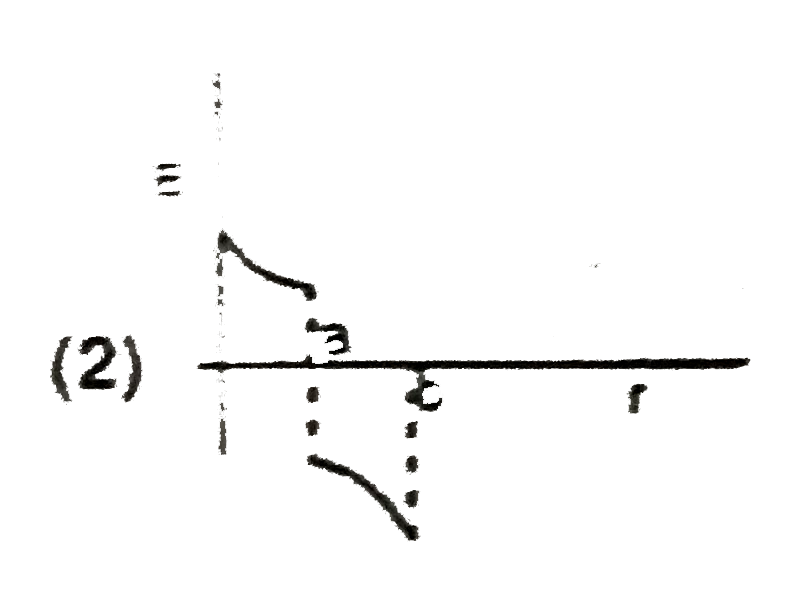 C
C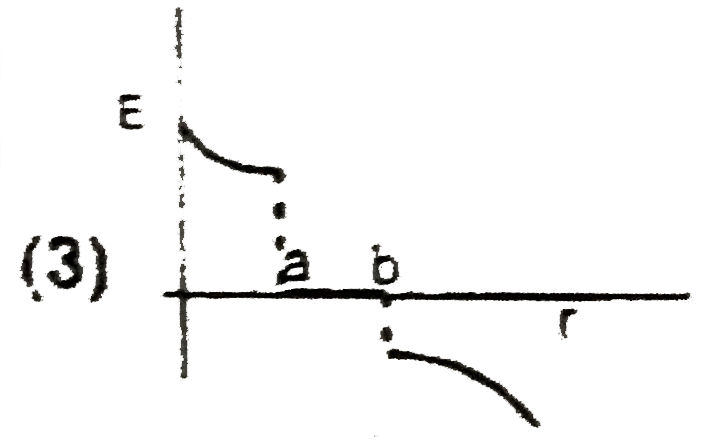 D
D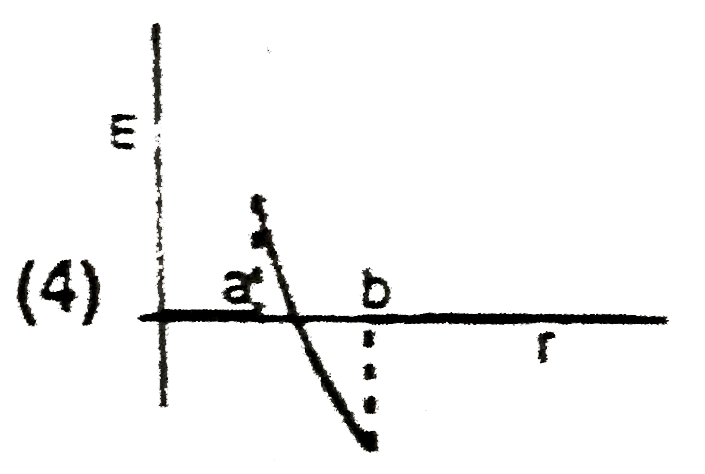
- Question 2 - Select One
A metallic spherical shell of radius R has a charge -Q on it. A point charge +Q is placed at the centre of the shell. Which of the graphs shown below may correctly represent the variation of electric field E with distance r from the centre of shell ?
A B
B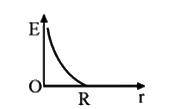 C
C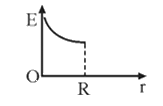 D
D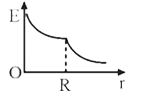
- Question 3 - Select One
Which one of the following graphs represents the variation of electric field with distance r from the centre of a charged spherical conductor of radius R?
A B
B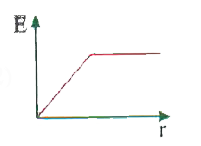 C
C D
D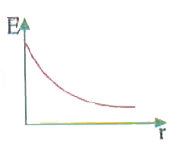
A ring of radius R is charged uniformly with a charge +Q. The potential at a point on its axis at a distance 'r' from any point on ring will be-
View SolutionA sphere of radius R, is charged uniformly with total charge Q. Then correct statement for electric field is (r = distance from centre): -
View SolutionA hallow metal sphere of radius R is uniformly charged. The electric field due to the sphere at a distance r from the centre:
View SolutionA charge Q is uniformly distributed in a dielectric sphere of radius R (having dielectric constant unity). This dielectric sphere is enclosed by a concentric spherical shell of radius 2R and having uniformly distributed charge 2Q. Which of the following graph correctly represents variation of electric field with distance r from the common centre?
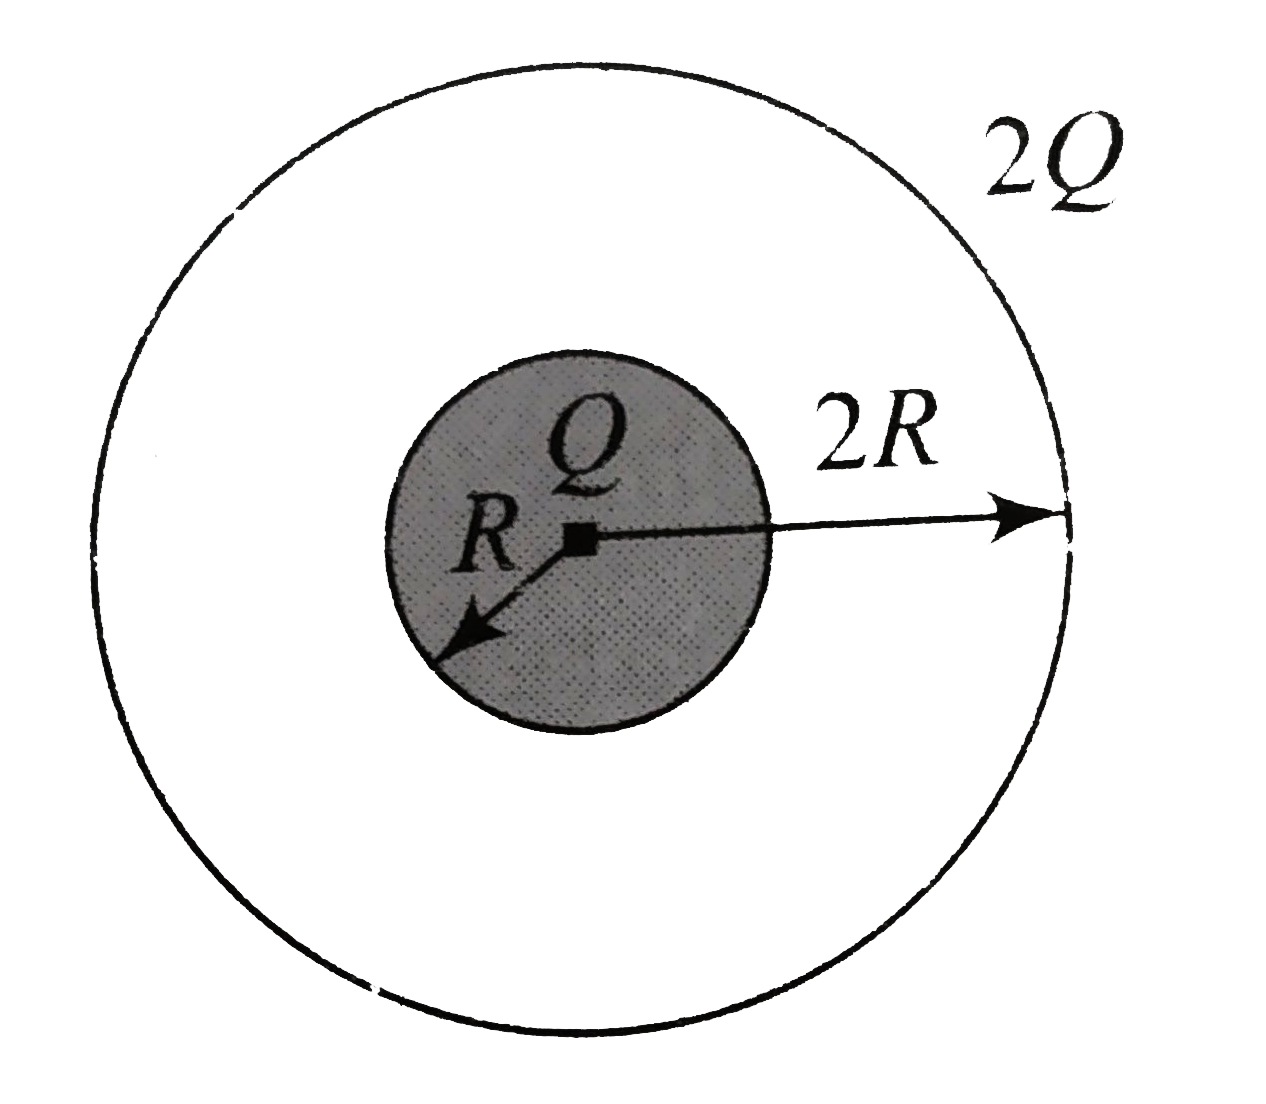 View Solution
Which of the following graph represents the variation of electric field E due to a thin charged spherical shell of radius R as a function of the distance r from the centre of the shell?
View Solution

