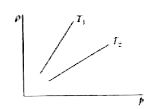
Figure shows the pressure P versus volume V graphs for two different gas sample at a given temperature. MAandMB are masses of two samples, nAandnB are numbers of moles. Which of the following must be incorrect.
MA>MB
MA<MB
nA>nB
nA<gt n_B
The correct Answer is:C
nRTB>nRTA
⇒n1>n2
Topper's Solved these Questions
- KINETIC THEORY OF GASESBOOK - BANSALCHAPTER - KINETIC THEORY OF GASESEXERCISE - Matrix Type
2 Videos
- KINETIC THEORY OF GASESBOOK - BANSALCHAPTER - KINETIC THEORY OF GASESEXERCISE - Exercise-3
33 Videos
- KINETIC THEORY OF GASESBOOK - BANSALCHAPTER - KINETIC THEORY OF GASESEXERCISE - Reasoning Type
1 Videos
- HEAT TRANSFERBOOK - BANSALCHAPTER - HEAT TRANSFEREXERCISE - Exercise
89 Videos
- UNIT DIMENSION, VECTOR & BASIC MATHSBOOK - BANSALCHAPTER - UNIT DIMENSION, VECTOR & BASIC MATHSEXERCISE - Exercise
10 Videos
Similar Questions
Knowledge Check
Figure shows the pressure P versus volume V graphs for a certains mass of a gas at two constant temperature T1andT2. Which of the following interface is correct?
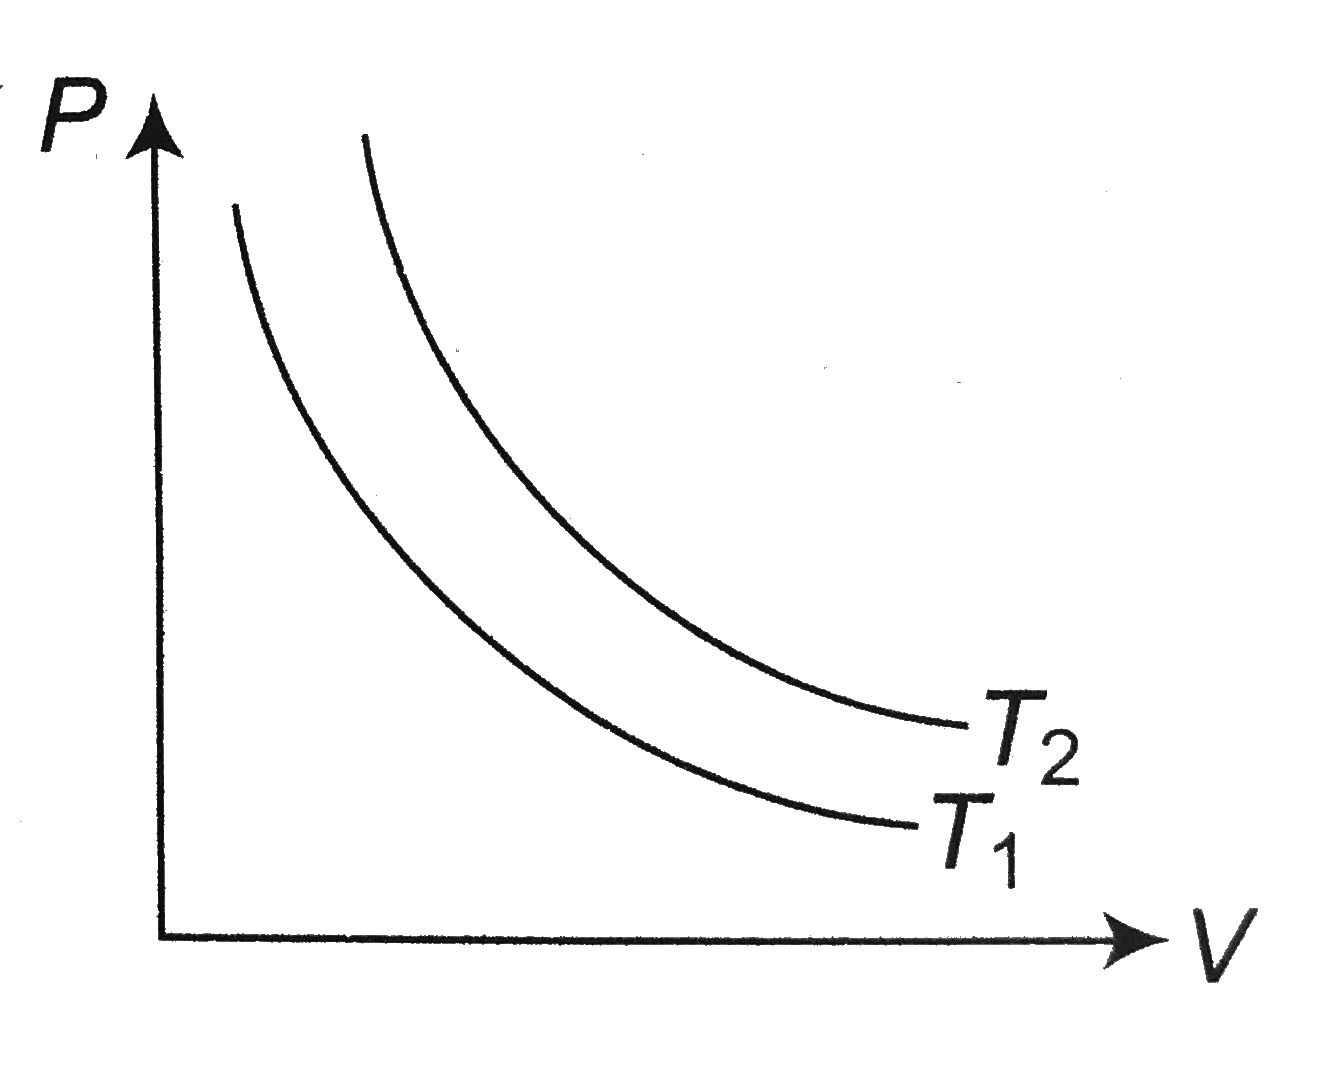 AT1=T2BT1>T2CT1<T2Dno inference can be drawn due to insufficient information
Figure shows graphs of pressure versus density for an ideal gas at two temperatures T1 and T2 Which is correct ?
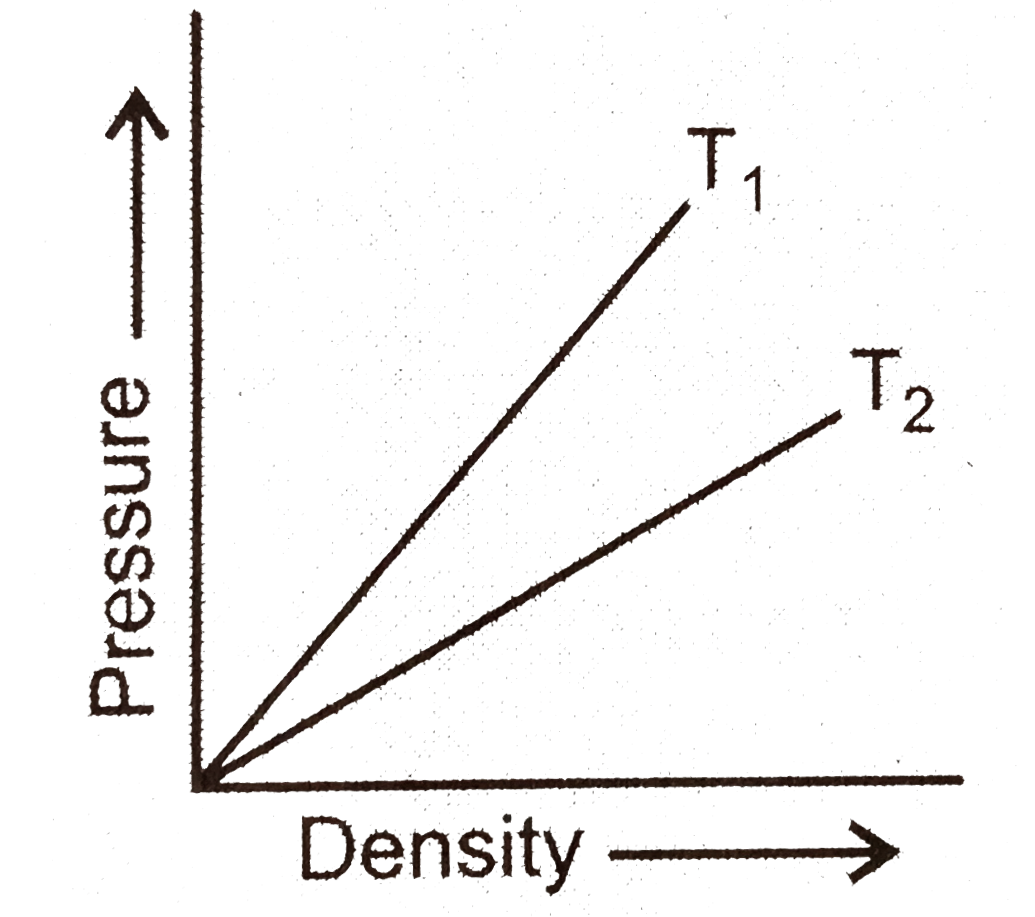 .AT1>T2BT2>T1CBothDNone of these
Following graph represents a pressure (P) volume (V) relationship at a fixed temperature (T) for n moles of a real gas. The graph has two regions marked (I) and (II). Which of the following options is true.
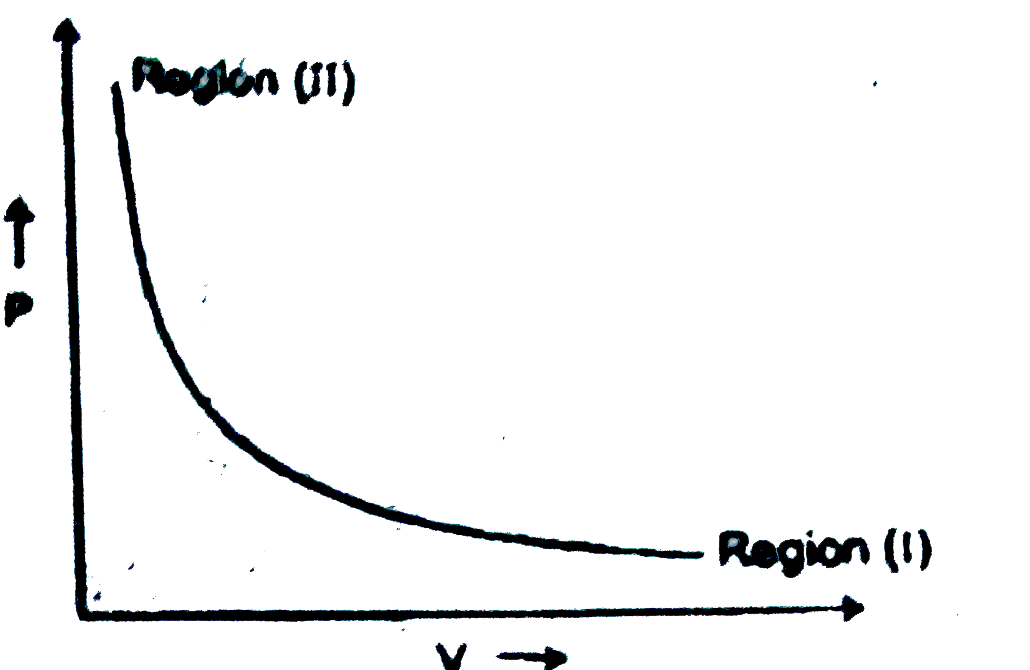 AZ>1 in the region (II).BZ=1 in the region (II)CZ=1 for the curveDZ approaches 1 as we move from region (II) to region (I)
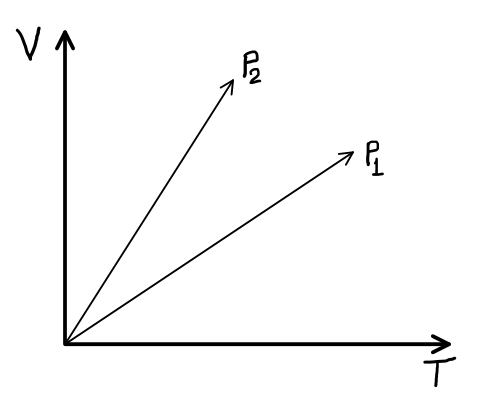
Figure shows volume - temperature (V-T) graph for same mass of an ideal gas at two different pressures P1and P2. Hence
View SolutionFollowing graph represents a pressure (P) volume (V) relationship at a fixed temperature (T) for n moles of a real gas. The graph has two regions marked (I) and (II). Which of the following options is true.
View SolutionFollowing graph represents a pressure (P) volume (V) relationship at a fixed temperature (T) for n moles of a real gas. The graph has two regions marked (I) and (II). Which of the following options is true.

View SolutionA fiven sample of an ideal gas occupise a volume V at a pressure p and sbsoulte temperature T.The mass of each molecule of the gas is m. Which of the following fives the dinsity of the gas ?
View SolutionFigure shows the volume versus temperature graph for the same mass of a gas (assumed ideal) corresponding to two different pressure P1andP2. Then
View Solution

