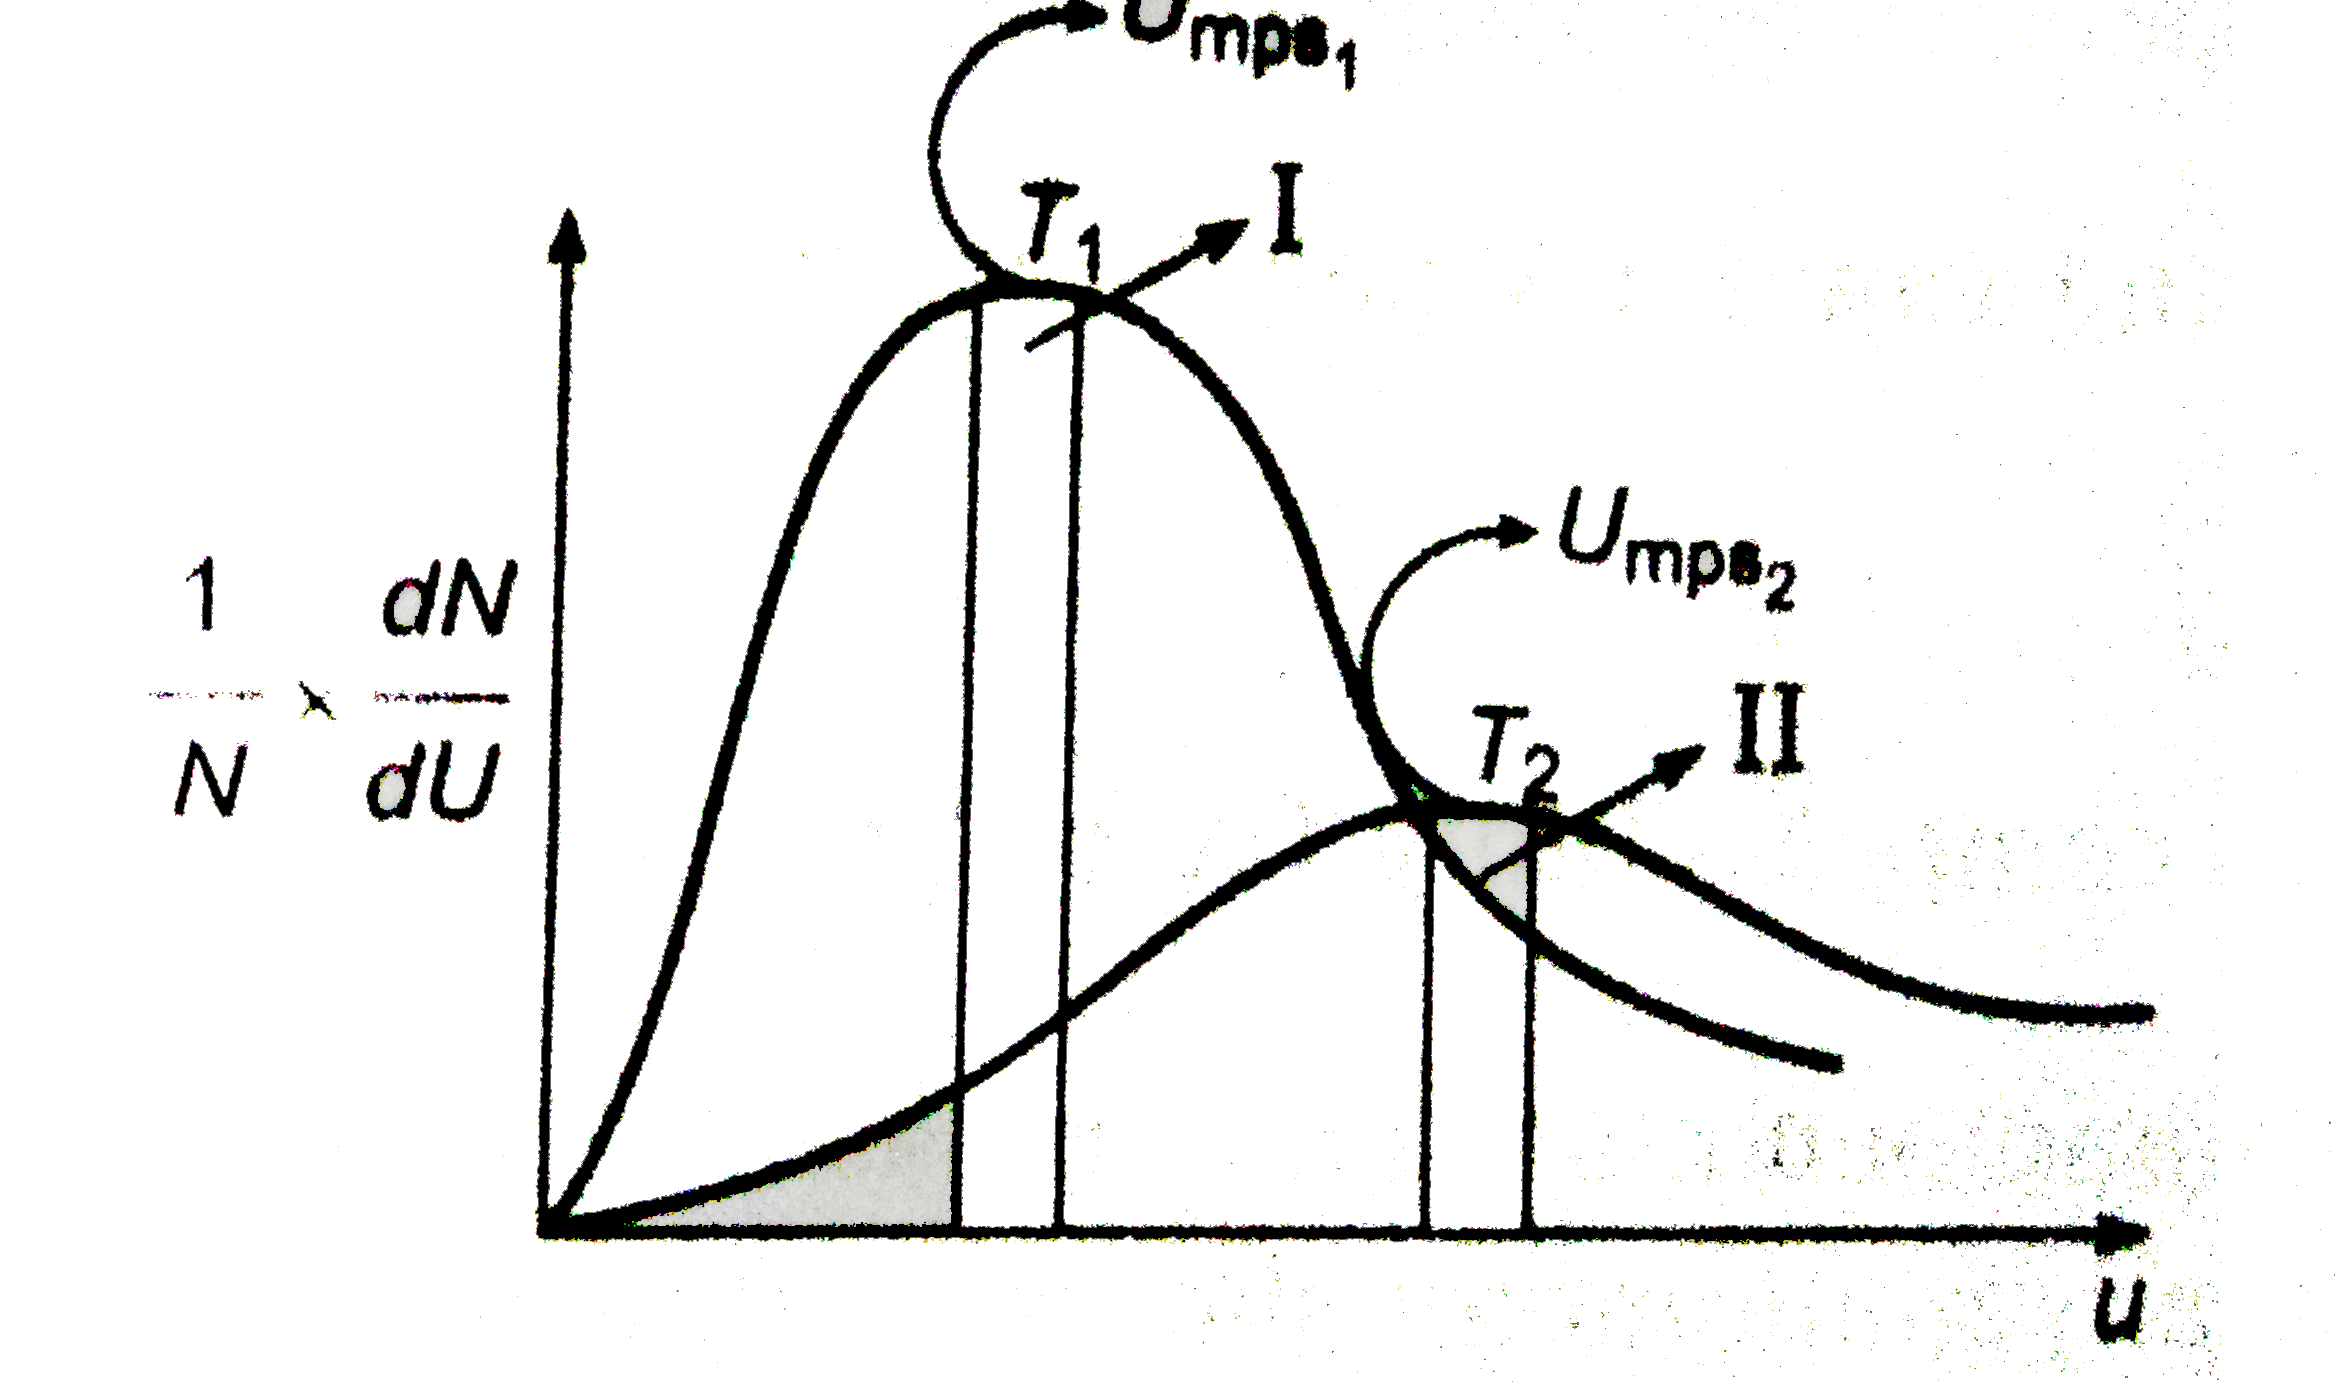
Following graph represents a pressure (P) volume (V) relationship at a fixed temperature (T) for n moles of a real gas. The graph has two regions marked (I) and (II). Which of the following options is true.
Z<1 in the region (II)
Z=1 I the region (II)
Z=1 for the curve
Z approaches 1 as we move from region (II) to region (I)
The correct Answer is:D
To solve the question regarding the pressure-volume relationship of a real gas at a fixed temperature, we will analyze the graph and the behavior of the gas in the marked regions (I and II).
1. Understanding the Graph:
- The graph represents the relationship between pressure (P) and volume (V) for a real gas at a constant temperature (T).
- The two regions marked (I) and (II) indicate different behaviors of the gas under varying pressure and volume conditions.
2. Analyzing Region II:
- In Region II, the pressure is relatively high. Under high pressure, the volume of the gas is small, and the intermolecular forces become significant.
- Real gases deviate from ideal behavior in this region, often showing a compressibility factor (Z) less than 1, indicating that attractive forces dominate.
3. Analyzing Region I:
- In Region I, the pressure is lower and the volume is larger. At low pressure and high volume, the gas molecules are far apart, and the effects of intermolecular forces become negligible.
- In this region, the real gas behaves more like an ideal gas, and the compressibility factor (Z) approaches 1.
4. Comparing Regions:
- As the gas transitions from Region II to Region I, the pressure decreases, and the volume increases.
- This transition indicates that the gas is behaving more ideally as it moves to a state of lower pressure and higher volume.
5. Conclusion:
- The correct statements regarding the behavior of the gas in the two regions are:
- In Region II, Z < 1 (indicating non-ideal behavior due to high pressure).
- In Region I, Z approaches 1 (indicating ideal behavior due to low pressure).
- Therefore, the correct options are A (Z < 1 in Region II) and D (Z approaches 1 in Region I).
Final Answer:
The correct options are A and D.
- The graph represents the relationship between pressure (P) and volume (V) for a real gas at a constant temperature (T).
- The two regions marked (I) and (II) indicate different behaviors of the gas under varying pressure and volume conditions.
- In Region II, the pressure is relatively high. Under high pressure, the volume of the gas is small, and the intermolecular forces become significant.
- Real gases deviate from ideal behavior in this region, often showing a compressibility factor (Z) less than 1, indicating that attractive forces dominate.
- In Region I, the pressure is lower and the volume is larger. At low pressure and high volume, the gas molecules are far apart, and the effects of intermolecular forces become negligible.
- In this region, the real gas behaves more like an ideal gas, and the compressibility factor (Z) approaches 1.
- As the gas transitions from Region II to Region I, the pressure decreases, and the volume increases.
- This transition indicates that the gas is behaving more ideally as it moves to a state of lower pressure and higher volume.
- The correct statements regarding the behavior of the gas in the two regions are:
- In Region II, Z < 1 (indicating non-ideal behavior due to high pressure).
- In Region I, Z approaches 1 (indicating ideal behavior due to low pressure).
- Therefore, the correct options are A (Z < 1 in Region II) and D (Z approaches 1 in Region I).
The correct options are A and D.
Topper's Solved these Questions
- GASEOUS STATEBOOK - RESONANCE ENGLISHCHAPTER - GASEOUS STATEEXERCISE - Exercise-3
1 Videos
- GASEOUS STATEBOOK - RESONANCE ENGLISHCHAPTER - GASEOUS STATEEXERCISE - Exercise-2
1 Videos
- FUNDAMENTAL CONCEPTBOOK - RESONANCE ENGLISHCHAPTER - FUNDAMENTAL CONCEPTEXERCISE - ORGANIC CHEMISTRY(Fundamental Concept )
40 Videos
- HYDROCARBONBOOK - RESONANCE ENGLISHCHAPTER - HYDROCARBONEXERCISE - ORGANIC CHEMISTRY(Hydrocarbon)
50 Videos
Similar Questions
Knowledge Check
Which of the following graph represents correct graph for SN1 reaction :
A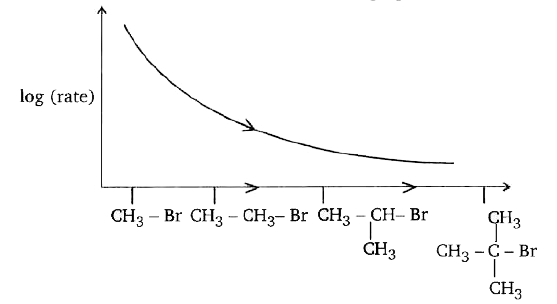 B
B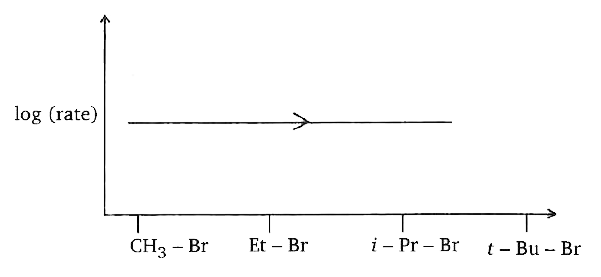 C
C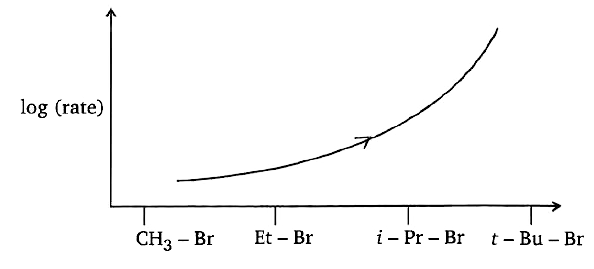 D
D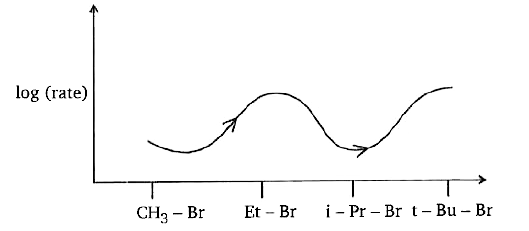
An ideal gas has pressure P, volume V and temperature T. Select the correct option.
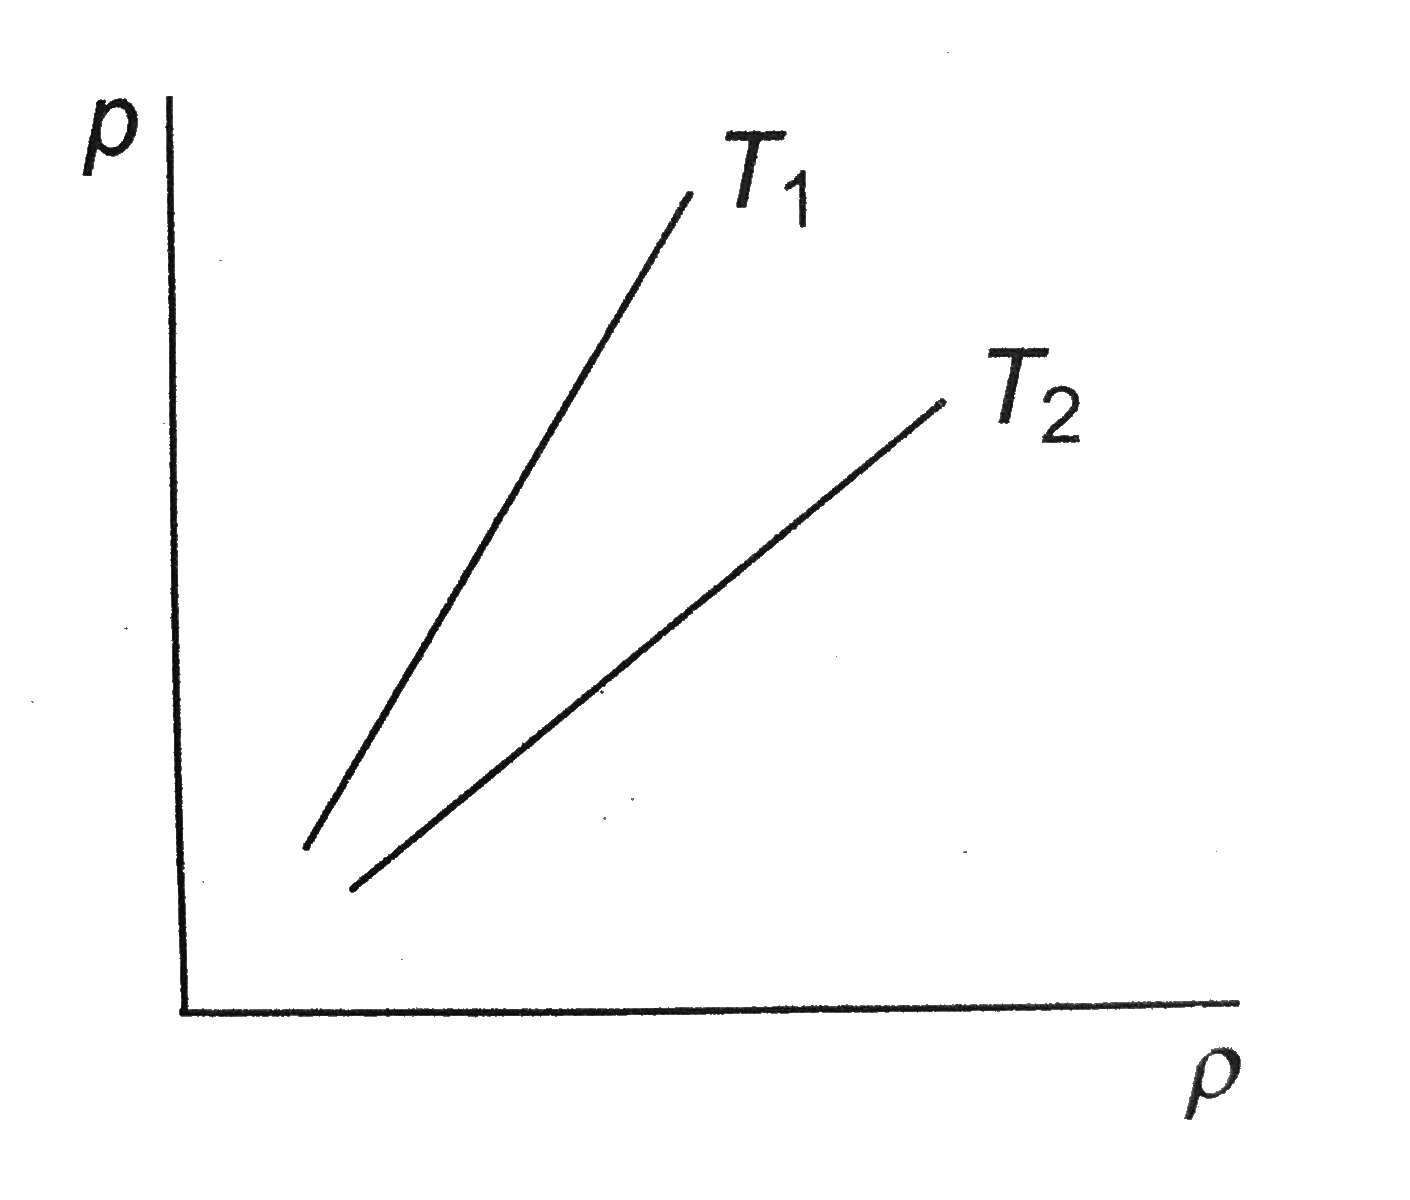
View SolutionFigure shows graphs of pressure vs density for an ideal gas at two temperature T1andT2. Which of the following is correct?
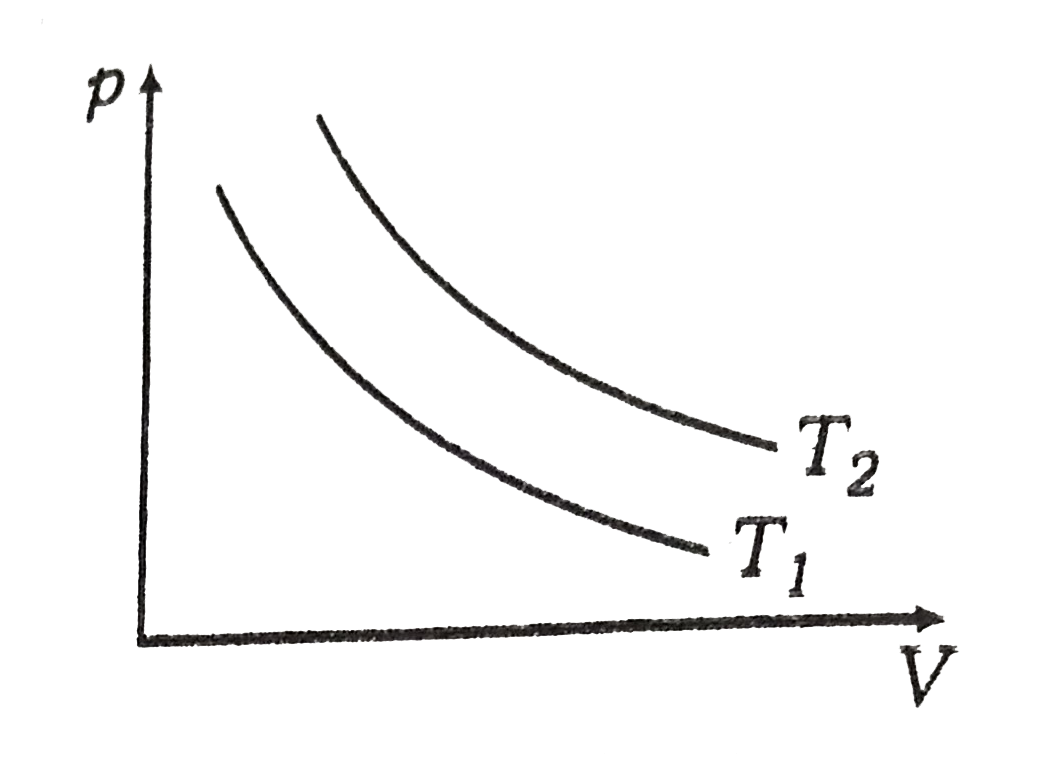
View SolutionThe adjoining fgure shows graph of pressure and volume of a gas at two temperatures T1 and T2 Which one the following is correct
View SolutionA gas enclosed in a vessel has pressure P, volume V and absolute temperature T, write the formula for number of molecule N of the gas.
View SolutionA graph between vapour pressure and temperature of few liquids is given below . Study the graph and answer the following :
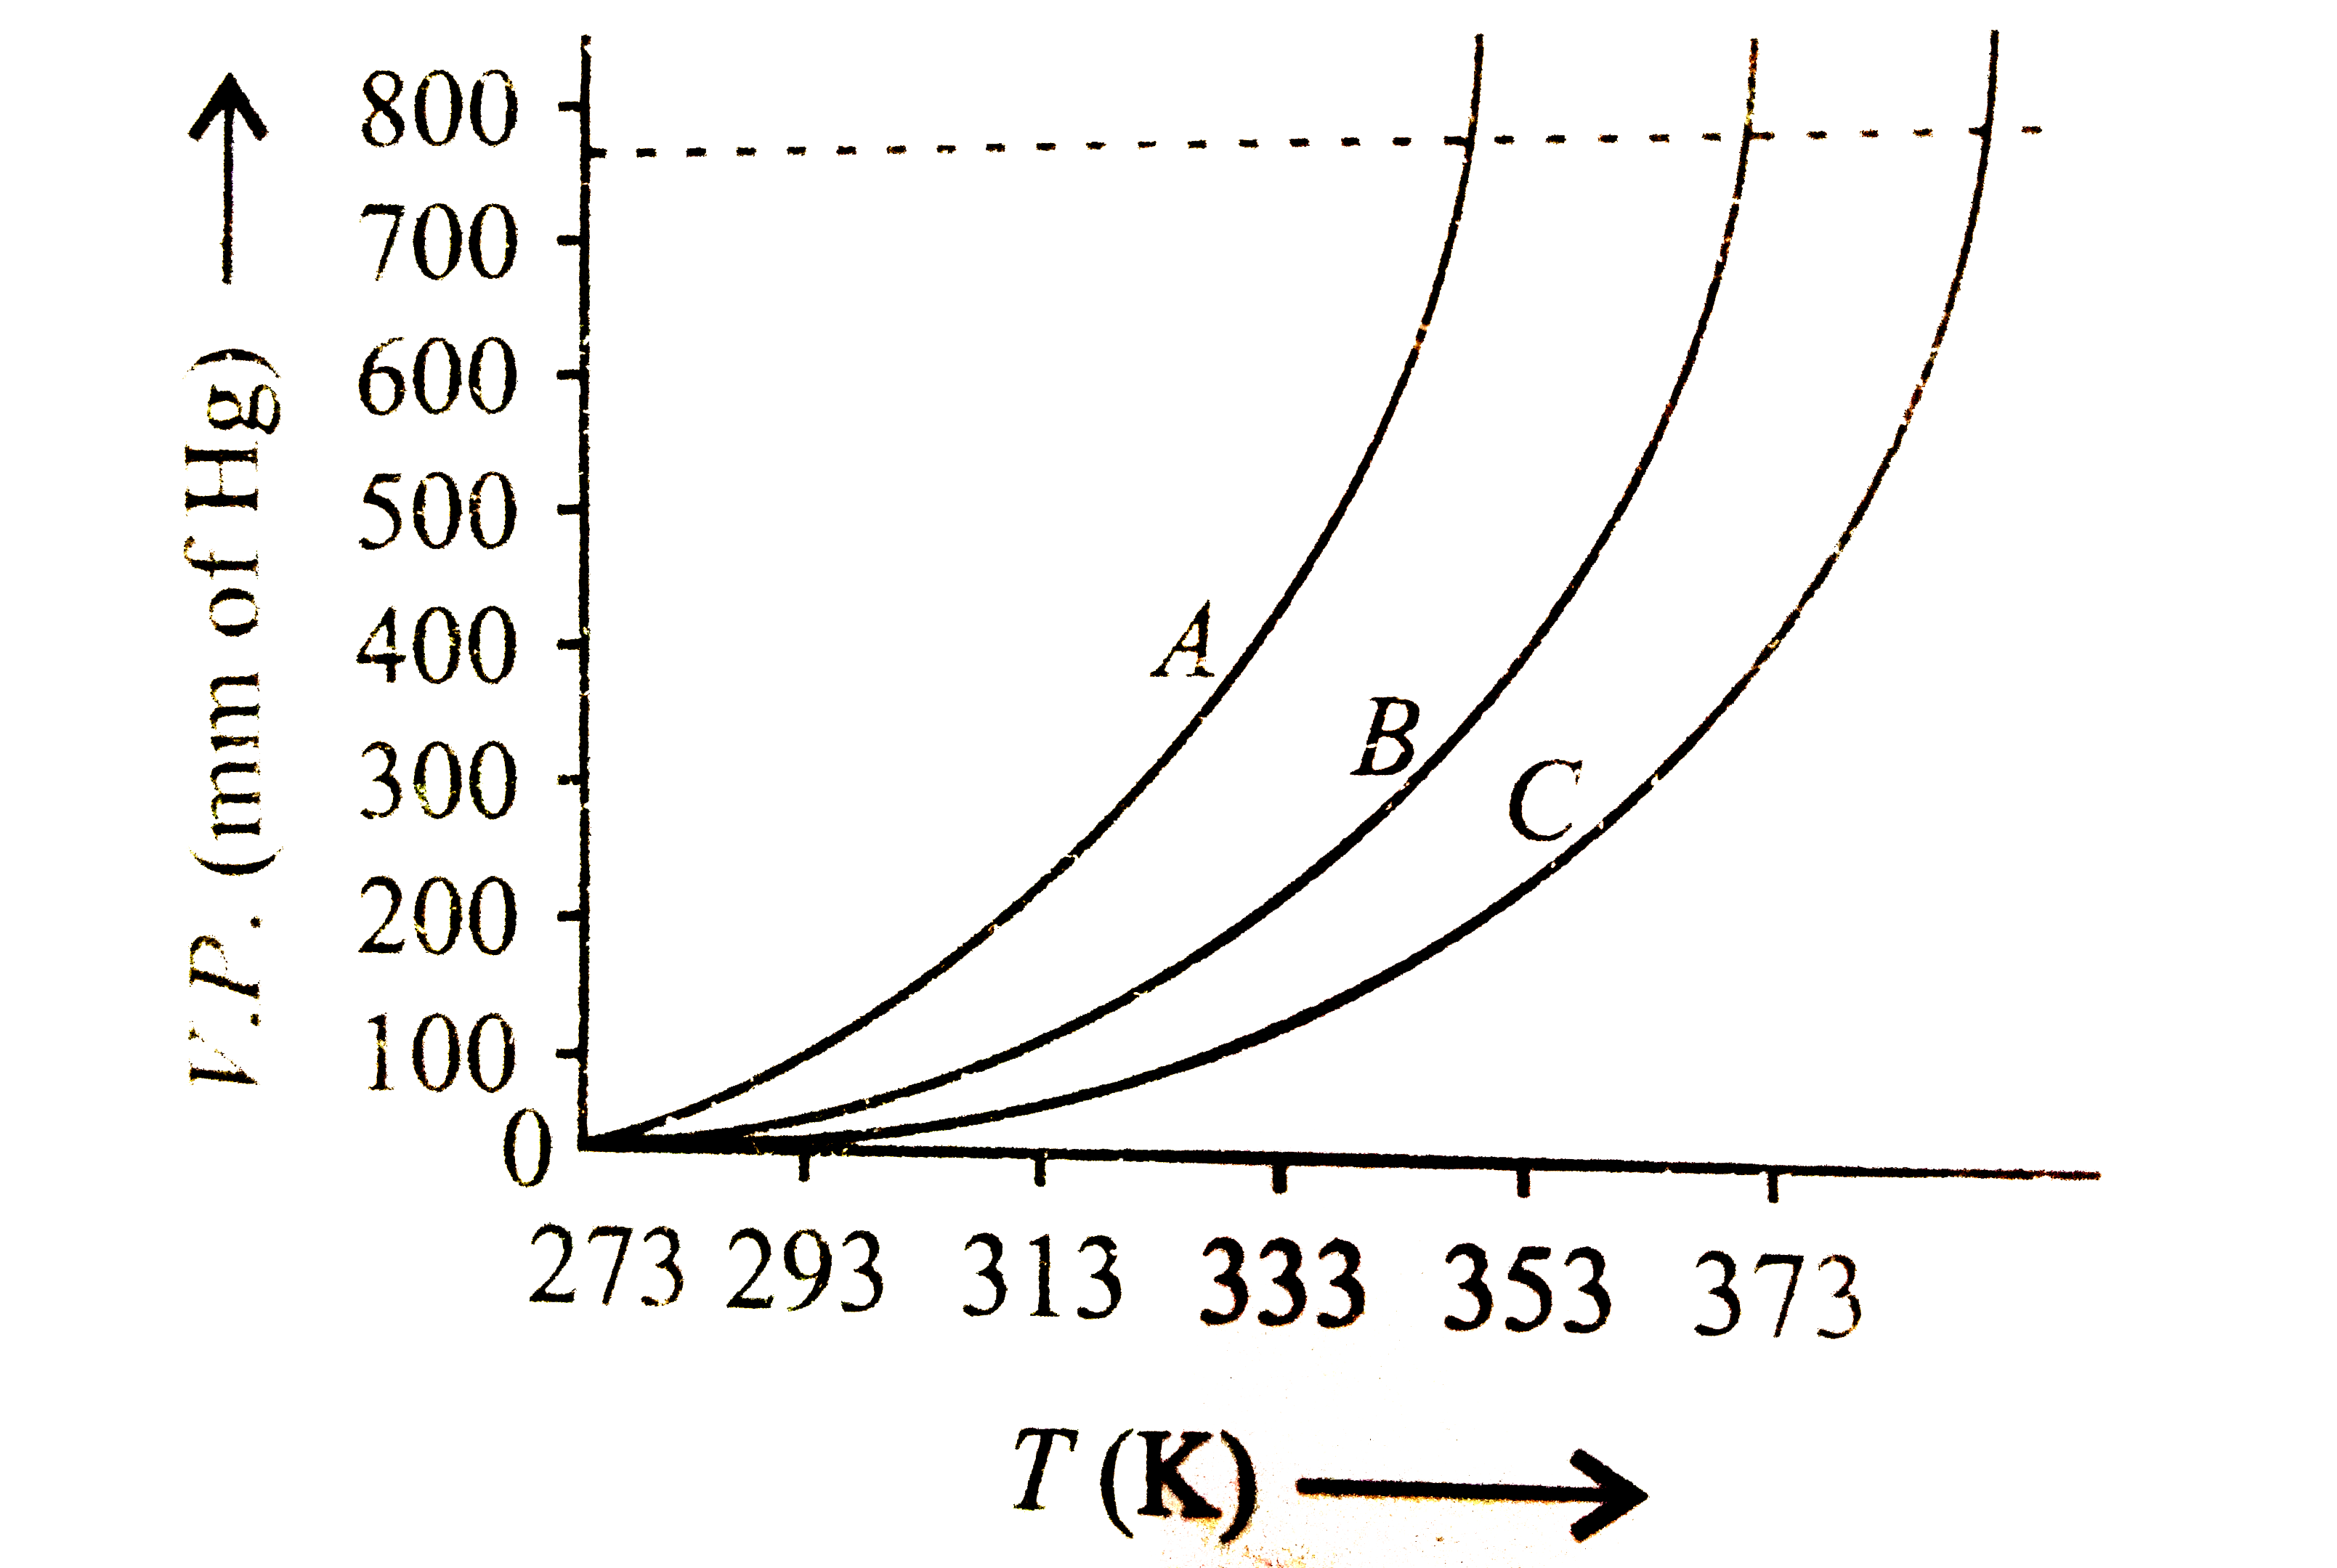
Which of the following statements is true ?
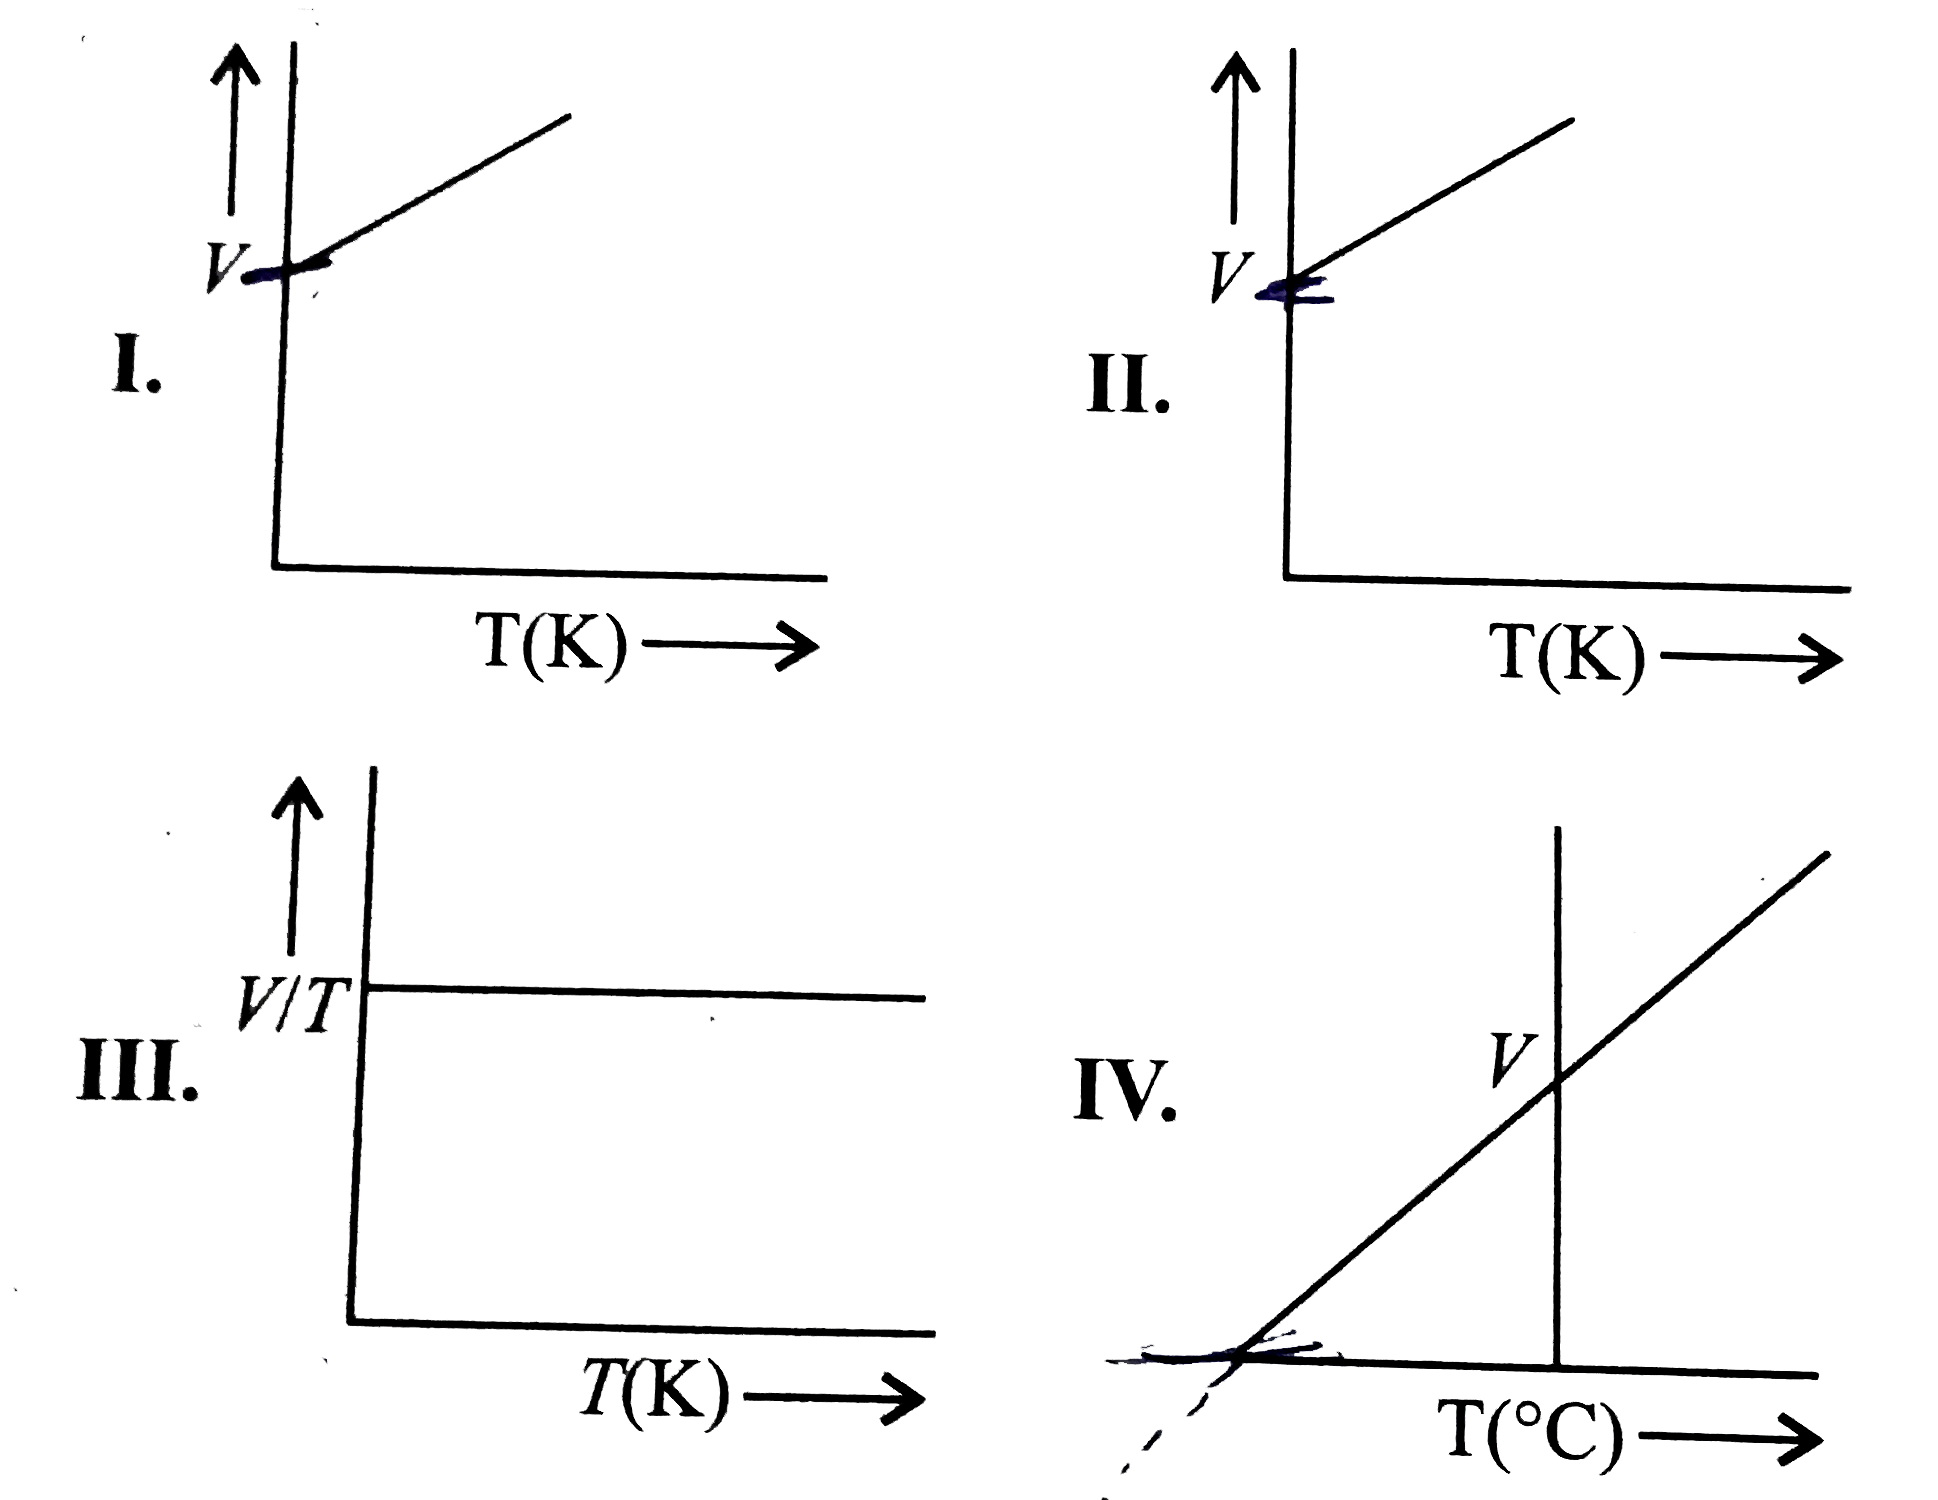
View SolutionFor a fixed mass of gas and constant pressure, which of the following graphs is / are correct?
View SolutionThe vander waal's equation for a gas is (p+aV2)(V−b)=nRT where p, V, R, T and n represent the Pressure, Volume, universal gas constant, absolute temperature and number of moles of a gas respectively, where a and b are constants. The ratioba will have the following dimensional formula
View Solution

