For an ideal gas a process PV diagram is a circle. An adiabatic from A passes through C. An isothrem from A passes through B. We take a part of the circular cyclic process. Comment on the sign of the quantity of column -I  Column−IColumn−II(A)Heat given to the gas in going from A to C along circle(P)Positve(B)Heat given to the gas in going from B to C along circle(Q)Negative(C)Heat given to the gas in going from C to D along circle(R)Zero(S)can't be said
The correct Answer is:A,P(B)Q(C)Q
(A) A to C along circe net work done is + ve and triangleV is - ve
But (△ω−△V)> 0 So, △Q=△ω−△U
△Q>0
(B) B to C along circle there is compression so work done is (-ve) and △Uis(−ve)so△Qis−ve
(c) Same as B to C along circle
Topper's Solved these Questions
- KINETIC THEORY OF GASESBOOK - BANSALCHAPTER - KINETIC THEORY OF GASESEXERCISE - Exercise-3
33 Videos
- KINETIC THEORY OF GASESBOOK - BANSALCHAPTER - KINETIC THEORY OF GASESEXERCISE - Exercise-4
35 Videos
- KINETIC THEORY OF GASESBOOK - BANSALCHAPTER - KINETIC THEORY OF GASESEXERCISE - Multiple Correct Choice Type
15 Videos
- HEAT TRANSFERBOOK - BANSALCHAPTER - HEAT TRANSFEREXERCISE - Exercise
89 Videos
- UNIT DIMENSION, VECTOR & BASIC MATHSBOOK - BANSALCHAPTER - UNIT DIMENSION, VECTOR & BASIC MATHSEXERCISE - Exercise
10 Videos
Similar Questions
Knowledge Check
P-V diagram of a diatomic gas is a straight line passing through origin. The molar heat capacity of the gas in the process will be
A4RB2.5RC3RD4R3P–V diagram of a monatomic gas is a straight line passing through origin. The molar heat capacity of the gas in the process will be:
A3R2BR2C2RD3RGraph for one mole gas is given below

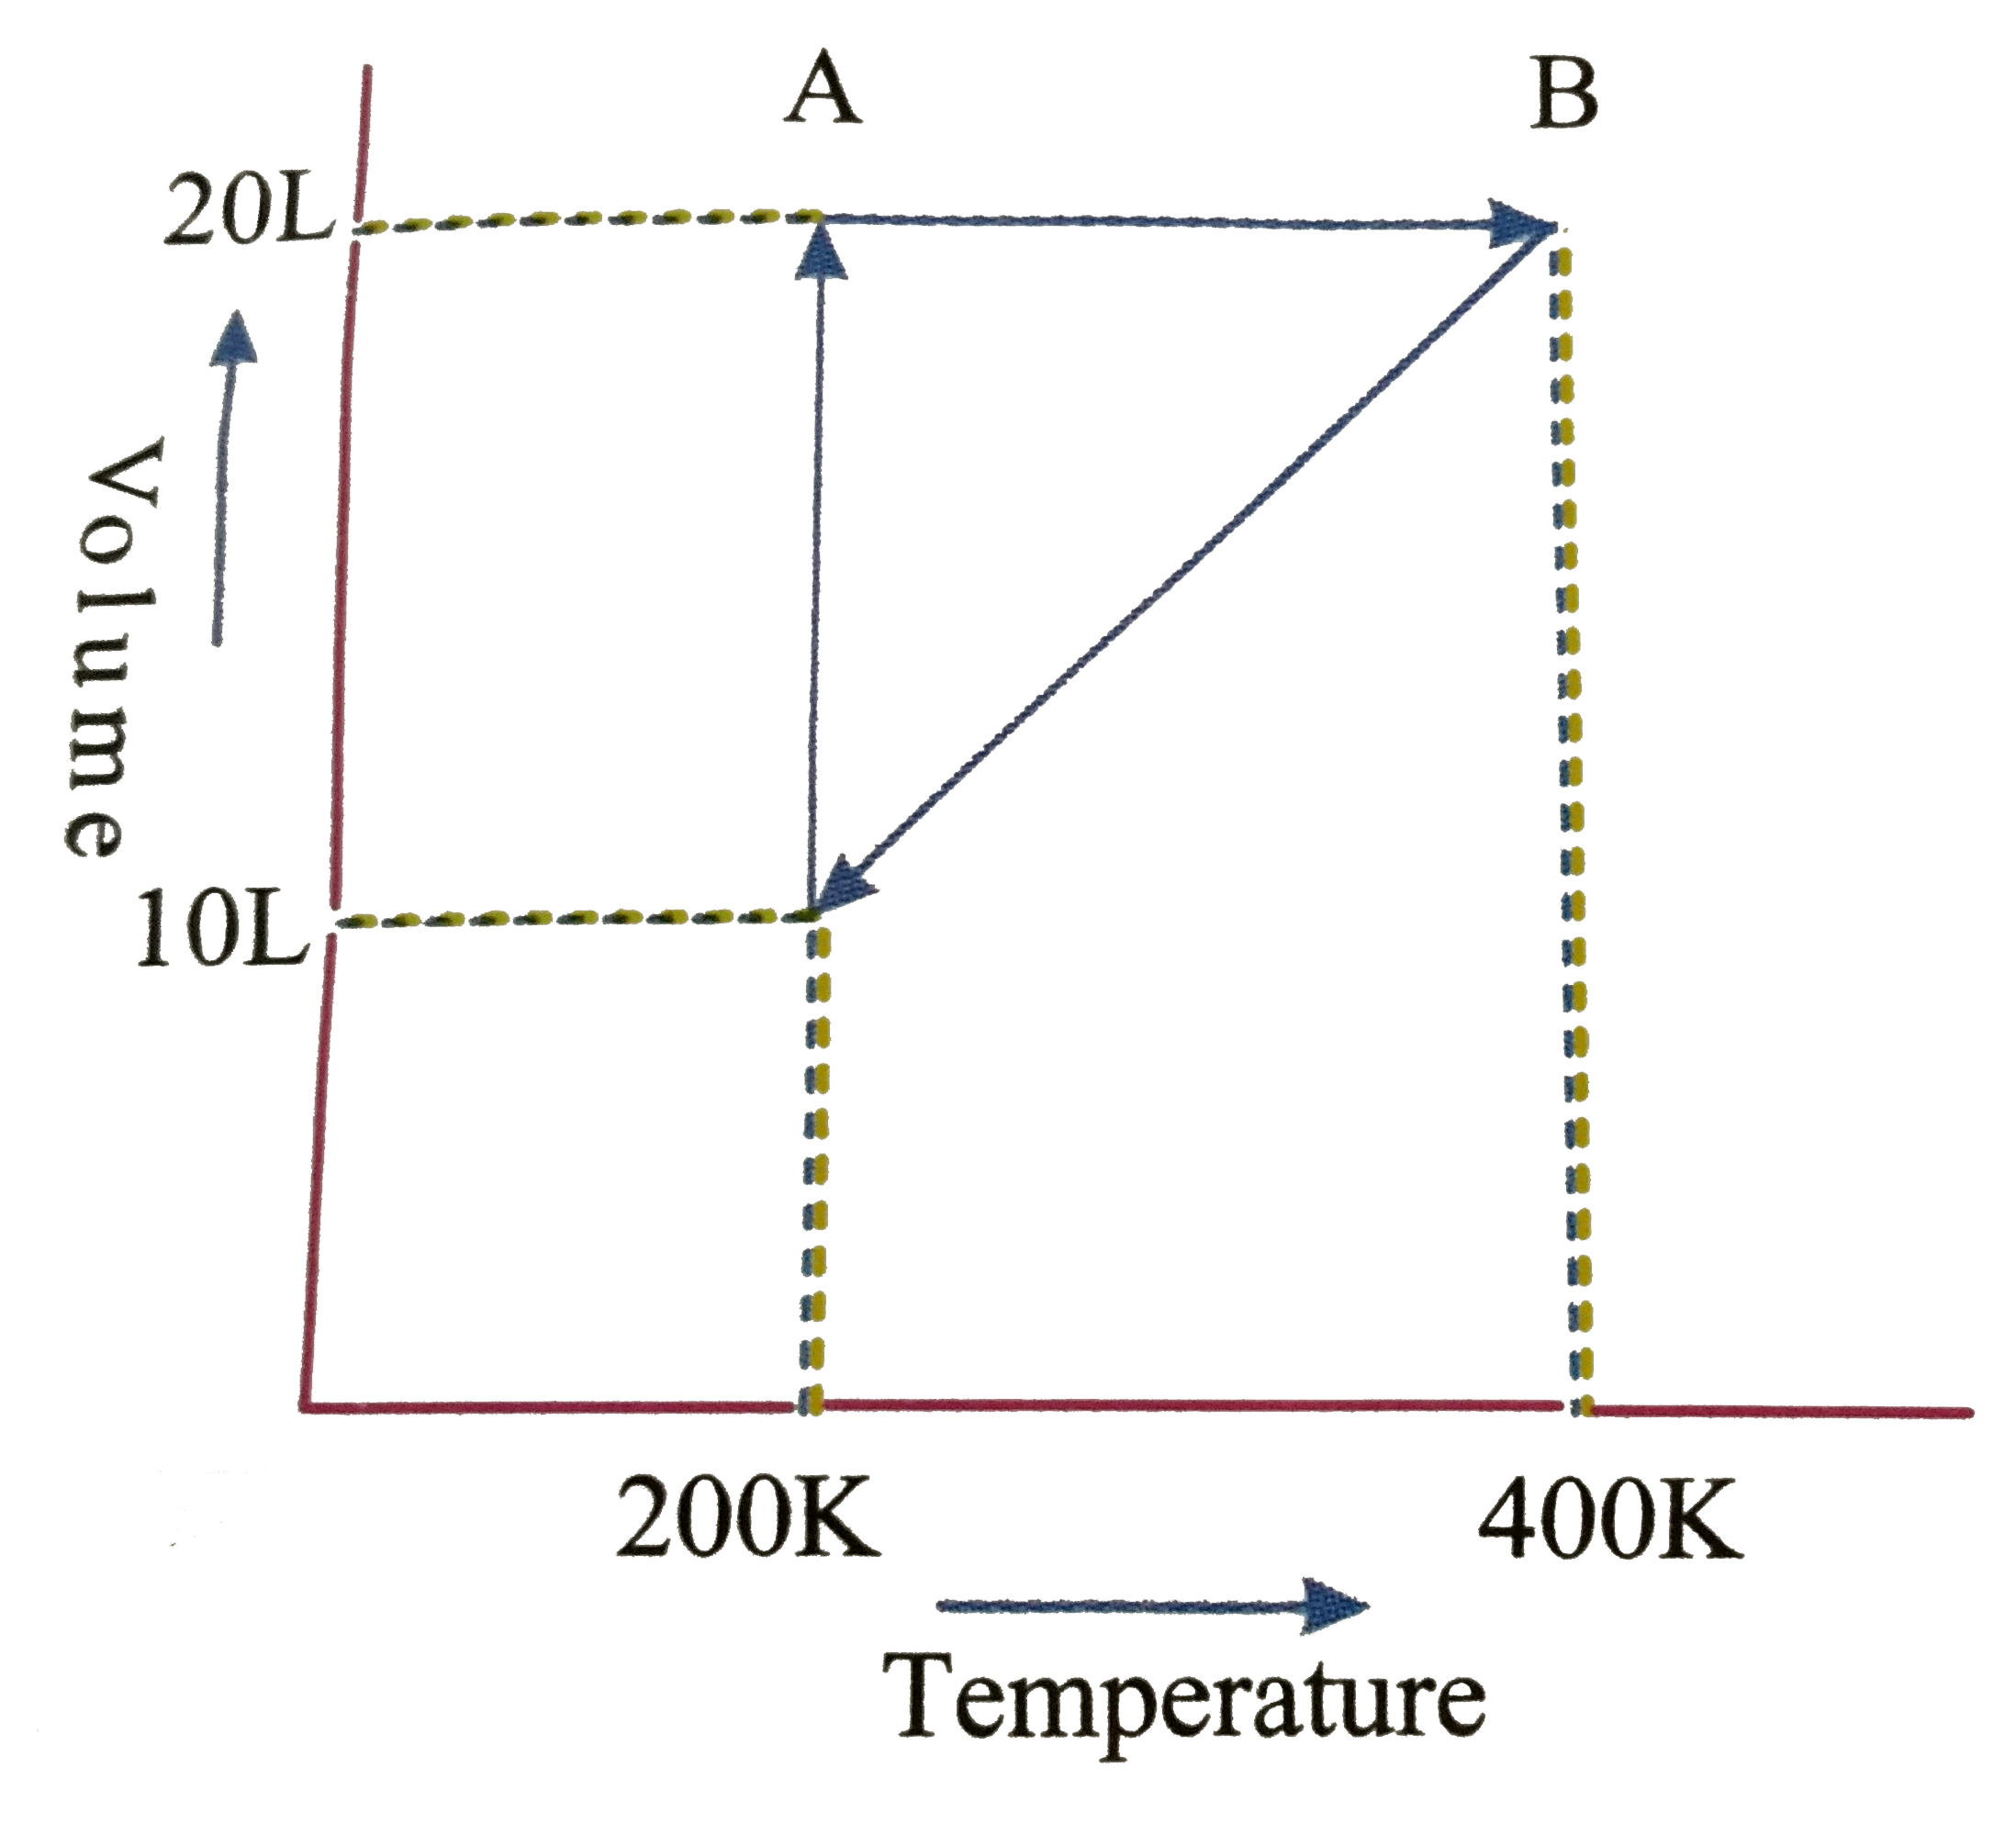
the process which occurs in going from, B→C isAIsothermalBAdiabaticCIsobaricDIsochoric
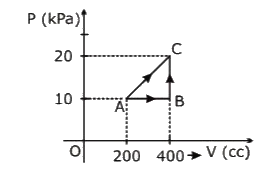
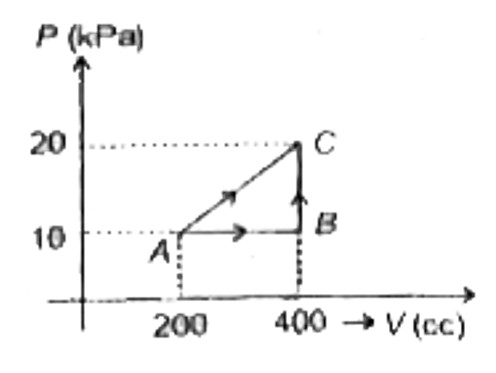
If a gas is taken A to C through B then heat absorbed by the gas is 8 J. Heat absorbed by the gas in taking it from A to C directly is -

View SolutionIf a gas is taken from A to C through B then heat absorbed by the gas 8 J . Heat absorbed by the gas in taking it from A to C directly is

View SolutionOne mole of a monatomic ideal gas is taken througlh a cycle ABCD as shown in the P-V diagram Column II gives the charctierstic involved in the cycle. Math them with each of the processes given in Column-I

Column−IColumn−II(A)ProcessA→B(p)Internal energy decreases(B)ProcessB→C(q)Internal energy incerease(C)ProcessC→D(r)Heat is lost(D)ProcessD→A(s)Heat is gained(t)Work is done on the gas
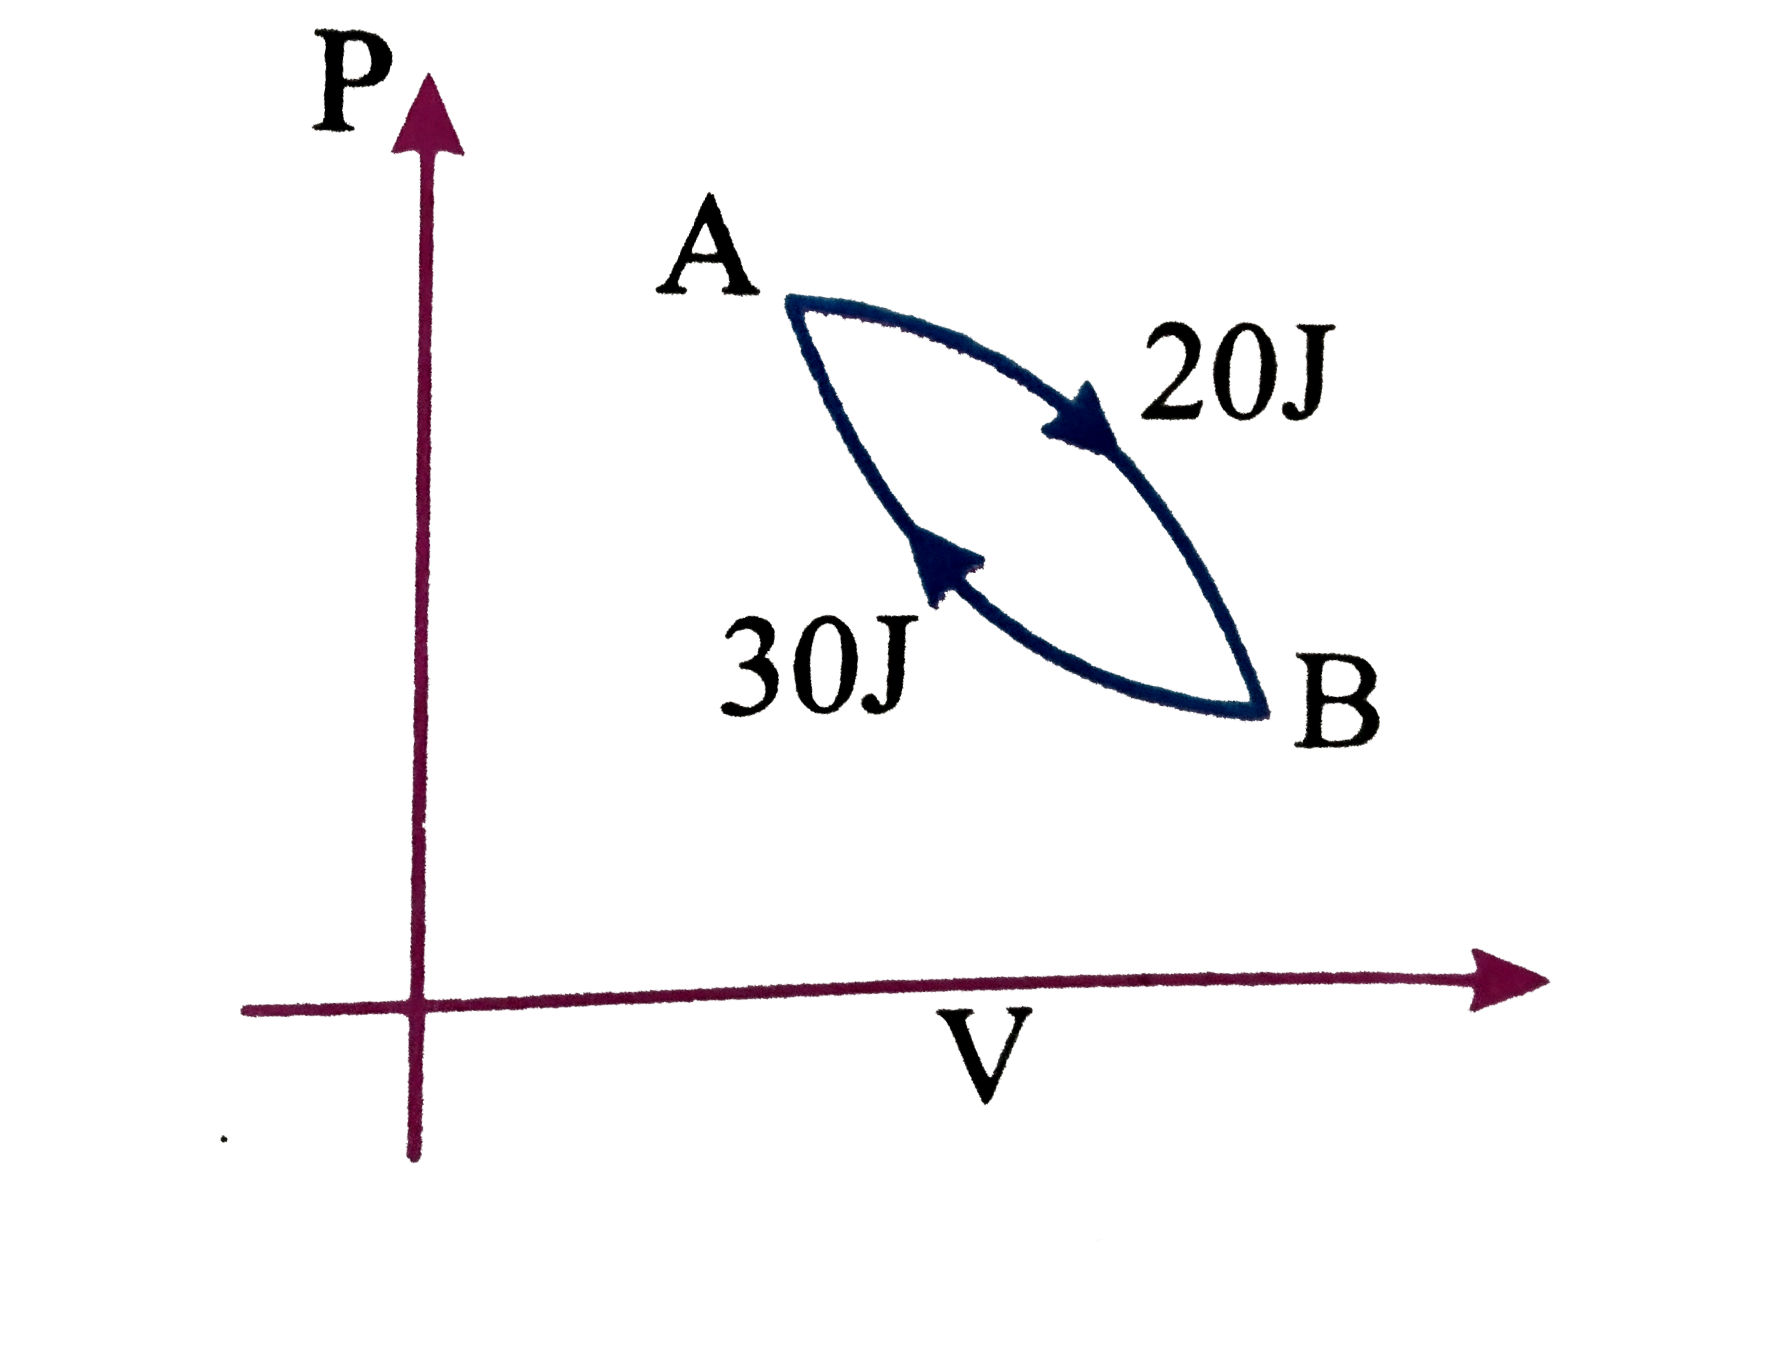
View SolutionIn a cyclic process shown in the figure an ideal gas is adiabatically taken from BtoA, the work done on the gas during the process BtoA is 30,J when the gas is taken from A to B the heat absorbed by the gas is 20J Then change in internal energy of the gas in the process A to B is :

View SolutionIf a gas is taken A to C through B then heat absorbed by the gas is 8 J. Heat absorbed by the gas in taking it from A to C directly is -

View Solution
