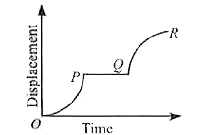
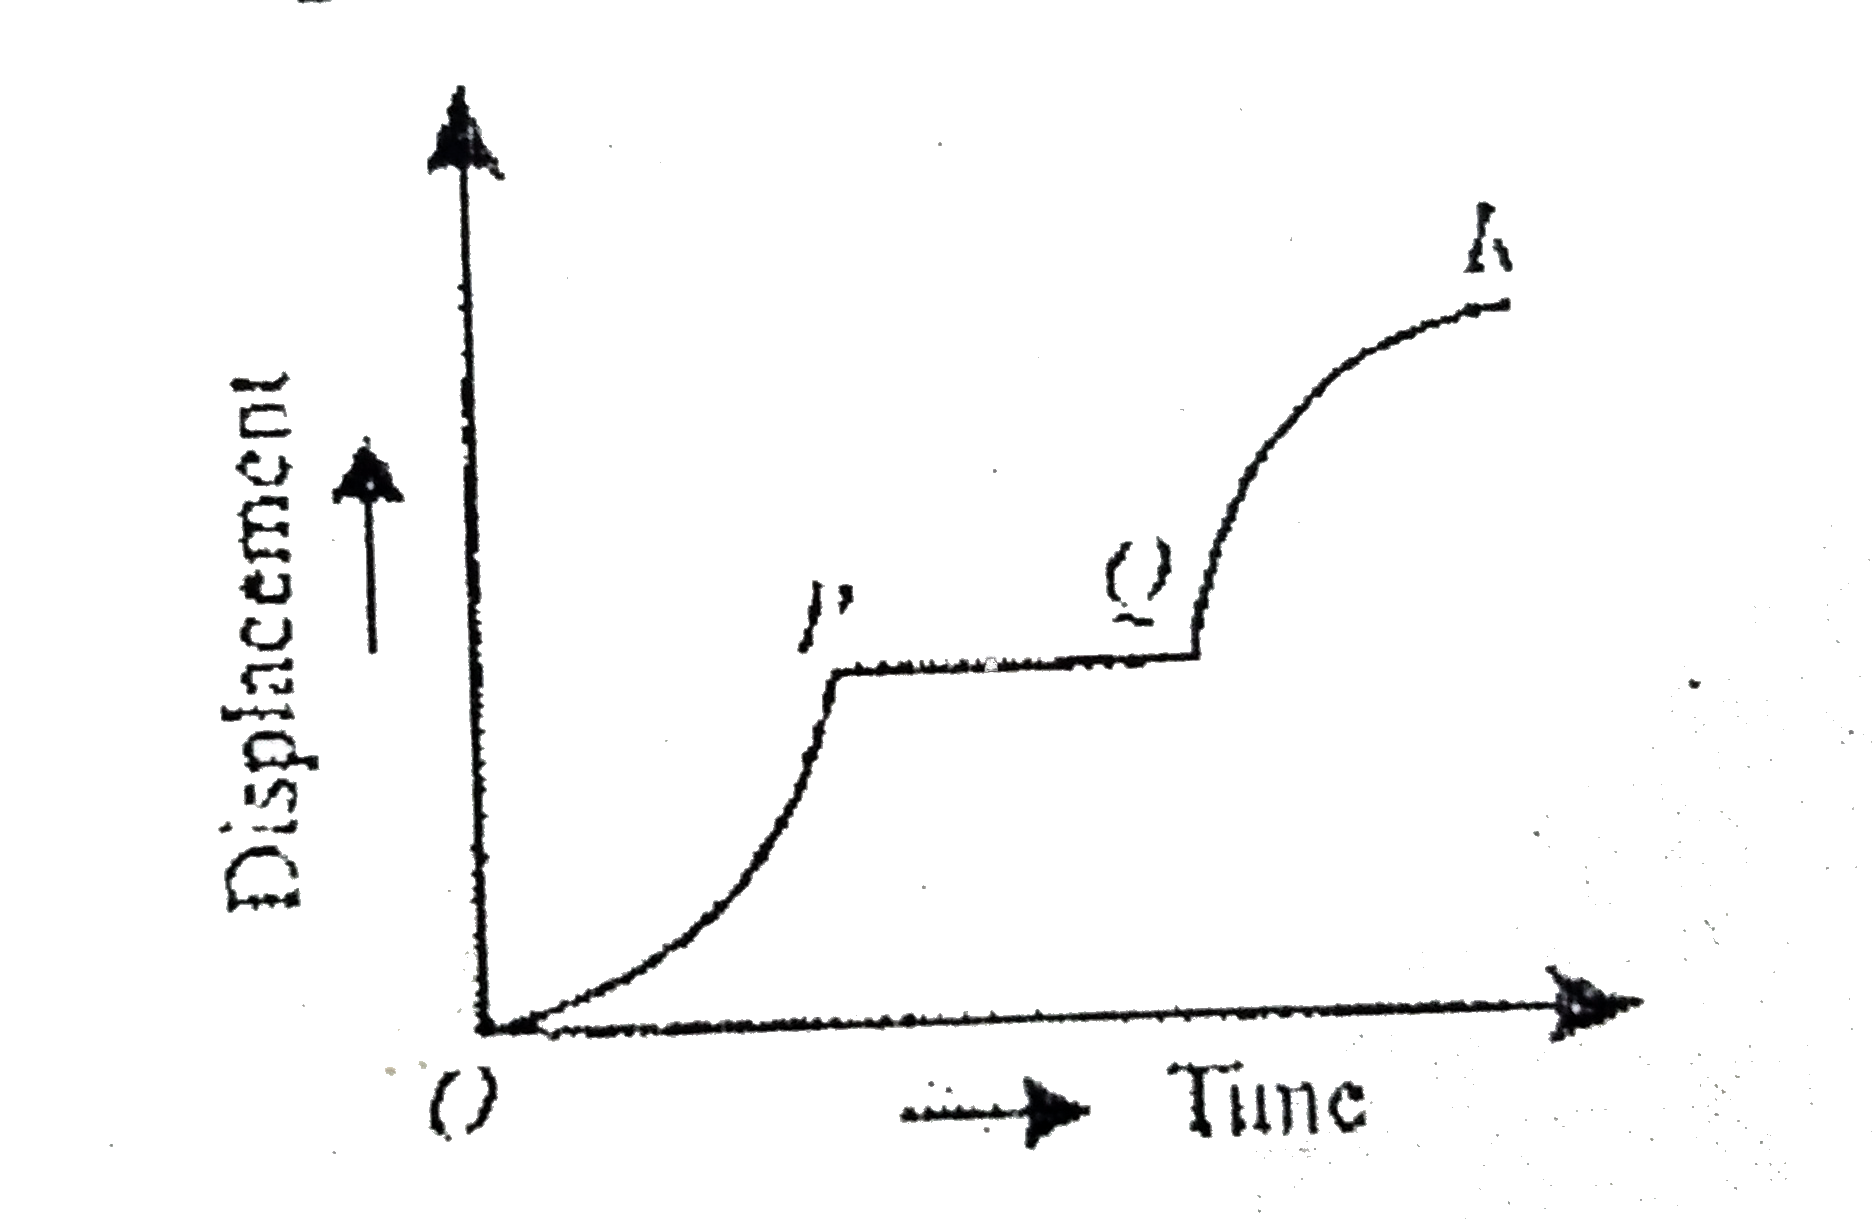
The displacement time graph of a particle moving along a straight line is shown. The accelerations of the particle during the regions OP, PQ and QR are

A
OPPQQP−0+
B
+0+
C
+0−
D
−0−
Text Solution
The correct Answer is:C
Acceleration =d2xdt2
For part OP, the acceleration is positive as the velocity is increasing. Slope is increasing. For part PQ, the acceleration is zero. Horizontal straight line shows that the velocity is zero. For part QR, acceleration is negative. It is retarded motion. Velocity is decreasing as the slope decreases with time.
|
Topper's Solved these Questions
- KINEMATICS BOOK - MTG-WBJEECHAPTER - KINEMATICS EXERCISE - WB JEE WORKOUT ( CATEGORY 3 : One or More than One Option Correct Type (2 Marks))
10 Videos
- KINEMATICS BOOK - MTG-WBJEECHAPTER - KINEMATICS EXERCISE - WB JEE Previous Years Questions (CATEGORY 1 : Single Option Correct Type (1 Mark) )
9 Videos
- KINEMATICS BOOK - MTG-WBJEECHAPTER - KINEMATICS EXERCISE - WB JEE Previous Years Questions (CATEGORY 3 : One or More than One Option Correct Type (2 Marks) )
1 Videos
- HEAT AND THERMAL PHYSICSBOOK - MTG-WBJEECHAPTER - HEAT AND THERMAL PHYSICSEXERCISE - WB JEE PREVIOUS YEARS QUESTIONS
15 Videos
- KINETIC THEORY OF GASES BOOK - MTG-WBJEECHAPTER - KINETIC THEORY OF GASES EXERCISE - WB JEE PREVIOUS YEARS QUESTIONS (MCQ)
7 Videos
Similar Questions
Knowledge Check
The displacement-time graph of a particle moving along a straight line is drawn below. The accelerations of the particle during the regions OP, PQ and QR are
 AOP = -, PQ = 0, QR = +BOP = +, PQ = 0, QR = +COP = +, PQ = 0, QR = -DOP = -, PQ = 0, QR = -
The distplcement time graph of a prticle moving alon a staraingt line is drawn below

The acceleration of the paritcle during the regions OP, PQ and QR areAOPPQQR−0+BOPPQQR+0+COPPQQR+0−DOPPQQR−0−Displacement time graph of a particle moving in a straight line is a shown in figure.
 Ain region A acceleration is positiveBin region B acceleration is negativeCin region C acceleration is positiveDin region D acceleration is negative
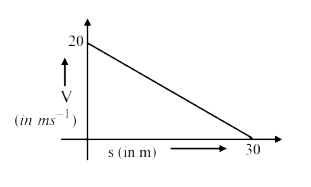
The velocity –position graph of a particle moving along a straight line is shown. Then acceleration of the particle at s = 15 m is :

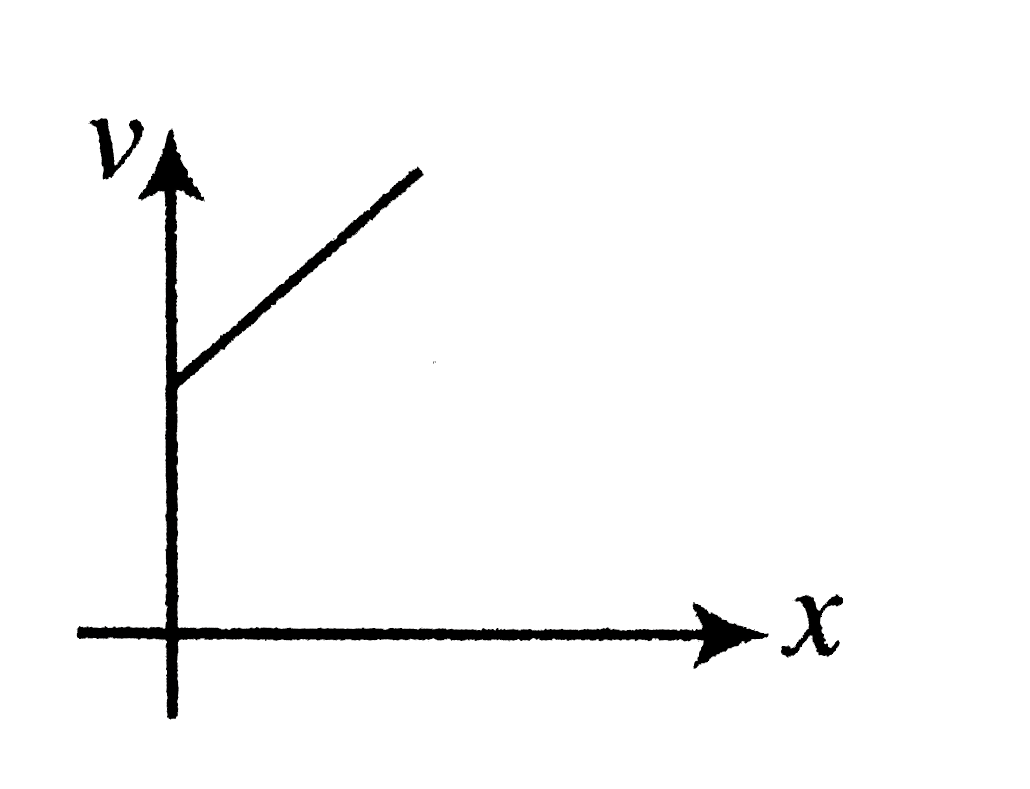
View SolutionVelocity versus displacement graph of a particle moving in a straight line as shown in figure.

The acceleration of the particle.
View SolutionVelocity displacement graph of a particle moving in a straight line is as shown in figure.

View SolutionThe velocity –position graph of a particle moving along a straight line is shown. Then acceleration of the particle at s = 15 m is :

View SolutionVelocity versus displacement graph of a particle moving in a straight line as shown in figure.

The acceleration of the particle.
View Solution
