The marks distribution of 30 students in a mathematics examination are given in the adjacent table. Find the mode of this data. Also, compare and interpret the mode and the mean.
 Solution in Telugu
The correct Answer is:52
Step by step video & image solution for The marks distribution of 30 students in a mathematics examination are given in the adjacent table. Find the mode of this data. Also, compare and interpret the mode and the mean. by Maths experts to help you in doubts & scoring excellent marks in Class 10 exams.
Topper's Solved these Questions
- BOOK - VGS PUBLICATION-BRILLIANTCHAPTER - STATISTICSEXERCISE - THINK & DISCUSS8videos
STATISTICS
- BOOK - VGS PUBLICATION-BRILLIANTCHAPTER - STATISTICSEXERCISE - Do THESE5videos
STATISTICS
- BOOK - VGS PUBLICATION-BRILLIANTCHAPTER - SIMILAR TRIANGLES EXERCISE - CREATIVE BITS FOR CCE MODEL EXAMINATION90videos
SIMILAR TRIANGLES
- BOOK - VGS PUBLICATION-BRILLIANTCHAPTER - SUMMATIVE ASSESSMENTEXERCISE - SUMMATIVE ASSESSMENT61videos
SUMMATIVE ASSESSMENT
Similar Questions
The mean value can be calculated from both ungrouped and grouped date . Which one you think is more accurate ? Why ?
01:57View SolutionFind the mode of the following data.
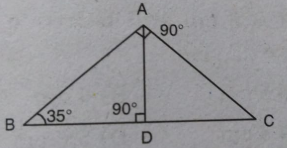
5 ,6, 9 ,10 , 6,12 ,3,6, 11,10 , 4 , 6 , .02:11View SolutionFrom the figure ,∠DAC……….
 01:31View Solution
Ramu says, "If log10x=0, value of x=0". Do you agree with him ? Give reason.
02:45View SolutionThe marks distribution of 30 students m a mathematics examination are given in Table of Example 1. Find the mode of this data. Also compare and interpret the mode and the mean.
02:17View SolutionDetermine the point of symmetry of a regular hexagon.
05:41View SolutionDtermine the images of the following figure about the given line :
03:28View SolutionMatch the following Column A to Column B
 02:31View Solution
Match the following Column A to Column B
 02:21View Solution
Match the following Column A to Column B
 02:10View Solution
Find the area of figure given below.
 02:17View Solution
Find the perimeter of the figure given below.
 02:10View Solution
Find the area of the figure given below.
 04:23View Solution
The inequation represented by the graph given below is :
03:22View SolutionThe inequation that best describes the graph given below is _________
View SolutionThe inequation that best describes the following graph is _________
02:32View Solution

