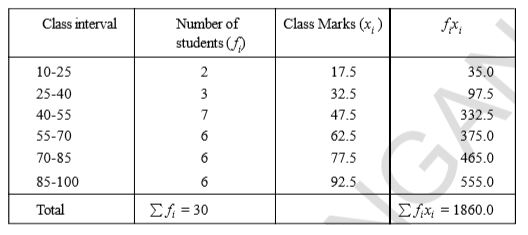
The marks distribution of 30 students in a mathematics examination are given in the adjacent table. Find the mode of this data. Also compare and interpret the mode and the mean .

The correct Answer is:52
Topper's Solved these Questions
- STATISTICSBOOK - NCERT GUJARATICHAPTER - STATISTICSEXERCISE - Exercise 14.1
9 Videos
- STATISTICSBOOK - NCERT GUJARATICHAPTER - STATISTICSEXERCISE - Exercise 14.2
6 Videos
- SIMILAR TRIANGLES BOOK - NCERT GUJARATICHAPTER - SIMILAR TRIANGLES EXERCISE - TRY THIS
6 Videos
- TANGENTS AND SECANTS TO A CIRCLEBOOK - NCERT GUJARATICHAPTER - TANGENTS AND SECANTS TO A CIRCLEEXERCISE - Try this
2 Videos
Similar Questions
The marks distribution of 30 students m a mathematics examination are given in Table of Example 1. Find the mode of this data. Also compare and interpret the mode and the mean.
View SolutionThe marks distribution of 30 students m a mathematics examination are given in Table of Example 1. Find the mode of this data.
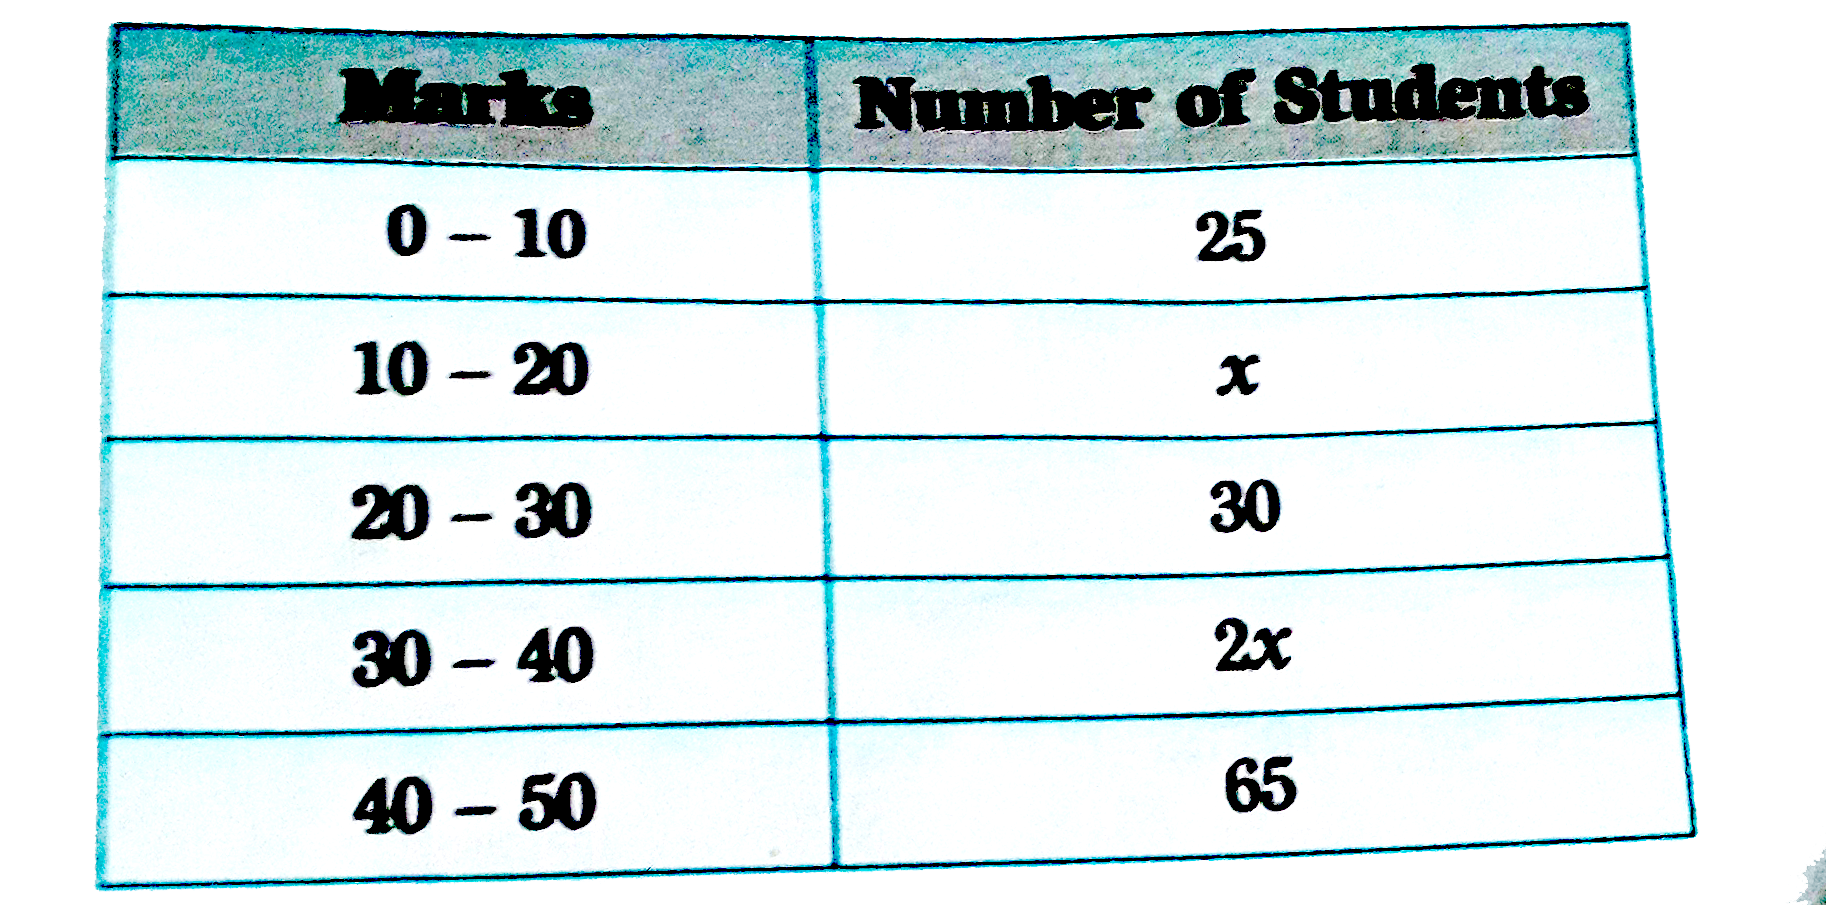
View SolutionThe following frequency distribution table shows marks obtained by 180 students in Mathematics examination :

Find the value of x.
Also draw a histogram representing the above informations.
View SolutionThe marks out of 40 scored by 7 students in Mathematics are given below :
40,39,40,37,35,39,40.
Find the medium and the mode of these marks.
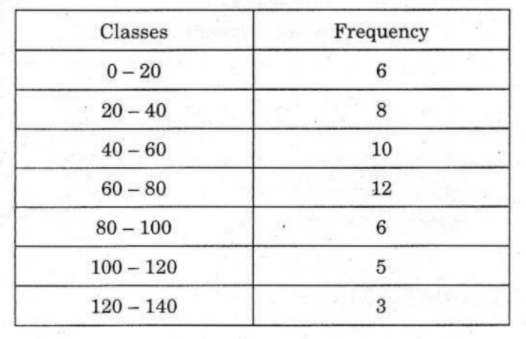
View SolutionFind the mean, median and mode of the following data :

View SolutionFind the mean, median and mode of the following data :
View SolutionFind the mean, median and mode of the following data :

View SolutionFind the mean, median and mode of the following data.

View SolutionFind the mean, median and mode of the following data:

View SolutionFind mean, median and mode of the following data :

View Solution
