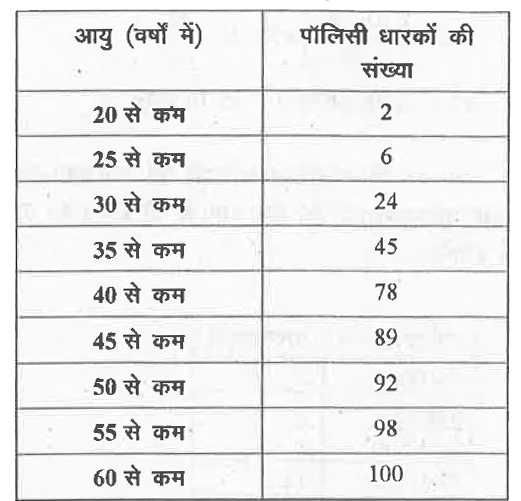
A life insurance agent found the following data about disribution of ages of 100 policy holders . Calulate the median age . [ Policies are given only to persons having age 18 years onwards but less than 60 years . ]
![A life insurance agent found the following data about disribution of ages of 100 policy holders . Calulate the median age . [ Policies are given only to persons having age 18 years onwards but less than 60 years . ]](https://d10lpgp6xz60nq.cloudfront.net/physics_images/BRS_MAT_X_QB_C14_E05_003_Q01.png) Solution in Telugu
Solution in Telugu
The correct Answer is:Median = 35.76
Step by step video & image solution for A life insurance agent found the following data about disribution of ages of 100 policy holders . Calulate the median age . [ Policies are given only to persons having age 18 years onwards but less than 60 years . ] by Maths experts to help you in doubts & scoring excellent marks in Class 10 exams.
Updated on:21/07/2023Topper's Solved these Questions
- STATISTICSBOOK - VGS PUBLICATION-BRILLIANTCHAPTER - STATISTICSEXERCISE - EXERCISE 14 .4
2 Videos
- STATISTICSBOOK - VGS PUBLICATION-BRILLIANTCHAPTER - STATISTICSEXERCISE - EXERCISE
146 Videos
- STATISTICSBOOK - VGS PUBLICATION-BRILLIANTCHAPTER - STATISTICSEXERCISE - EXERCISE 14 .2
6 Videos
- SIMILAR TRIANGLES BOOK - VGS PUBLICATION-BRILLIANTCHAPTER - SIMILAR TRIANGLES EXERCISE - CREATIVE BITS FOR CCE MODEL EXAMINATION
90 Videos
- SUMMATIVE ASSESSMENTBOOK - VGS PUBLICATION-BRILLIANTCHAPTER - SUMMATIVE ASSESSMENTEXERCISE - SUMMATIVE ASSESSMENT
61 Videos
Similar Questions
The following distribution gives the daily income of 50 workers of a factory .
Daily (in Rupees)Number of workers250−30012300−35014350−4008400−4506450−50010
Convert the distribution above to a lessthan type cumulative frequency distribution, and draw its ogive .
View SolutionThe mean value can be calculated from both ungrouped and grouped date . Which one you think is more accurate ? Why ?
View SolutionThe following table shows the ages of the patients admitted in a hospital during a year :
Age (in years)Number of patients5−15615−251125−352135−452345−551455−655
Find the mode and the mean of the data given above . Copmare and interpret the two measures of central tendency .
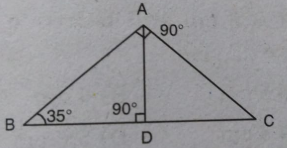
View SolutionFrom the figure ,∠DAC……….
View SolutionRamu says, "If log10x=0, value of x=0". Do you agree with him ? Give reason.
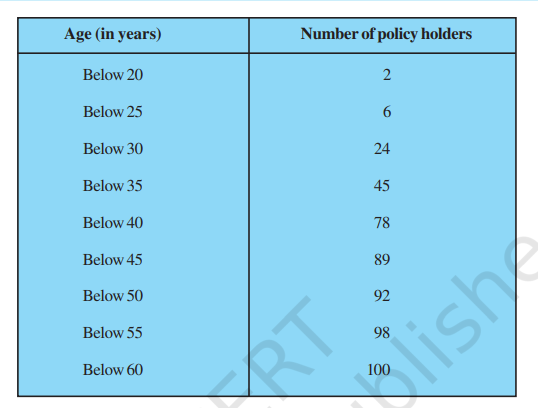
View SolutionA life insurance agent found the following data for distribution of ages of 100 policy holders. Calculate the median age, if policies are given only to persons having age 18 years onwards but less than 60 year.
View SolutionDtermine the images of the following figure about the given line :
View SolutionMatch the following Column A to Column B

View SolutionMatch the following Column A to Column B

View SolutionThe inequation represented by the graph given below is :
View SolutionThe inequation that best describes the graph given below is _________
View SolutionThe inequation that best describes the following graph is _________
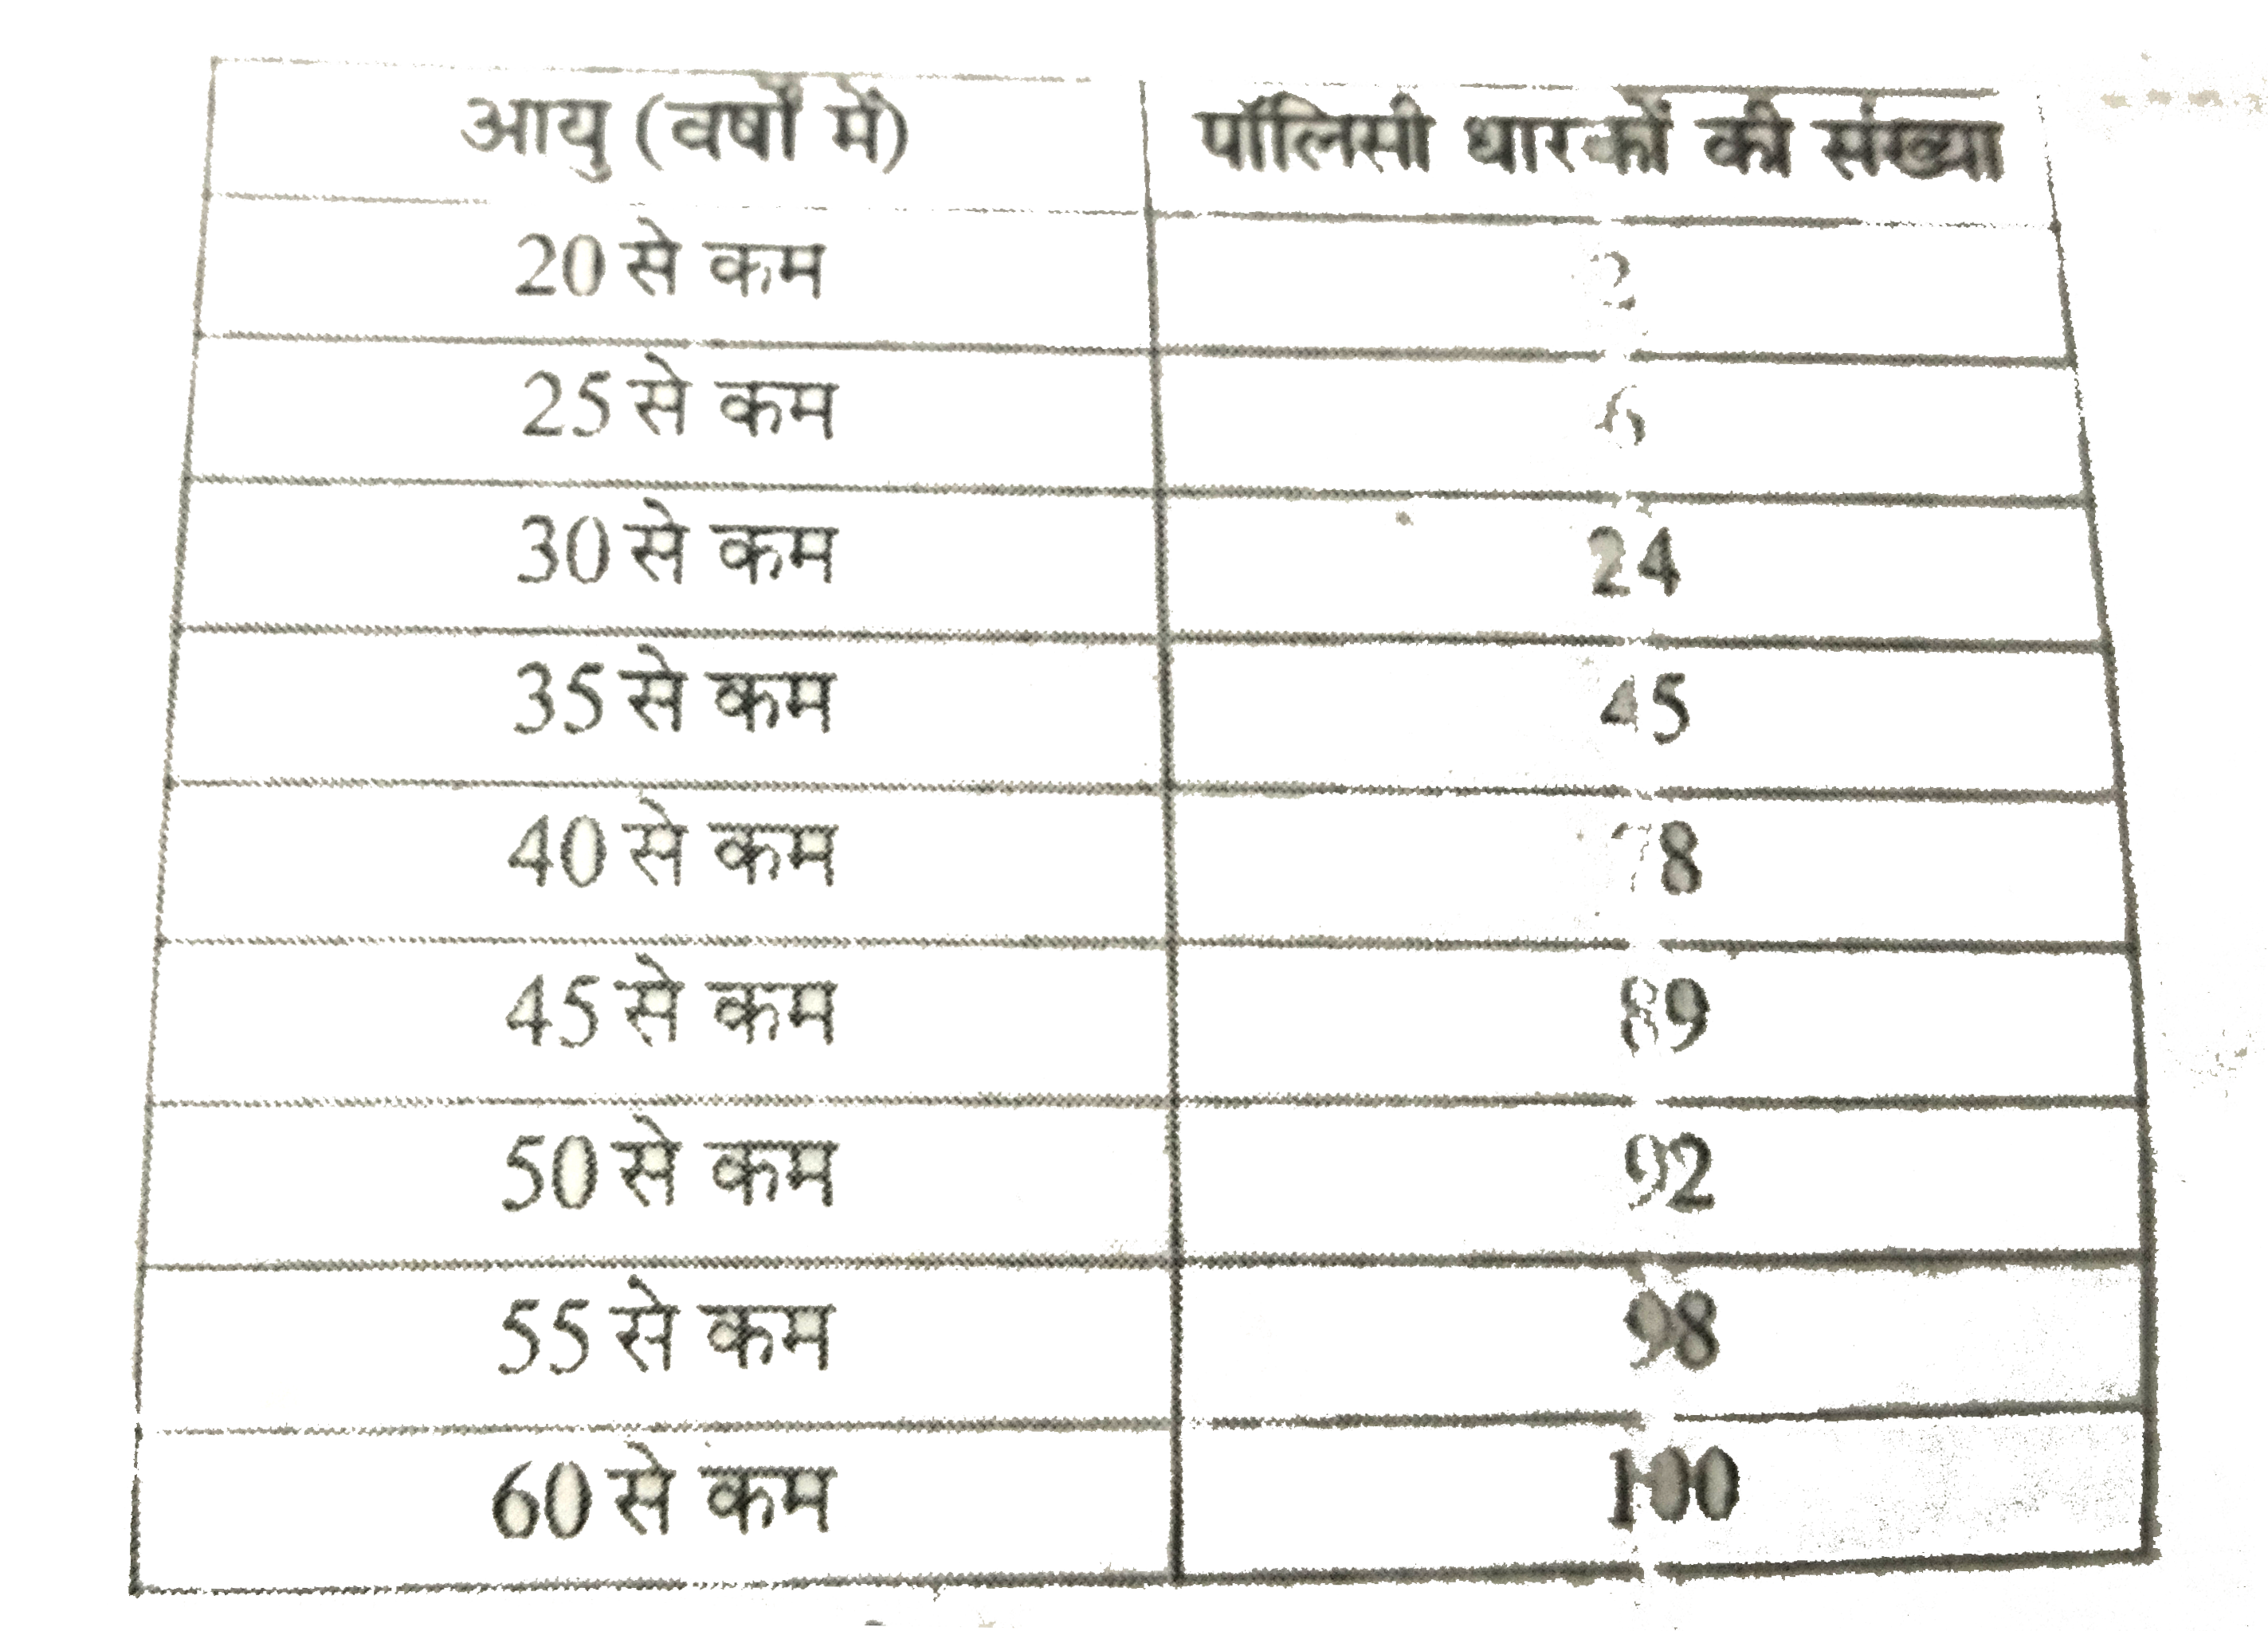
View Solutionएक जीवन बीमा एजेंट 100 पॉलिसी धारकों की आयु के बंटन के निम्नलिखित आँकड़ें प्राप्त करता है । माध्यक आयु परिकलित कीजिए, यदि पॉलिसी केवल उन्हीं व्यक्तियों को दी जाती है, जिनकी आयु 18 वर्ष का उससे अधिक हो, परन्तु 60 से कम हो ।
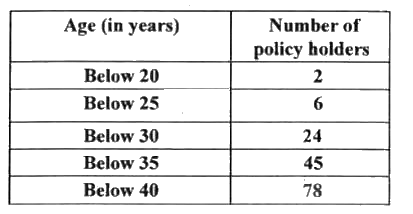
View SolutionA life insurance agent found the following data for distribution of ages of 100 policy holders. Calculate the median age, if policies are given only to persons having age 18 years onwards but less than 60 year.

View Solutionएक जीवन बीमा एजेंट 100 पालिसी धारको क़ि आयु में बटन के निम्नलिखित आकड़ो ज्ञात करता है माधयक आयु परिकलित कीजिये, यदि पालिसी केवल उन्ही व्यक्तियों को दी जाती है जिनकी आयु 18 वर्ष या उससे अधिक हो परन्तु वर्ष 60 से कम हो
View Solution
